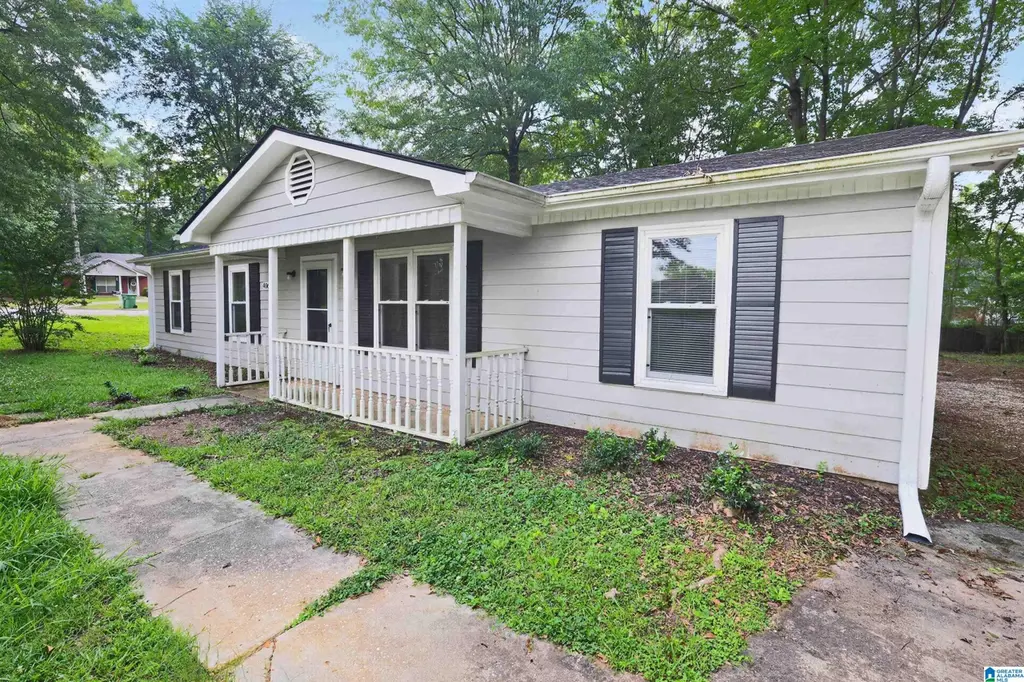
4068 Bonfield Dr · Montgomery, AL
Flood risk 1/10 · Minimal
- FEMA flood zone
- X (unshaded)
- Chance of flooding over 30 yrs
- 0.0%
- Est. flood insurance / yr
- $507 – $1,088
Fire risk 3/10 · Minor
- Est. fire insurance / yr
- $916 – $1,700
Heat risk 7/10 · Major
- Hot days now (above 108°F)
- 7 days/yr
- Hot days in 30 yrs
- 20 days/yr
Wind risk 8/10 · Major
- Chance of severe wind over 30 yrs
- 80.0%
Air-quality risk 2/10 · Minimal
- Unhealthy air days now
- 1 days/yr
- Unhealthy air days in 30 yrs
- 3 days/yr
Risk factors via First Street. Map © Google.
Why this score? — see what drove the C- grade
The composite is a weighted blend of 9 inputs, each scored 0–100. Each bar is that input's sub-score; the figure is the points it added to the 100-point composite (weight × sub-score).
- Cash flow +25.5/30.0
- DSCR +8.5/10.0
- 1% rule +6.2/10.0
- Rent growth +3.9/5.0
- Livability +3.2/5.0
- Condition / age +2.5/5.0
- Schools +1.7/10.0
- ARV discount +0.0/15.0
- Appreciation +0.0/10.0
$114,900
🖨 Deal sheet 📄 Offer letter ✓ Due diligence
Listing remarks MLS
Great property for an investor OR first time home buyer. This property is located in a serene and quiet neighborhood! Each bedroom has plenty of space and the master bedroom has it's own private bathroom! The kitchen has it's own eat-in space and the back patio is located right off the kitchen! The backyard has tons of space and beautiful mature trees that offer tons of shade! There is also a detached storage shed in the backyard that can easily be used as a workshop! Do not miss your opportunity, this one won't last long!
Key facts
- Local schools
- Shopping
- Outdoor space
Tags
Property features AI
Finance
- Other: Lot size about 0.26 acres; Located in Hunters Point subdivision
- HOA & community: No association fee
Exterior
- Parking: Driveway parking
- Security: No security features listed
- Utilities: Public water; Connected sewer; Electric water heater; Internet service available
- Home design: Existing (previously constructed) single-family home; Slab foundation
- Construction: Concrete/block construction
- Exterior features: Front porch; Open patio; Garden/patio area; Covered deck
Interior
- Kitchen: Laminate countertops; Dishwasher (built-in); Refrigerator
- Bedrooms: Three bedrooms on level 1 (approx. sizes: 14.7 x 10.5; 10.7 x 11.1; 9.10 x 11.1)
- Flooring: Carpet; Hardwood-look laminate; Tile flooring
- Bathrooms: Two full bathrooms with tub/shower combo
- Heating & cooling: Central heating (electric); Central air conditioning (electric)
- Interior features: Ceilings: Other (see remarks); No special interior features listed
- Laundry & utility: Main-level laundry room (approx. size 5.11 x 10.5)
Neighborhood map
What this means for you Summary
Snapshot
- This is a 3-bed/2.0-bath single-family listed at $115k.
Deal economics
- At list price, monthly cash flow is $269 ($3k/yr) — positive.
- The deal already cash-flows at list — no discount required.
- Meets the 1% rule at list price ($1k rent vs $115k).
- Cap rate 9.1% vs local median 6.0% in Montgomery — top-decile yield for the area; either an underpriced asset or a hidden risk that comps aren't pricing in. Stress-test before assuming the spread holds.
Location & tenants
- Location reads 65/100 on livability (#138 in AL) — a middle-class / working-renter tenant base. Strengths: cost of living A+, housing A+; Watch: employment D, crime F, amenities D-.
- Montgomery County (urban): math 9% / reading 31% proficiency, ranked #106 of 129 in AL (top 82%) — low school quality limits family demand, transient renter base, plan for 1-2y turnover; 70% free/reduced lunch — lower-income household profile, screen leases tightly.
- Zoned schools: Fitzpatrick Elementary School (math 2% / reading 22%, grade F, #536 of 627 statewide, top 88%, 363 students, 95% FRL); Jefferson Davis High School (math 3% / reading 16%, grade F, #258 of 305 statewide, top 85%, 1,522 students, 83% FRL) — zoned schools average 89% FRL vs 70% district-wide (19 pts higher); higher-poverty schools than district average — tighter screening recommended.
- Market conditions: Rents rising fast (+5.7%/yr); 293 active listings in the ZIP; 19 comparable units currently listed for rent nearby; rentals lingering (median 44d on market — plan ~5-8 weeks vacancy on turnover, expect pricing pressure); 63% of comp listings sitting > 30 days — soft ceiling on asking rent; 460 units permitted in Montgomery County in 2024 (37 in 5+ unit buildings).
Forward outlook
- Local home prices are declining (-3.0%/yr); year-one equity from $794 of loan paydown is wiped out by about $3k of value loss. Plan a longer hold.
- Montgomery County population projected to shrink 8% by 2050 — rents likely to lag national; underwrite the cash flow, not the appreciation.
- At projected returns (-3.0% appreciation + 5.7% rent growth), your $32k cash investment doubles in ~9 years — after that, you're playing with house money.
Negotiation context
- Only 14 days on market — expect competitive offers; lowballing is unlikely to land.
- 4 sale attempts since 11y ago with the ask held roughly flat each time — persistent listings suggest the price (not the market) is what's stuck; bring a comps-based counter.
Risks & watch-outs
- Climate carrying-cost: severe wind risk, 80% chance of damaging wind over 30y; extreme-heat days projected 7→20/yr by 2055 (HVAC capex compounding) — expect insurance premiums to compound above CPI over the hold.
Questions for the listing agent
- Is there a deadline driving the sale (1031 exchange, divorce, estate, relocation)? That informs how much negotiation room exists.
- Crime grade is F in this area — have there been break-ins, vandalism, or insurance claims at this property in the last 3 years? What carrier currently insures it and at what premium?
- What's the average days-on-market for RENTAL listings here right now (not sales)? A rising rental-DOM trend means longer vacancies and softer asking-rent achievability than the comps imply.
- What's the recent tenant-quality profile in this submarket — average credit score on applications, eviction rate, late-payment / NSF rate, and stable-employment percentage? A property-management company in the area should have these aggregated.
- How much new for-sale + rental construction is in the pipeline within 1–3 miles? Heavy new supply typically softens prices + rents 12–24 months out; constrained supply supports both.
Investment metrics
- 1% rule
- 1.12% ✓
- Cap rate
- 9.10%
- Cash-on-cash
- 10.03%
- DSCR
- 1.45
- GRM
- 7.4
CMA / ARV
- ARV (on-the-fly)
- $89,856
- Comps found
- 9
Show comp detail 9 sales within ~0.75 mi
| Address | Dist | Beds/Ba | Sqft | Sold | Price | $/sf | Match |
|---|---|---|---|---|---|---|---|
| 4012 Amberly Rd | 0.22mi | 3/2.0 | 1,454 (+4%) | 5mo | $86,000 | $59 | 80 |
| 3746 Mosswood Dr | 0.21mi | 3/2.0 | 1,463 (+4%) | 14mo | $165,000 | $113 | 72 |
| 4133 Fitzpatrick Blvd | 0.21mi | 3/2.0 | 1,344 (-4%) | 15mo | $120,000 | $89 | 70 |
| 4012 Monterey Ct | 0.35mi | 3/1.5 | 1,288 (-8%) | 1mo | $107,000 | $83 | 67 |
| 6148 Sherburn Rd | 0.39mi | 3/2.0 | 1,209 (-14%) | 0mo | $77,000 | $64 | 58 |
| 6273 Briarwood Ln | 0.30mi | 4/2.0 (+1) | 1,275 (-9%) | 14mo | $75,000 | $59 | 54 |
| 4137 Fitzpatrick Blvd | 0.21mi | 4/2.0 (+1) | 1,230 (-12%) | 19mo | $135,000 | $110 | 49 |
| 6017 Oakleigh Rd | 0.72mi | 3/2.0 | 1,227 (-13%) | 11mo | $68,000 | $55 | 36 |
| 6140 Cherry Hill Rd | 0.72mi | 4/2.0 (+1) | 1,227 (-13%) | 13mo | $75,000 | $61 | 30 |
Match score weights: distance 35% · size 25% · config 20% · recency 20%. Top-matched comps best support the ARV.
Projected returns pro-forma
-3.0% appreciation · 5.65% rent growth · sell at horizon
- IRR
- 1.6%
- Equity multiple
- 1.06×
- Total profit
- $2,026
- Equity at exit
- $17,132
- IRR
- 13.6%
- Equity multiple
- 2.21×
- Total profit
- $39,049
- Equity at exit
- $9,934
Cash invested: $32,172 (down + closing). Projections, not guarantees.
Landlord ↔ Tenant lean methodology
- Overall (STATE)
- 90 Strongly Landlord-Friendly
- State Alabama
- 90 Strongly Landlord-Friendly · R+15
- County
- — inherits STATE
- City
- — inherits STATE
ZIP-level market 36116
- Home prices YoY
- -9.7%
- Rents YoY
- 5.7%
- Active inventory
- 293
- Price-to-rent
- 7.4×
Monthly cashflow live
- Estimated rent
- $1,287 high interval (Pro) →
- Mortgage (P&I)
- −$603
- Tax from tax record
- −$97 /mo · $1,170/yr
- Insurance
- −$48
- HOA
- −$0
- Vacancy / Maint / Mgmt
- −$270
- Net cashflow
- $269
Break-even live
UW: 25.0% down · 7.5% · 30yr · 1.5% tax · 5.0% vac · 8.0% maint · 8.0% mgmt
Financing live
Cash to close
- Down payment
- $28,725
- Closing costs
- $3,447
- Reserves months
- —
- Total cash needed
- —
Loan-product check · same deal, 3 products live
Conventional
25% down · 7.5% · 30yr
- Down + closing
- —
- Monthly P&I
- —
- Monthly cashflow
- —
- DSCR
- —
- Eligible?
- —
Personal DTI + credit; lowest rate.
DSCR
20% down · 8.5% · 30yr
- Down + closing
- —
- Monthly P&I
- —
- Monthly cashflow
- —
- DSCR
- —
- Eligible?
- —
No personal income docs; deal must DSCR.
Hard money
10% down · 12.0% · 12mo
- Down + closing
- —
- Monthly P&I
- —
- Monthly cashflow
- —
- DSCR
- —
- Eligible?
- —
Short-term bridge; refi at stabilization.
Rent comps 19 comps
| Address | Beds | Baths | Sqft | Rent | $/sqft | DOM | Units | Dist |
|---|---|---|---|---|---|---|---|---|
| 3824 Glenfern Ct Montgomery, AL | 3.0 | 2.0 | 1600 | $1,450 | $0.91 | 43d | 1 | 0.32mi |
| 6061 Briarhurst Dr Montgomery, AL | 3.0 | 2.0 | 1124 | $1,075 | $0.96 | 43d | 1 | 0.57mi |
| 6105 Jennifer Ln Montgomery, AL | 3.0 | 2.0 | 1553 | $1,250 | $0.80 | 13d | 1 | 0.61mi |
| 6028 Oakleigh Rd Montgomery, AL | 3.0 | 2.0 | 1105 | $850 | $0.77 | 43d | 1 | 0.66mi |
| 5917 Cherry Hill Rd Montgomery, AL | 4.0 | 2.0 | 1161 | $1,450 | $1.25 | 13d | 1 | 0.85mi |
| 5931 Singleton St Montgomery, AL | 3.0 | 2.5 | 1302 | $695 | $0.53 | 43d | 1 | 0.90mi |
| 3240 Virginia Pines Ln Montgomery, AL | 3.0 | 2.0 | 1215 | $900 | $0.74 | 43d | 1 | 0.94mi |
| 4611 Virginia Loop Rd Montgomery, AL | 3.0 | 1.0 | 1029 | $1,195 | $1.16 | 21d | 1 | 0.96mi |
| 3231 Virginia Pines Ln Montgomery, AL | 2.0 | 2.0 | 1068 | $800 | $0.75 | 43d | 1 | 0.96mi |
| 4590 Troy Hwy Montgomery, AL | 2.0–3.0 | 2.0 | 1330 | $1,299 | $0.98 | 13d | 1 | 0.98mi |
| 4025 Edge Hill Ln Montgomery, AL | 3.0 | 2.0 | 1154 | $1,350 | $1.17 | 13d | 1 | 1.01mi |
| 4604 Virginia Loop Rd Montgomery, AL | 1.0–2.0 | 1.0–2.0 | 810 | $895 | $1.10 | 43d | 1 | 1.03mi |
| 2699 Whispering Pine Dr Montgomery, AL | 4.0 | 2.0 | 1500 | $1,500 | $1.00 | 13d | 1 | 1.10mi |
| 3855 Woodley Rd Montgomery, AL | 4.0 | 2.0 | 1450 | $1,450 | $1.00 | 43d | 1 | 1.16mi |
| 3220 Virginia Downs Montgomery, AL | 3.0 | 2.0 | 1215 | $900 | $0.74 | 43d | 1 | 1.31mi |
| 3248 Meadow Walk Ln Montgomery, AL | 3.0 | 2.0 | 1114 | $1,200 | $1.08 | 43d | 1 | 1.36mi |
| 3110 Virginia Downs Montgomery, AL | 2.0 | 2.0 | 1068 | $800 | $0.75 | 43d | 1 | 1.36mi |
| 5819 Brewbaker Blvd Unit 5819 Montgomery, AL | 2.0 | 2.0 | 1200 | $1,200 | $1.00 | 43d | 1 | 1.47mi |
| 3633 Woodley Rd Montgomery, AL | 4.0 | 2.0 | 1734 | $1,600 | $0.92 | 21d | 1 | 1.48mi |
Listing history 11 events
-
2026-06-18days on market $114,900 Active 14 DOM
-
2026-06-17days on market $114,900 Active 13 DOM
-
2026-06-16days on market $114,900 Active 12 DOM
-
2026-06-15days on market $114,900 Active 11 DOM
-
2026-06-14days on market $114,900 Active 9 DOM
-
2026-06-13days on market $114,900 Active 8 DOM
-
2026-06-10days on market $114,900 Active 6 DOM
-
2026-06-09days on market $114,900 Active 5 DOM
-
2026-06-08days on market $114,900 Active 4 DOM
-
2026-06-07remarks 699-char remark
-
2026-06-07$114,900 Active 3 DOM
ⓘ Source: listings_history table (triggers on properties + properties_extension) + one-shot
backfill from property_details.listing_events for pre-trigger history.
Tax reassessment forecast AL · Resets to sale price
- Current annual tax
- $1,170 · $97/mo
- Projected year-2 tax
- $1,170 · $97/mo
- Expected delta
- $0/yr ($0/mo · 0.0%)
ⓘ Screening estimate from a state-policy table — verify with the county assessor before closing.
Climate risk First Street
- Flood 1/10 Low FEMA zone X (unshaded) · 0% chance over 30 yrs
- Wildfire 3/10 Moderate
- Heat 7/10 Severe 7 d/yr ≥108°F today · 20 d/yr by 30 yrs out
- Wind 8/10 Severe 80% chance of damaging wind over 30 yrs
- Air quality 2/10 Low 1 unhealthy d/yr today · 3 by 30 yrs out
Nearby sold comps map
Loading sold comps map…
Walkable amenities ~0.75 mi
Loading nearby amenities…
Taxation est. · year 1
- Rental income
- $15,446
- − Mortgage interest
- −$6,436
- − Property taxes
- −$1,170
- − Insurance
- −$574
- − Repairs & maintenance
- −$1,236
- − Management
- −$1,236
- − Depreciation
- −$3,343
- Taxable income
- $1,452
- Est. tax owed @ 24.0%
- −$348
- After-tax cash flow
- $2,879/yr
For passive investors: Depreciation is non-cash, so a rental often shows a tax loss while cash-flowing — sheltering income. Rental losses are passive: they offset passive income freely, and up to $25,000/yr can offset ordinary (W-2) income if you actively participate and your MAGI is under $100k (phasing out to $0 by $150k); unused losses carry forward. On sale, claimed depreciation is recaptured at up to 25%, and gains may owe capital-gains tax (a 1031 exchange can defer both). Figures are a year-1 estimate at your 24.0% rate — not tax advice; consult a CPA.
Schools (NCES district)
- District
- Montgomery County
- NCES district ID
- 0102430
- Math proficiency
- 9% ▼ -21.00%
- Reading proficiency
- 31% ▼ -1.00%
- Median HH income
- $43,902
- Composite
- 17.24/100
- National rank
- #9093
- State rank
- #106 of 129 in AL
Livability — Montgomery
- Score
- 65/100
- State rank
- #138
- US rank
- #13416
Category grades
Schools grade is shown separately in the Schools card above.
Census & demographics
- Census place
- Montgomery, AL
- County
- Montgomery County · 190,016 people
- City population
- 175,913
- Metro
- Montgomery, AL
- Population (ZIP)
- 45,250
- Household income
- $55,160
- Rent vs Own
- Severe rent burden
- 2786.0
Population outlook (Montgomery County) Hauer SSP2
- Today (2025)
- 224,008 people
- By 2030
- 221,460 · -1.1%
- By 2040
- 214,179 · -4.4%
- By 2050
- 204,912 · -8.5%
- By 2075
- 177,821 · -20.6%
- By 2100
- 145,134 · -35.2%
Race, ethnicity, and origin ACS 2023
- Neighborhood character
- Predominantly Black (80%)
- Race & ethnicity
- Black 80% White 12% Two or more races 4% Asian 3% Hispanic / Latino 2%
- Common ancestry
- Italian 1%
- Foreign-born
- 5% · Canada, South Korea
- Languages at home
- 94% English-only · Spanish 2% Other Indo-European 1% Korean 1%
Political lean MEDSL · Montgomery
- 2024 margin
- Solid D (+30.7) · D 64.8% · R 34.1% · Other 1.1%
- 2008→2024 swing
- +11.5pp toward D · 2008: 19.2pp · 2024: 30.7pp
- All cycles
- 2024: D+30.7 2020: D+31.5 2016: D+26.2 2012: D+24.3 2008: D+19.2
Not yet ingested
- Civics
- —
Market trends
- HPI YoY
- ▼ -16.31%
- Current HPI
- 151.8598
- Rent YoY
- ▲ 5.65%
- Metro
- Montgomery, AL
- State GDP YoY
- ▲ 2.94%
- F500 in state
- 4
Industry mix (Fortune 500 HQ in AL)
| Industry | F500 HQs | Revenue |
|---|---|---|
| Financial Services | 1 | $8B |
|
||
| Healthcare | 1 | $5B |
|
||
Price history
+101.6% since first listed10 events — show timeline
- 2026-06-04 Listed $114,900 Greater Alabama MLS
- 2022-09-29 Sold (Public Records) $104,000 Public Records
- 2022-09-26 Sold (MLS) $104,000 MAAR
- 2022-08-03 Listed $110,000 MAAR
- 2020-12-09 Sold (Public Records) $90,000 Public Records
- 2017-01-06 Sold (MLS) $76,500 MAAR
- 2017-01-05 Listed $76,500 MAAR
- 2016-06-07 Sold (Public Records) $470,000 Public Records
- 2015-12-30 Sold (Public Records) $38,000 Public Records
- 2015-01-27 Listed $57,000 MAAR
Property tax history
+8.7%/yrLatest (2025): $1,170 · +17.2% YoY. Source: county tax records.
Cash-flow waterfall
monthlySold comps — $/sqft
last 12 mo · ≤1 miLoading sold comps…