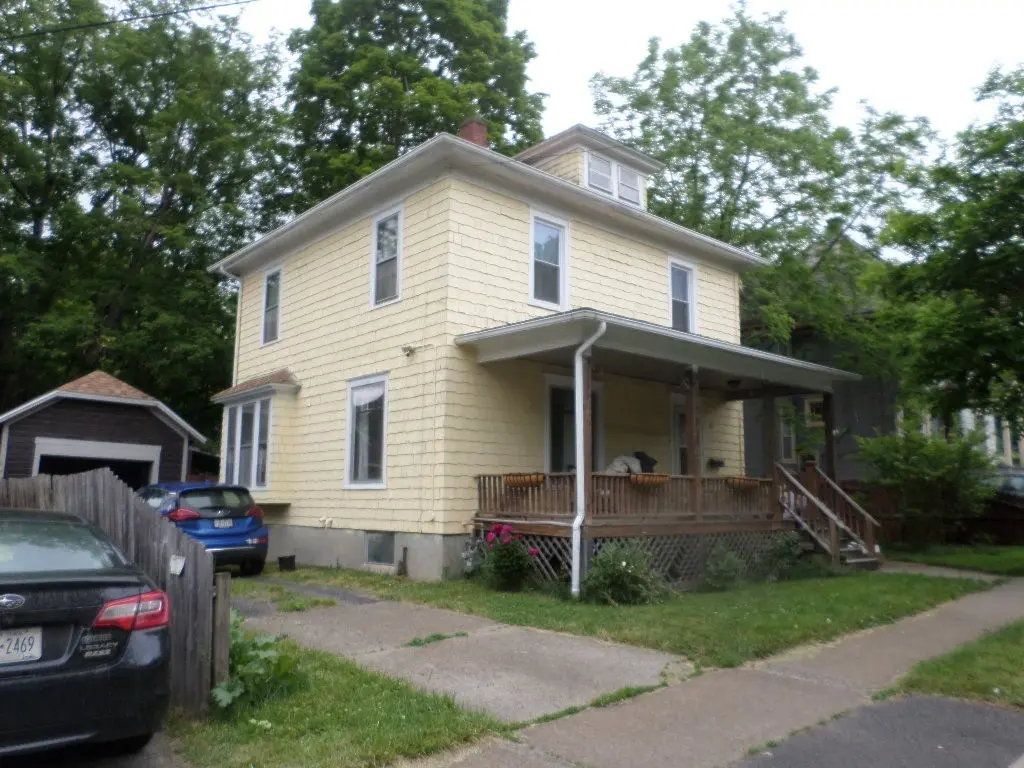
45 East St · Oneonta, NY
Flood risk 4/10 · Minor
- FEMA flood zone
- X (unshaded)
- Chance of flooding over 30 yrs
- 0.22%
- Est. flood insurance / yr
- $473 – $860
Fire risk 1/10 · Minimal
- Est. fire insurance / yr
- $691 – $1,283
Heat risk 2/10 · Minimal
- Hot days now (above 92°F)
- 8 days/yr
- Hot days in 30 yrs
- 18 days/yr
Wind risk 2/10 · Minimal
- Chance of severe wind over 30 yrs
- 1.0%
Air-quality risk 1/10 · Minimal
- Unhealthy air days now
- 0 days/yr
- Unhealthy air days in 30 yrs
- 0 days/yr
Risk factors via First Street. Map © Google.
Why this score? — see what drove the C+ grade
The composite is a weighted blend of 9 inputs, each scored 0–100. Each bar is that input's sub-score; the figure is the points it added to the 100-point composite (weight × sub-score).
- ARV discount +15.0/15.0
- Cash flow +13.2/30.0
- Appreciation +10.0/10.0
- 1% rule +5.6/10.0
- Schools +4.3/10.0
- DSCR +4.0/10.0
- Livability +3.8/5.0
- Rent growth +2.5/5.0
- Condition / age +2.5/5.0
$168,000
🖨 Deal sheet 📄 Offer letter ✓ Due diligence
Listing remarks MLS
Move in Ready! This 4 bedroom, 1 1/2 bath home features HARDWOOD FLOORS and NATURAL WOODWORK. The kitchen is spacious with direct access to back deck and side yard. Dining room is open to the living room with newly refinished hardwood flooring window seat and french doors. Bedrooms are nice sized with new carpet. and a walk up attic for storage. NEW ROOF, HOT WATER HEATER, FURNACE within the last 5 years. New Garage door, washing machine and range are all newer as well. There is a great front porch and back deck for relaxing or entertaining. Close to Wilber Park, bus stop and downtown. Come take a look, this one won't last long!
Key facts
- 1-car garage
- Rear deck
- 3,960 sq ft lot
Tags
Property features AI
Exterior
- Parking: Detached garage with electric and garage door opener; One garage space
- Utilities: Electricity connected; Public water connected; Sewer connected
- Home design: Two-story house; Existing construction; Shingle roof; Shake siding; Poured foundation
- Construction: Shake siding construction; Shingle roof; Poured foundation; Built — existing (year not specified)
- Exterior features: Deck; Covered porch; Porch; Partial fence; Gravel driveway; Rectangular residential lot; City street frontage
Interior
- Kitchen: Gas oven and gas range; Range hood; Refrigerator; Exhaust fan
- Bedrooms: Four bedrooms (all on the second floor)
- Flooring: Carpet; Vinyl; Varies
- Bathrooms: One full bathroom; One half bathroom; One main-level bathroom
- Heating & cooling: Gas forced-air heating
- Interior features: Separate/formal dining room; Entrance foyer; Full basement
- Laundry & utility: Washer and dryer; Laundry located in the basement; Electric water heater
Neighborhood map
What this means for you Summary
Snapshot
- This is a 4-bed/1.0-bath single-family listed at $168k.
Deal economics
- At list price, monthly cash flow is $-2 ($-23/yr) — negative.
- To cash-flow at today's rent, offer at most $168k (0.2% below list).
- Meets the 1% rule at list price ($2k rent vs $168k).
- Recommended offer: $168k (0.2% below list) — sets the bar for cash-flow.
Location & tenants
- Location reads 75/100 on livability (#253 in NY, #4,021 nationally) — a middle-class / working-renter tenant base. Strengths: housing A+, health & safety A+, cost of living B+; Watch: amenities C-, crime F, commute F.
- Oneonta City School District (town): math 46% / reading 57% proficiency, ranked #374 of 590 in NY (top 63%) — acceptable for families but not a draw, mixed tenant base, ~2y average lease.
- Market conditions: 118 active listings in the ZIP; 2 comparable units currently listed for rent nearby; 133 units permitted in Otsego County in 2024 (10 in 5+ unit buildings).
- This rent runs 32% of the median local income ($66k/yr) — at the standard rent-burdened threshold; future hikes will face affordability resistance.
Forward outlook
- In year one you build about $18k of equity ($1k loan paydown + $17k appreciation (10.0% local appreciation)).
- Otsego County population projected at -21% by 2050 — secular population decline; favor cash flow + early exit over multi-decade hold.
- At projected returns (10.0% appreciation + 3.0% rent growth), your $47k cash investment doubles in ~3 years — after that, you're playing with house money.
- By year 3, paydown + projected appreciation supports a ~$45k cash-out refi (75% LTV) — recoverable capital for the next deal without selling this one.
Negotiation context
- Only 6 days on market — expect competitive offers; lowballing is unlikely to land.
- 5 sale attempts since 20y ago with the ask held roughly flat each time — persistent listings suggest the price (not the market) is what's stuck; bring a comps-based counter.
- Current owner paid $139k; 21% above their basis — modest negotiation headroom, anchor on the comps not their cost.
Risks & watch-outs
- Watch-outs: property tax is 3.2% of price; built in 1910 — expect roof / HVAC / electrical / plumbing capex.
Questions for the listing agent
- What do current leases actually rent for vs. the listed asking? Can we see a recent rent roll and the last 12 months of T-12 income?
- Built in 1910 — when were the roof, HVAC, electrical panel, plumbing, and water heater last replaced?
- Property tax is high relative to price — has the assessment been appealed recently, and will the sale trigger a re-assessment?
- Is there a deadline driving the sale (1031 exchange, divorce, estate, relocation)? That informs how much negotiation room exists.
- Crime grade is F in this area — have there been break-ins, vandalism, or insurance claims at this property in the last 3 years? What carrier currently insures it and at what premium?
- What's the average days-on-market for RENTAL listings here right now (not sales)? A rising rental-DOM trend means longer vacancies and softer asking-rent achievability than the comps imply.
- What's the recent tenant-quality profile in this submarket — average credit score on applications, eviction rate, late-payment / NSF rate, and stable-employment percentage? A property-management company in the area should have these aggregated.
- How much new for-sale + rental construction is in the pipeline within 1–3 miles? Heavy new supply typically softens prices + rents 12–24 months out; constrained supply supports both.
Investment metrics
- 1% rule
- 1.06% ✓
- Cap rate
- 6.28%
- Cash-on-cash
- -0.05%
- DSCR
- 1.00
- GRM
- 7.9
CMA / ARV
- ARV (on-the-fly)
- $231,568
- Comps found
- 12
Show comp detail 12 sales within ~0.75 mi
| Address | Dist | Beds/Ba | Sqft | Sold | Price | $/sf | Match |
|---|---|---|---|---|---|---|---|
| 7 East St | 0.17mi | 4/2.5 | 1,470 (+4%) | 2mo | $215,000 | $146 | 77 |
| 48 Union St | 0.14mi | 3/1.5 (-1) | 1,496 (+6%) | 6mo | $325,000 | $217 | 72 |
| 2 Lincoln St | 0.27mi | 3/1.5 (-1) | 1,432 (+1%) | 10mo | $173,000 | $121 | 70 |
| 24 Spruce St | 0.47mi | 3/1.0 (-1) | 1,350 (-4%) | 5mo | $185,000 | $137 | 62 |
| 12 Woodside Ave | 0.39mi | 3/2.0 (-1) | 1,464 (+4%) | 8mo | $199,000 | $136 | 60 |
| 90 Clinton St | 0.50mi | 4/2.5 | 1,344 (-5%) | 6mo | $240,000 | $179 | 57 |
| 15 Church St | 0.65mi | 3/1.0 (-1) | 1,344 (-5%) | 4mo | $220,000 | $164 | 54 |
| 8 Birch St | 0.55mi | 4/1.5 | 1,305 (-8%) | 10mo | $230,000 | $176 | 52 |
| 13 S Belmont Cir | 0.61mi | 3/2.0 (-1) | 1,308 (-7%) | 1mo | $310,000 | $237 | 50 |
| 21 Cherry St | 0.62mi | 3/2.0 (-1) | 1,288 (-9%) | 3mo | $161,000 | $125 | 45 |
| 35 Church St | 0.57mi | 3/1.5 (-1) | 1,548 (+10%) | 9mo | $140,000 | $90 | 43 |
| 26 S Belmont Cir | 0.67mi | 3/1.5 (-1) | 1,220 (-14%) | 9mo | $210,000 | $172 | 32 |
Match score weights: distance 35% · size 25% · config 20% · recency 20%. Top-matched comps best support the ARV.
Projected returns pro-forma
10.0% appreciation · 3.0% rent growth · sell at horizon
- IRR
- 24.3%
- Equity multiple
- 2.95×
- Total profit
- $91,550
- Equity at exit
- $151,348
- IRR
- 21.5%
- Equity multiple
- 6.74×
- Total profit
- $270,047
- Equity at exit
- $326,387
Cash invested: $47,040 (down + closing). Projections, not guarantees.
Landlord ↔ Tenant lean methodology
- Overall (STATE)
- 15 Strongly Tenant-Friendly
- State New York
- 15 Strongly Tenant-Friendly · D+10
- County
- — inherits STATE
- City
- — inherits STATE
ZIP-level market 13820
- Home prices YoY
- 22.7%
- Active inventory
- 118
- Price-to-rent
- 7.9×
Monthly cashflow live
- Estimated rent
- $1,775 medium interval (Pro) →
- Mortgage (P&I)
- −$881
- Tax from tax record
- −$453 /mo · $5,441/yr
- Insurance
- −$70
- HOA
- −$0
- Vacancy / Maint / Mgmt
- −$373
- Net cashflow
- $-2
Break-even live
UW: 25.0% down · 7.5% · 30yr · 1.5% tax · 5.0% vac · 8.0% maint · 8.0% mgmt
Financing live
Cash to close
- Down payment
- $42,000
- Closing costs
- $5,040
- Reserves months
- —
- Total cash needed
- —
Loan-product check · same deal, 3 products live
Conventional
25% down · 7.5% · 30yr
- Down + closing
- —
- Monthly P&I
- —
- Monthly cashflow
- —
- DSCR
- —
- Eligible?
- —
Personal DTI + credit; lowest rate.
DSCR
20% down · 8.5% · 30yr
- Down + closing
- —
- Monthly P&I
- —
- Monthly cashflow
- —
- DSCR
- —
- Eligible?
- —
No personal income docs; deal must DSCR.
Hard money
10% down · 12.0% · 12mo
- Down + closing
- —
- Monthly P&I
- —
- Monthly cashflow
- —
- DSCR
- —
- Eligible?
- —
Short-term bridge; refi at stabilization.
Rent comps 2 comps
| Address | Beds | Baths | Sqft | Rent | $/sqft | DOM | Units | Dist |
|---|---|---|---|---|---|---|---|---|
| 7 Wells Ave Oneonta, NY | 3.0 | 1.0 | 1120 | $1,800 | $1.61 | 43d | 1 | 1.03mi |
| 15881 State Highway 8 Masonville, NY | 4.0 | 1.0 | 1500 | $1,250 | $0.83 | 43d | 1 | 1.20mi |
Listing history 7 events
-
2026-06-19days on market $168,000 Active 6 DOM
-
2026-06-18days on market $168,000 Active 5 DOM
-
2026-06-17days on market $168,000 Active 4 DOM
-
2026-06-16days on market $168,000 Active 3 DOM
-
2026-06-15days on market $168,000 Active 2 DOM
-
2026-06-14remarks 614-char remark
-
2026-06-14$168,000 Active 1 DOM
ⓘ Source: listings_history table (triggers on properties + properties_extension) + one-shot
backfill from property_details.listing_events for pre-trigger history.
Tax reassessment forecast NY · Partial reset (capped growth)
- Current annual tax
- $5,441 · $453/mo
- Projected year-2 tax
- $5,441 · $453/mo
- Expected delta
- $0/yr ($0/mo · 0.0%)
ⓘ Screening estimate from a state-policy table — verify with the county assessor before closing.
Climate risk First Street
- Flood 4/10 Moderate FEMA zone X (unshaded) · 22% chance over 30 yrs
- Wildfire 1/10 Low
- Heat 2/10 Low 8 d/yr ≥92°F today · 18 d/yr by 30 yrs out
- Wind 2/10 Low 100% chance of damaging wind over 30 yrs
- Air quality 1/10 Low 0 unhealthy d/yr today · 0 by 30 yrs out
Nearby sold comps map
Loading sold comps map…
Walkable amenities ~0.75 mi
Loading nearby amenities…
Taxation est. · year 1
- Rental income
- $21,304
- − Mortgage interest
- −$9,411
- − Property taxes
- −$5,441
- − Insurance
- −$840
- − Repairs & maintenance
- −$1,704
- − Management
- −$1,704
- − Depreciation
- −$4,887
- Taxable loss
- −$2,684
- Est. tax savings @ 24.0%
- +$644
- After-tax cash flow
- $621/yr
For passive investors: Depreciation is non-cash, so a rental often shows a tax loss while cash-flowing — sheltering income. Rental losses are passive: they offset passive income freely, and up to $25,000/yr can offset ordinary (W-2) income if you actively participate and your MAGI is under $100k (phasing out to $0 by $150k); unused losses carry forward. On sale, claimed depreciation is recaptured at up to 25%, and gains may owe capital-gains tax (a 1031 exchange can defer both). Figures are a year-1 estimate at your 24.0% rate — not tax advice; consult a CPA.
Schools (NCES district)
- District
- Oneonta City School District
- NCES district ID
- 3621780
- Math proficiency
- 46% ▼ -2.00%
- Reading proficiency
- 57% ▲ 14.00%
- Median HH income
- $41,631
- Composite
- 43.19/100
- National rank
- #3066
- State rank
- #374 of 590 in NY
Livability — Oneonta
- Score
- 75/100
- State rank
- #253
- US rank
- #4021
Category grades
Schools grade is shown separately in the Schools card above.
Census & demographics
- Census place
- Oneonta, NY
- County
- Otsego County · 23,056 people
- City population
- 23,056
- Metro
- Oneonta, NY
- Population (ZIP)
- 23,056
- Household income
- $65,953
- Rent vs Own
- Severe rent burden
- 662.0
Population outlook (Otsego County) Hauer SSP2
- Today (2025)
- 57,987 people
- By 2030
- 55,403 · -4.5%
- By 2040
- 50,336 · -13.2%
- By 2050
- 45,715 · -21.2%
- By 2075
- 38,769 · -33.1%
- By 2100
- 33,468 · -42.3%
Race, ethnicity, and origin ACS 2023
- Neighborhood character
- Predominantly White (84%)
- Race & ethnicity
- White 84% Hispanic / Latino 6% Black 5% Two or more races 5% Asian 2%
- Hispanic origin (detail)
- Puerto Rican 2%
- Common ancestry
- Romanian 4% Slovak 2% Lithuanian 2%
- Foreign-born
- 5% · Canada, China
- Languages at home
- 94% English-only · Spanish 3% Russian/Polish/Slavic 1% Other Indo-European 1%
Political lean MEDSL · Otsego
- 2024 margin
- Lean R (+7.9) · D 46.1% · R 53.9%
- 2008→2024 swing
- -13.8pp toward R · 2008: 5.9pp · 2024: -7.9pp
- All cycles
- 2024: R+7.9 2020: R+5.0 2016: R+13.0 2012: D+2.0 2008: D+5.9
Not yet ingested
- Civics
- —
Market trends
- HPI YoY
- ▲ 67.86%
- Current HPI
- 366.3391
- Rent YoY
- —
- Metro
- Oneonta, NY
- State GDP YoY
- ▲ 2.60%
- F500 in state
- 92
Industry mix (Fortune 500 HQ in NY)
| Industry | F500 HQs | Revenue |
|---|---|---|
| Financial Services | 10 | $950B |
|
||
| Consumer Goods | 9 | $162B |
|
||
| Insurance | 4 | $225B |
|
||
| Telecommunications | 2 | $144B |
|
||
| Pharmaceuticals | 2 | $112B |
|
||
| Media / Entertainment | 2 | $69B |
|
||
Price history
+236.0% since first listed13 events — show timeline
- 2026-06-13 Listed $168,000 UNYREIS
- 2020-11-17 Sold (Public Records) $139,000 Public Records
- 2020-11-04 Sold (MLS) $139,000 ODBOR
- 2020-11-04 Sold (MLS) $139,000 UNYREIS
- 2020-07-25 Listed $139,900 ODBOR
- 2020-07-25 Listed $139,900 UNYREIS
- 2015-02-10 Sold (Public Records) $115,000 Public Records
- 2015-02-06 Sold (MLS) $115,000 UNYREIS
- 2014-10-06 Listed $129,000 UNYREIS
- 2006-05-19 Sold (MLS) $122,000 UNYREIS
- 2006-05-15 Sold (Public Records) $122,000 Public Records
- 2006-01-10 Listed $139,000 UNYREIS
- 2001-04-16 Sold (Public Records) $50,000 Public Records
Property tax history
+7.2%/yrLatest (2025): $5,441 · +5.5% YoY. Source: county tax records.
Cash-flow waterfall
monthlySold comps — $/sqft
last 12 mo · ≤1 miLoading sold comps…