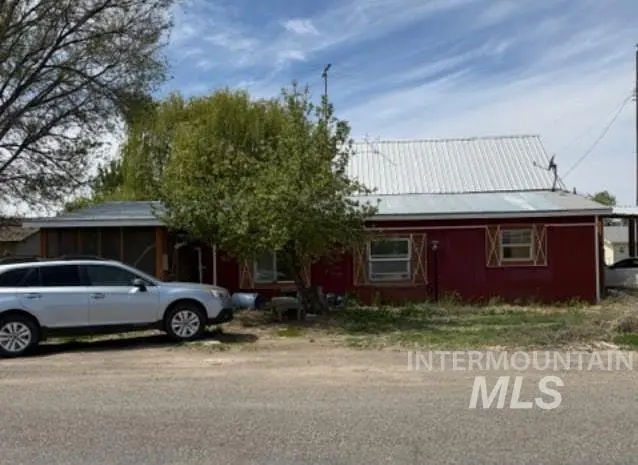
105 3rd St · Grand View, ID
Flood risk 10/10 · Severe
- FEMA flood zone
- X
- Chance of flooding over 30 yrs
- 0.99%
- Est. flood insurance / yr
- $507 – $1,088
Fire risk 4/10 · Minor
- Est. fire insurance / yr
- $584 – $1,086
Heat risk 5/10 · Moderate
- Hot days now (above 97°F)
- 7 days/yr
- Hot days in 30 yrs
- 19 days/yr
Wind risk 1/10 · Minimal
- Chance of severe wind over 30 yrs
- —
Air-quality risk 7/10 · Major
- Unhealthy air days now
- 12 days/yr
- Unhealthy air days in 30 yrs
- 13 days/yr
Risk factors via First Street. Map © Google.
Why this score? — see what drove the D grade
The composite is a weighted blend of 9 inputs, each scored 0–100. Each bar is that input's sub-score; the figure is the points it added to the 100-point composite (weight × sub-score).
- ARV discount +15.0/15.0
- Appreciation +8.0/10.0
- Cash flow +7.4/30.0
- Livability +2.9/5.0
- Schools +2.8/10.0
- Rent growth +2.5/5.0
- Condition / age +2.5/5.0
- DSCR +1.6/10.0
- 1% rule +0.8/10.0
$240,000
🖨 Deal sheet 📄 Offer letter ✓ Due diligence
Listing remarks
Great opportunity in the heart of Grand View with beautiful views of the Snake River! This property offers a solid setup for a starter home, rental or investment project with plenty of upside potential. Features a functional layout on a manageable lot, it provides comfortable small-town setting within walking distance to the city center. Enjoy country living while taking in scenic river views from your property. This home offers opportunity for personalization and improvement for buyers looking to add value over time. This property delivers on both potential and location.
Key facts
- Manageable lot
- Functional layout
- Scenic river views
Tags
Property features AI
Exterior
- Parking: Covered carport with space for one vehicle; Total of one covered parking space
- Home design: Single-family residence
- Construction: Frame construction; Originally built in 1920
- Exterior features: Paved road access; Approximately 10,000 sqft (.49 acre) lot
Interior
- Bedrooms: Three bedrooms, all on the main level
- Bathrooms: One bathroom
- Heating & cooling: No heating system reported; No cooling system reported
- Interior features: Main-level living areas
Neighborhood map
What this means for you Summary
Snapshot
- This is a 3-bed/1.0-bath single-family listed at $240k.
Deal economics
- At list price, monthly cash flow is $-375 ($-4k/yr) — negative.
- To cash-flow at today's rent, offer at most $174k (27.6% below list).
- To meet the 1% rule (rent ≥ 1% of price), the offer needs to be $140k (41.7% below list).
- Recommended offer: $140k (41.7% below list) — sets the bar for 1% rule.
Location & tenants
- Location reads 58/100 on livability (#197 in ID) — a working-class tenant base; expect higher turnover. Strengths: cost of living A+, housing A+; Watch: amenities F, commute F, employment F.
- Bruneau-Grand View Joint School District (rural): math 25% / reading 35% proficiency, ranked #123 of 133 in ID (top 92%) — families likely to look elsewhere, expect single-tenant / working-renter base with shorter leases.
- Zoned schools: Grand View Elementary School (math 54% / reading 44%, grade D, #148 of 357 statewide, top 47%, 102 students, 40% FRL); Rimrock Jr/Sr High School (math 27% / reading 47%, grade F, #100 of 169 statewide, top 61%, 161 students, 36% FRL) — zoned schools average 38% FRL vs 53% district-wide (15 pts lower); this property's tenant base skews higher-income than the district average.
- Zoned-school proficiency averages 43% at this address vs 30% district-wide (+13 pts) — the actual schools serving this property are materially stronger than the Bruneau-Grand View Joint School District average implies; a family-tenant draw the district grade alone would hide.
- Market conditions: 8 active listings in the ZIP; 1 comparable units currently listed for rent nearby; 40 units permitted in Owyhee County in 2024 (0 in 5+ unit buildings).
Forward outlook
- In year one you build about $16k of equity ($2k loan paydown + $14k appreciation (6.0% local appreciation)).
- Owyhee County population projected at -15% by 2050 — secular population decline; favor cash flow + early exit over multi-decade hold.
- By year 3, paydown + projected appreciation supports a ~$40k cash-out refi (75% LTV) — recoverable capital for the next deal without selling this one.
Negotiation context
- It's been on market 49 days — a 3% lower offer ($233k) is reasonable based on typical stale-listing flexibility.
Risks & watch-outs
- Watch-outs: flood insurance adds $66/mo; built in 1920 — expect roof / HVAC / electrical / plumbing capex.
- Climate carrying-cost: severe flood risk; extreme-heat days projected 7→19/yr by 2055 (HVAC capex compounding) — expect insurance premiums to compound above CPI over the hold.
Questions for the listing agent
- What do current leases actually rent for vs. the listed asking? Can we see a recent rent roll and the last 12 months of T-12 income?
- It's been on market 49 days. Have you received any prior offers? Is the seller open to a 42% concession, seller financing, or rate buy-down credit?
- Built in 1920 — when were the roof, HVAC, electrical panel, plumbing, and water heater last replaced?
- What's the actual annual flood-insurance premium (NFIP or private), and is the property in a SFHA with mandatory coverage?
- Is there a deadline driving the sale (1031 exchange, divorce, estate, relocation)? That informs how much negotiation room exists.
- Schools are F-rated, which usually means shorter tenancies and higher turnover. Who's the typical renter profile here, and what's been the actual vacancy rate?
- The area grade is low — what's the realistic commute time and amenity access for the typical tenant pool here? Any planned neighborhood developments (good or bad) we should know about?
- What's the average days-on-market for RENTAL listings here right now (not sales)? A rising rental-DOM trend means longer vacancies and softer asking-rent achievability than the comps imply.
- What's the recent tenant-quality profile in this submarket — average credit score on applications, eviction rate, late-payment / NSF rate, and stable-employment percentage? A property-management company in the area should have these aggregated.
- How much new for-sale + rental construction is in the pipeline within 1–3 miles? Heavy new supply typically softens prices + rents 12–24 months out; constrained supply supports both.
Investment metrics
- 1% rule
- 0.58% ✗
- Cap rate
- 4.75%
- Cash-on-cash
- -5.50%
- DSCR
- 0.76
- GRM
- 14.3
CMA / ARV
- ARV (on-the-fly)
- $310,536
- Comps found
- 5
Show comp detail 5 sales within ~0.75 mi
| Address | Dist | Beds/Ba | Sqft | Sold | Price | $/sf | Match |
|---|---|---|---|---|---|---|---|
| 500 Riverside Ave | 0.27mi | 3/2.0 | 1,316 (-4%) | 9mo | $315,000 | $239 | 69 |
| 150 3rd St | 0.05mi | 3/2.0 | 1,170 (-14%) | 1mo | $199,900 | $171 | 68 |
| 640 Roosevelt Ave | 0.32mi | 2/2.0 (-1) | 1,344 (-2%) | 10mo | $230,000 | $171 | 65 |
| 260 State St | 0.31mi | 2/2.0 (-1) | 1,168 (-15%) | 10mo | $265,000 | $227 | 44 |
| 225 Estate Dr | 0.54mi | 3/2.0 | 1,500 (+10%) | 21mo | $347,000 | $231 | 37 |
Match score weights: distance 35% · size 25% · config 20% · recency 20%. Top-matched comps best support the ARV.
Projected returns pro-forma
5.96% appreciation · 3.0% rent growth · sell at horizon
- IRR
- 9.8%
- Equity multiple
- 1.67×
- Total profit
- $44,758
- Equity at exit
- $150,244
- IRR
- 11.1%
- Equity multiple
- 3.24×
- Total profit
- $150,306
- Equity at exit
- $271,917
Cash invested: $67,200 (down + closing). Projections, not guarantees.
Landlord ↔ Tenant lean methodology
- Overall (STATE)
- 91 Strongly Landlord-Friendly
- State Idaho
- 91 Strongly Landlord-Friendly · R+18
- County
- — inherits STATE
- City
- — inherits STATE
ZIP-level market 83624
- Home prices YoY
- 1.9%
- Active inventory
- 8
- Price-to-rent
- 14.3×
Monthly cashflow live
- Estimated rent
- $1,400 medium interval (Pro) →
- Mortgage (P&I)
- −$1,259
- Tax from tax record
- −$56 /mo · $666/yr
- Insurance
- −$100
- Flood insurance flood zone
- −$66 /mo · $798/yr
- HOA
- −$0
- Vacancy / Maint / Mgmt
- −$294
- Net cashflow
- $-375
Break-even live
UW: 25.0% down · 7.5% · 30yr · 1.5% tax · 5.0% vac · 8.0% maint · 8.0% mgmt
Financing live
Cash to close
- Down payment
- $60,000
- Closing costs
- $7,200
- Reserves months
- —
- Total cash needed
- —
Loan-product check · same deal, 3 products live
Conventional
25% down · 7.5% · 30yr
- Down + closing
- —
- Monthly P&I
- —
- Monthly cashflow
- —
- DSCR
- —
- Eligible?
- —
Personal DTI + credit; lowest rate.
DSCR
20% down · 8.5% · 30yr
- Down + closing
- —
- Monthly P&I
- —
- Monthly cashflow
- —
- DSCR
- —
- Eligible?
- —
No personal income docs; deal must DSCR.
Hard money
10% down · 12.0% · 12mo
- Down + closing
- —
- Monthly P&I
- —
- Monthly cashflow
- —
- DSCR
- —
- Eligible?
- —
Short-term bridge; refi at stabilization.
Rent comps 1 comps
| Address | Beds | Baths | Sqft | Rent | $/sqft | DOM | Units | Dist |
|---|---|---|---|---|---|---|---|---|
| 330 Kathleen Dr Grand View, ID | 3.0 | 2.0 | 1000 | $1,400 | $1.40 | 23d | 1 | 0.45mi |
Listing history 18 events
-
2026-06-19days on market $240,000 Active 49 DOM
-
2026-06-18days on market $240,000 Active 48 DOM
-
2026-06-17days on market $240,000 Active 47 DOM
-
2026-06-16days on market $240,000 Active 46 DOM
-
2026-06-15days on market $240,000 Active 45 DOM
-
2026-06-14days on market $240,000 Active 43 DOM
-
2026-06-12days on market $240,000 Active 42 DOM
-
2026-06-09days on market $240,000 Active 39 DOM
-
2026-06-08days on market $240,000 Active 38 DOM
-
2026-06-07days on market $240,000 Active 37 DOM
-
2026-06-05days on market $240,000 Active 35 DOM
-
2026-06-04days on market $240,000 Active 33 DOM
-
2026-06-02days on market $240,000 Active 32 DOM
-
2026-06-01days on market $240,000 Active 31 DOM
-
2026-05-31days on market $240,000 Active 30 DOM
-
2026-05-31days on market $240,000 Active 29 DOM
-
2026-05-01$240,000 Active
-
1999-05-05soldstatus
ⓘ Source: listings_history table (triggers on properties + properties_extension) + one-shot
backfill from property_details.listing_events for pre-trigger history.
Tax reassessment forecast ID · Resets to sale price
- Current annual tax
- $666 · $56/mo
- Projected year-2 tax
- $1,656 · $138/mo
- Expected delta
- +$990/yr (+$82/mo · 148.6%)
ⓘ Screening estimate from a state-policy table — verify with the county assessor before closing.
Climate risk First Street
- Flood 10/10 Extreme FEMA zone X · 99% chance over 30 yrs
- Wildfire 4/10 Moderate
- Heat 5/10 Major 7 d/yr ≥97°F today · 19 d/yr by 30 yrs out
- Wind 1/10 Low
- Air quality 7/10 Severe 12 unhealthy d/yr today · 13 by 30 yrs out
Nearby sold comps map
Loading sold comps map…
Walkable amenities ~0.75 mi
Loading nearby amenities…
Taxation est. · year 1
- Rental income
- $16,800
- − Mortgage interest
- −$13,444
- − Property taxes
- −$666
- − Insurance
- −$1,997
- − Repairs & maintenance
- −$1,344
- − Management
- −$1,344
- − Depreciation
- −$6,982
- Taxable loss
- −$8,977
- Est. tax savings @ 24.0%
- +$2,154
- After-tax cash flow
- $-2,340/yr
For passive investors: Depreciation is non-cash, so a rental often shows a tax loss while cash-flowing — sheltering income. Rental losses are passive: they offset passive income freely, and up to $25,000/yr can offset ordinary (W-2) income if you actively participate and your MAGI is under $100k (phasing out to $0 by $150k); unused losses carry forward. On sale, claimed depreciation is recaptured at up to 25%, and gains may owe capital-gains tax (a 1031 exchange can defer both). Figures are a year-1 estimate at your 24.0% rate — not tax advice; consult a CPA.
Schools (NCES district)
- District
- Bruneau-Grand View Joint School District
- NCES district ID
- 1600450
- Math proficiency
- 25% ▲ 10.00%
- Reading proficiency
- 35% ▲ 15.00%
- Median HH income
- $38,452
- Composite
- 27.92/100
- National rank
- #12263
- State rank
- #123 of 133 in ID
Livability — Grand View
- Score
- 58/100
- State rank
- #197
- US rank
- #21064
Category grades
Schools grade is shown separately in the Schools card above.
Census & demographics
- Census place
- Grand View, ID
- Population (ZIP)
- 1,437
Population outlook (Owyhee County) Hauer SSP2
- Today (2025)
- 11,097 people
- By 2030
- 10,842 · -2.3%
- By 2040
- 10,221 · -7.9%
- By 2050
- 9,407 · -15.2%
- By 2075
- 7,339 · -33.9%
- By 2100
- 5,495 · -50.5%
Race, ethnicity, and origin ACS 2023
- Neighborhood character
- Majority White (63%)
- Race & ethnicity
- White 63% Hispanic / Latino 27% Two or more races 23% Black 4% Native American 1%
- Hispanic origin (detail)
- Mexican 23%
- Common ancestry
- Portuguese 10% Italian 8% Dutch 3%
- Foreign-born
- 10% · Canada
- Languages at home
- 82% English-only · Spanish 17% Vietnamese 1%
Political lean MEDSL · Owyhee
- 2024 margin
- Solid R (+67.6) · D 15.3% · R 82.8% · Other 1.9%
- 2008→2024 swing
- -16.3pp toward R · 2008: -51.3pp · 2024: -67.6pp
- All cycles
- 2024: R+67.6 2020: R+63.3 2016: R+62.8 2012: R+52.7 2008: R+51.3
Not yet ingested
- Civics
- —
Market trends
- HPI YoY
- ▲ 5.96%
- Current HPI
- 328.6323
- Rent YoY
- —
- Metro
- —
- State GDP YoY
- ▲ 4.51%
- F500 in state
- 6
Industry mix (Fortune 500 HQ in ID)
| Industry | F500 HQs | Revenue |
|---|---|---|
| Retail | 1 | $79B |
|
||
| Technology | 1 | $25B |
|
||
| Food / Agriculture | 1 | $6B |
|
||
Price history
2 events — show timeline
- 2026-05-01 Listed $240,000 IMLS
- 1999-05-05 Sold (Public Records) — Public Records
Property tax history
+3.6%/yrLatest (2025): $666 · -13.7% YoY. Source: county tax records.
Cash-flow waterfall
monthlySold comps — $/sqft
last 12 mo · ≤1 miLoading sold comps…