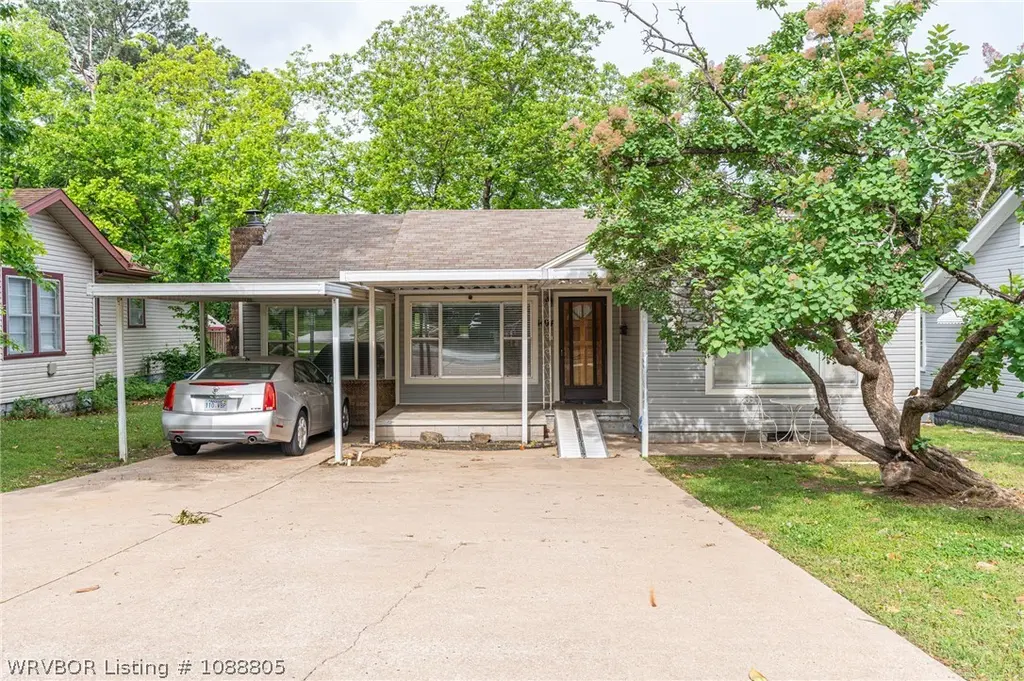
1404 S 17th St · Fort Smith, AR
Flood risk 1/10 · Minimal
- FEMA flood zone
- X (unshaded)
- Chance of flooding over 30 yrs
- 0.0%
- Est. flood insurance / yr
- $507 – $1,088
Fire risk 2/10 · Minimal
- Est. fire insurance / yr
- $1,499 – $2,785
Heat risk 7/10 · Major
- Hot days now (above 111°F)
- 7 days/yr
- Hot days in 30 yrs
- 20 days/yr
Wind risk 2/10 · Minimal
- Chance of severe wind over 30 yrs
- 3.0%
Air-quality risk 2/10 · Minimal
- Unhealthy air days now
- 0 days/yr
- Unhealthy air days in 30 yrs
- 1 days/yr
Risk factors via First Street. Map © Google.
Why this score? — see what drove the C grade
The composite is a weighted blend of 9 inputs, each scored 0–100. Each bar is that input's sub-score; the figure is the points it added to the 100-point composite (weight × sub-score).
- Cash flow +18.8/30.0
- ARV discount +15.0/15.0
- DSCR +5.9/10.0
- 1% rule +3.8/10.0
- Rent growth +3.6/5.0
- Livability +3.2/5.0
- Schools +3.1/10.0
- Condition / age +2.5/5.0
- Appreciation +0.0/10.0
$145,000
🖨 Deal sheet (PDF) 📄 Offer letter ✓ Due diligence
Listing remarks
Nestled on nearly a quarter of an acre, this home offers the perfect canvas for a homeowner with a vision. This charming 3-bedroom, 2-bathroom residence features both a formal living room—complete with a cozy fireplace for chilly evenings—and a spacious family room designed for easy gathering. The heart of the home is a functional galley kitchen that flows effortlessly into the rest of the living space. For those who love the outdoors, the property boasts a large sunroom and a covered front porch perfect for enjoying your morning coffee in peace. There is a large storage shed for all your tools and hobbies. Whether you're looking for room to grow or a creative project to call yo
Key facts
- Covered front porch
- Large sunroom
- Cozy fireplace
Tags
Property features AI
Exterior
- Parking: Covered parking (1 space); Carport; Concrete parking surface
- Utilities: Public water; Public sewer; Electricity available; Water available; Sewer available
- Home design: Single-family house; One level / one story
- Construction: Vinyl siding; Shingle roof; Slab foundation; Built as a house (single family residence)
- Exterior features: Covered patio/porch; Back yard fencing; Storage structure
Interior
- Kitchen: Dishwasher; Electric water heater
- Flooring: Carpet; Laminate; Simulated wood
- Bathrooms: 2 full bathrooms
- Heating & cooling: Central heating (natural gas); Central air; Ceiling fan(s)
- Interior features: Ceiling fan(s); Blinds; Fireplace in the living room
- Laundry & utility: Washer hookup; Electric dryer hookup
Neighborhood map
What this means for you Summary
Snapshot
- This is a 3-bed/2.0-bath single-family listed at $145k.
Deal economics
- At list price, monthly cash flow is $147 ($2k/yr) — positive.
- The deal already cash-flows at list — no discount required.
- To meet the 1% rule (rent ≥ 1% of price), the offer needs to be $128k (11.5% below list).
- Recommended offer: $128k (11.5% below list) — sets the bar for 1% rule.
- Cap rate 7.5% vs local median 4.3% in Fort Smith — top-decile yield for the area; either an underpriced asset or a hidden risk that comps aren't pricing in. Stress-test before assuming the spread holds.
Location & tenants
- Location reads 65/100 on livability (#151 in AR) — a middle-class / working-renter tenant base. Strengths: cost of living A+, housing A+, health & safety A+; Watch: crime F, amenities F, commute F.
- Fort Smith School District (urban): math 35% / reading 39% proficiency, ranked #106 of 238 in AR (top 44%) — families likely to look elsewhere, expect single-tenant / working-renter base with shorter leases; 64% free/reduced lunch — lower-income household profile, screen leases tightly.
- Zoned schools: Fairview Elementary School (math 50% / reading 38%, grade F, #164 of 454 statewide, top 37%, 458 students, 77% FRL); William O. Darby Jr. High Sch. (math 20% / reading 30%, grade F, #164 of 201 statewide, top 82%, 700 students, 87% FRL); Northside High School (math 12% / reading 27%, grade F, #239 of 292 statewide, top 85%, 2,433 students, 74% FRL) — zoned schools average 79% FRL vs 64% district-wide (15 pts higher); higher-poverty schools than district average — tighter screening recommended.
- Market conditions: Rents rising fast (+4.4%/yr); 176 active listings in the ZIP; 5 comparable units currently listed for rent nearby; rentals at typical pace (median 15d on market — plan ~3-4 weeks tenant-placement turnaround); lower-income renter base — watch delinquency; 388 units permitted in Sebastian County in 2024 (16 in 5+ unit buildings).
- This rent runs 36% of the median local income ($43k/yr) — at the standard rent-burdened threshold; future hikes will face affordability resistance.
Forward outlook
- Local home prices are declining (-3.0%/yr); year-one equity from $1k of loan paydown is wiped out by about $4k of value loss. Plan a longer hold.
- Sebastian County population projected at +7% by 2050 — modest demand growth; plan on rents tracking national, not racing it.
Negotiation context
- It's been on market 49 days — a 3% lower offer ($141k) is reasonable based on typical stale-listing flexibility.
- Current owner paid $65k; list at $145k implies a 123% gain — meaningful room to come down on a strong offer.
Risks & watch-outs
- Climate carrying-cost: extreme-heat days projected 7→20/yr by 2055 (HVAC capex compounding) — expect insurance premiums to compound above CPI over the hold.
Questions for the listing agent
- It's been on market 49 days. Have you received any prior offers? Is the seller open to a 12% concession, seller financing, or rate buy-down credit?
- Is there a deadline driving the sale (1031 exchange, divorce, estate, relocation)? That informs how much negotiation room exists.
- Schools are D-rated, which usually means shorter tenancies and higher turnover. Who's the typical renter profile here, and what's been the actual vacancy rate?
- Crime grade is F in this area — have there been break-ins, vandalism, or insurance claims at this property in the last 3 years? What carrier currently insures it and at what premium?
- What's the average days-on-market for RENTAL listings here right now (not sales)? A rising rental-DOM trend means longer vacancies and softer asking-rent achievability than the comps imply.
- What's the recent tenant-quality profile in this submarket — average credit score on applications, eviction rate, late-payment / NSF rate, and stable-employment percentage? A property-management company in the area should have these aggregated.
- How much new for-sale + rental construction is in the pipeline within 1–3 miles? Heavy new supply typically softens prices + rents 12–24 months out; constrained supply supports both.
Investment metrics
- 1% rule
- 0.88% ✗
- Cap rate
- 7.51%
- Cash-on-cash
- 4.35%
- DSCR
- 1.19
- GRM
- 9.4
CMA / ARV
- ARV (on-the-fly)
- $201,777
- Comps found
- 12
Show comp detail 12 sales within ~0.75 mi
| Address | Dist | Beds/Ba | Sqft | Sold | Price | $/sf | Match |
|---|---|---|---|---|---|---|---|
| 1907 S R St | 0.30mi | 3/1.0 | 1,991 (+2%) | 6mo | $136,000 | $68 | 74 |
| 922 S 17th St | 0.32mi | 3/2.0 | 1,859 (-5%) | 3mo | $30,000 | $16 | 74 |
| 722 S 23rd St | 0.60mi | 3/2.0 | 1,966 (+0%) | 0mo | $224,000 | $114 | 71 |
| 2206 S T St | 0.57mi | 3/2.0 | 1,928 (-2%) | 2mo | $290,000 | $150 | 69 |
| 2227 S Q St | 0.45mi | 3/2.0 | 2,000 (+2%) | 8mo | $190,000 | $95 | 69 |
| 1501 S 12th St | 0.23mi | 4/3.0 (+1) | 2,088 (+7%) | 1mo | $196,000 | $94 | 69 |
| 712 S 17th St | 0.47mi | 3/3.0 | 1,852 (-6%) | 5mo | $190,000 | $103 | 61 |
| 2222 S Q St | 0.46mi | 4/2.0 (+1) | 1,829 (-7%) | 4mo | $230,000 | $126 | 60 |
| 622 S 18th St | 0.52mi | 4/2.0 (+1) | 1,794 (-8%) | 2mo | $162,000 | $90 | 55 |
| 2104 S S St | 0.46mi | 3/2.0 | 1,694 (-14%) | 2mo | $210,000 | $124 | 54 |
| 2018 S U St | 0.55mi | 4/3.0 (+1) | 1,848 (-6%) | 5mo | $184,200 | $100 | 52 |
| 522 S 18th St | 0.59mi | 4/2.0 (+1) | 1,752 (-11%) | 1mo | $185,000 | $106 | 49 |
Match score weights: distance 35% · size 25% · config 20% · recency 20%. Top-matched comps best support the ARV.
Projected returns pro-forma
-3.0% appreciation · 4.37% rent growth · sell at horizon
- IRR
- -8.2%
- Equity multiple
- 0.69×
- Total profit
- $-12,388
- Equity at exit
- $21,620
- IRR
- 2.8%
- Equity multiple
- 1.21×
- Total profit
- $8,596
- Equity at exit
- $12,537
Cash invested: $40,600 (down + closing). Projections, not guarantees.
Landlord ↔ Tenant lean methodology
- Overall (STATE)
- 92 Strongly Landlord-Friendly
- State Arkansas
- 92 Strongly Landlord-Friendly · R+14
- County
- — inherits STATE
- City
- — inherits STATE
ZIP-level market 72901
- Rents YoY
- 4.4%
- Active inventory
- 176
- Price-to-rent
- 9.4×
Monthly cashflow live
- Estimated rent
- $1,283 high interval (Pro) →
- Mortgage (P&I)
- −$760
- Tax from tax record
- −$46 /mo · $547/yr
- Insurance
- −$60
- HOA
- −$0
- Vacancy / Maint / Mgmt
- −$269
- Net cashflow
- $147
Break-even live
Sensitivity live
| Price | -10% $229 | -5% $188 | +0% $147 | +5% $106 | +10% $65 |
|---|---|---|---|---|---|
| Rent | -10% $46 | -5% $97 | +0% $147 | +5% $198 | +10% $249 |
| Rate | -1.0pp $220 | -0.5pp $184 | base $147 | +0.5pp $110 | +1.0pp $71 |
UW: 25.0% down · 7.5% · 30yr · 1.5% tax · 5.0% vac · 8.0% maint · 8.0% mgmt
Financing live
Cash to close
- Down payment
- $36,250
- Closing costs
- $4,350
- Reserves months
- —
- Total cash needed
- —
Loan-product check · same deal, 3 products live
Conventional
25% down · 7.5% · 30yr
- Down + closing
- —
- Monthly P&I
- —
- Monthly cashflow
- —
- DSCR
- —
- Eligible?
- —
Personal DTI + credit; lowest rate.
DSCR
20% down · 8.5% · 30yr
- Down + closing
- —
- Monthly P&I
- —
- Monthly cashflow
- —
- DSCR
- —
- Eligible?
- —
No personal income docs; deal must DSCR.
Hard money
10% down · 12.0% · 12mo
- Down + closing
- —
- Monthly P&I
- —
- Monthly cashflow
- —
- DSCR
- —
- Eligible?
- —
Short-term bridge; refi at stabilization.
Rent comps 5 comps
| Address | Beds | Baths | Sqft | Rent | $/sqft | DOM | Units | Dist |
|---|---|---|---|---|---|---|---|---|
| 800 S 19th St Fort Smith, AR | 2.0 | 1.0 | 1286 | $1,095 | $0.85 | 5d | 1 | 0.45mi |
| 2307 S 23rd St Fort Smith, AR | 3.0 | 2.5 | 1356 | $1,595 | $1.18 | 22d | 1 | 0.75mi |
| 704 S 26th St Fort Smith, AR | 2.0 | 2.0 | 1892 | $1,700 | $0.90 | 22d | 1 | 0.75mi |
| 2800 Wharton Cir Unit 2323 Fort Smith, AR | 2.0 | 2.0 | 1240 | $925 | $0.75 | 15d | 1 | 1.04mi |
| 3101 Park Ave Fort Smith, AR | 3.0 | 2.0 | 1634 | $1,650 | $1.01 | 15d | 1 | 1.15mi |
Listing history 21 events
-
2026-06-21days on market $145,000 Active 49 DOM
-
2026-06-19days on market $145,000 Active 47 DOM
-
2026-06-18days on market $145,000 Active 46 DOM
-
2026-06-17days on market $145,000 Active 45 DOM
-
2026-06-16days on market $145,000 Active 44 DOM
-
2026-06-15days on market $145,000 Active 43 DOM
-
2026-06-14days on market $145,000 Active 41 DOM
-
2026-06-13days on market $145,000 Active 40 DOM
-
2026-06-10days on market $145,000 Active 38 DOM
-
2026-06-09days on market $145,000 Active 37 DOM
-
2026-06-08days on market $145,000 Active 36 DOM
-
2026-06-07days on market $145,000 Active 35 DOM
-
2026-06-03days on market $145,000 Active 31 DOM
-
2026-06-02days on market $145,000 Active 30 DOM
-
2026-06-01days on market $145,000 Active 29 DOM
-
2026-05-31days on market $145,000 Active 28 DOM
-
2026-05-30days on market $145,000 Active 27 DOM
-
2026-05-16price $145,000
-
2026-04-28$160,000 Active
-
2001-04-09soldstatus $65,000
-
1983-08-18soldstatus $12,000
ⓘ Source: listings_history table (triggers on properties + properties_extension) + one-shot
backfill from property_details.listing_events for pre-trigger history.
Tax reassessment forecast AR · Resets to sale price
- Current annual tax
- $547 · $46/mo
- Projected year-2 tax
- $928 · $77/mo
- Expected delta
- +$381/yr (+$32/mo · 69.8%)
ⓘ Screening estimate from a state-policy table — verify with the county assessor before closing.
Climate risk First Street
- Flood 1/10 Low FEMA zone X (unshaded) · 0% chance over 30 yrs
- Wildfire 2/10 Low
- Heat 7/10 Severe 7 d/yr ≥111°F today · 20 d/yr by 30 yrs out
- Wind 2/10 Low 3% chance of damaging wind over 30 yrs
- Air quality 2/10 Low 0 unhealthy d/yr today · 1 by 30 yrs out
Nearby sold comps map
Loading sold comps map…
Walkable amenities ~0.75 mi
Loading nearby amenities…
Taxation est. · year 1
- Rental income
- $15,397
- − Mortgage interest
- −$8,122
- − Property taxes
- −$547
- − Insurance
- −$725
- − Repairs & maintenance
- −$1,232
- − Management
- −$1,232
- − Depreciation
- −$4,218
- Taxable loss
- −$679
- Est. tax savings @ 24.0%
- +$163
- After-tax cash flow
- $1,930/yr
For passive investors: Depreciation is non-cash, so a rental often shows a tax loss while cash-flowing — sheltering income. Rental losses are passive: they offset passive income freely, and up to $25,000/yr can offset ordinary (W-2) income if you actively participate and your MAGI is under $100k (phasing out to $0 by $150k); unused losses carry forward. On sale, claimed depreciation is recaptured at up to 25%, and gains may owe capital-gains tax (a 1031 exchange can defer both). Figures are a year-1 estimate at your 24.0% rate — not tax advice; consult a CPA.
Schools (NCES district)
- District
- Fort Smith School District
- NCES district ID
- 0506330
- Math proficiency
- 35% ▼ -11.00%
- Reading proficiency
- 39% ▼ -7.00%
- Median HH income
- $36,066
- Composite
- 30.66/100
- National rank
- #6183
- State rank
- #106 of 238 in AR
Livability — Fort Smith
- Score
- 65/100
- State rank
- #151
- US rank
- #13185
Category grades
Schools grade is shown separately in the Schools card above.
Census & demographics
- Census place
- Fort Smith, AR
- County
- Sebastian County · 99,312 people
- City population
- 94,356
- Metro
- Fort Smith, AR-OK
- Population (ZIP)
- 19,819
- Household income
- $42,851
- Rent vs Own
- Severe rent burden
- 1117.0
Population outlook (Sebastian County) Hauer SSP2
- Today (2025)
- 133,992 people
- By 2030
- 136,620 · +2.0%
- By 2040
- 140,832 · +5.1%
- By 2050
- 143,301 · +6.9%
- By 2075
- 147,964 · +10.4%
- By 2100
- 145,848 · +8.8%
Race, ethnicity, and origin ACS 2023
- Neighborhood character
- Diverse neighborhood (Simpson 0.60)
- Race & ethnicity
- White 60% Hispanic / Latino 17% Two or more races 12% Black 10% Asian 2%
- Hispanic origin (detail)
- Mexican 11% Puerto Rican 1%
- Common ancestry
- Slovak 2% Lithuanian 2% Italian 1%
- Foreign-born
- 9% · Canada, Vietnam, Guatemala
- Languages at home
- 83% English-only · Spanish 14% Other Asian/Pacific 1% Vietnamese 1%
Political lean MEDSL · Sebastian
- 2024 margin
- Solid R (+37.5) · D 30.0% · R 67.6% · Other 2.4%
- 2008→2024 swing
- -2.9pp toward R · 2008: -34.6pp · 2024: -37.5pp
- All cycles
- 2024: R+37.5 2020: R+35.5 2016: R+38.1 2012: R+37.1 2008: R+34.6
Not yet ingested
- Civics
- —
Market trends
- HPI YoY
- ▼ -173.82%
- Current HPI
- 172.3777
- Rent YoY
- ▲ 4.37%
- Metro
- Fort Smith, AR-OK
- State GDP YoY
- ▲ 3.80%
- F500 in state
- 10
Industry mix (Fortune 500 HQ in AR)
| Industry | F500 HQs | Revenue |
|---|---|---|
| Retail | 1 | $681B |
|
||
| Food / Agriculture | 1 | $53B |
|
||
| Retail / Energy | 1 | $22B |
|
||
| Transportation / Logistics | 1 | $12B |
|
||
| Energy | 1 | $4B |
|
||
Price history
+1108.3% since first listed4 events — show timeline
- 2026-05-16 Price Changed $145,000 WRVBOR
- 2026-04-28 Listed $160,000 WRVBOR
- 2001-04-09 Sold (Public Records) $65,000 Public Records
- 1983-08-18 Sold (Public Records) $12,000 Public Records
Property tax history
-3.5%/yrLatest (2025): $547 · -16.9% YoY. Source: county tax records.
Cash-flow waterfall
monthlySold comps — $/sqft
last 12 mo · ≤1 miLoading sold comps…