7104 72nd Ln N · Brooklyn Park, MN
Flood risk 1/10 · Minimal
- FEMA flood zone
- X (unshaded)
- Chance of flooding over 30 yrs
- 0.0%
- Est. flood insurance / yr
- $473 – $860
Fire risk 1/10 · Minimal
- Est. fire insurance / yr
- $888 – $1,650
Heat risk 2/10 · Minimal
- Hot days now (above 99°F)
- 7 days/yr
- Hot days in 30 yrs
- 14 days/yr
Wind risk 2/10 · Minimal
- Chance of severe wind over 30 yrs
- —
Air-quality risk 2/10 · Minimal
- Unhealthy air days now
- 1 days/yr
- Unhealthy air days in 30 yrs
- 2 days/yr
Risk factors via First Street. Map © Google.
Why this score? — see what drove the B grade
The composite is a weighted blend of 9 inputs, each scored 0–100. Each bar is that input's sub-score; the figure is the points it added to the 100-point composite (weight × sub-score).
- Cash flow +28.1/30.0
- 1% rule +10.0/10.0
- DSCR +10.0/10.0
- ARV discount +10.0/15.0
- Schools +4.2/10.0
- Livability +4.0/5.0
- Rent growth +3.1/5.0
- Condition / age +2.5/5.0
- Appreciation +0.0/10.0
$65,000
🖨 Deal sheet 📄 Offer letter ✓ Due diligence
Listing remarks MLS
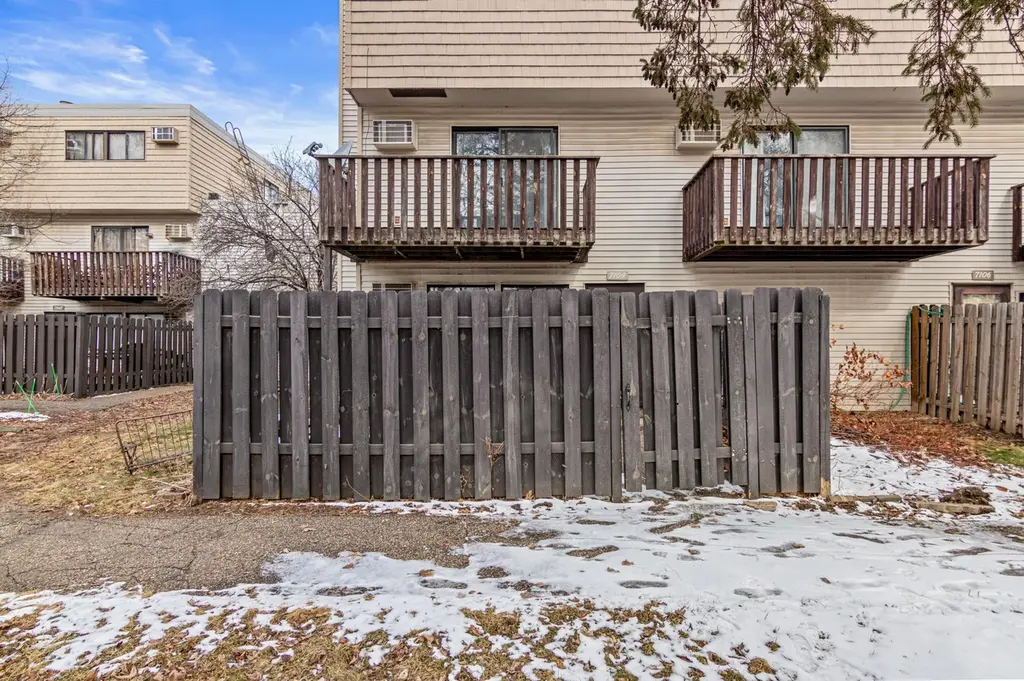
Low-Maintenance Living with Investor Potential! This well-maintained 1 bed, 1 bath corner-unit condo offers comfort, convenience, and versatility—perfect for both homeowners and savvy investors. Freshly painted with a new washer and dryer, the unit is move-in ready and designed for easy living. Enjoy the privacy of a rare fenced-in patio, ideal for relaxing, entertaining, or giving pets their own outdoor space. The corner-unit location provides added privacy and natural light, while the private garage stall offers secure parking and extra storage. Conveniently located just a short drive from major freeways, commuting and accessing nearby shopping, dining, and amenities is quick and easy. Whether you're looking for an affordable place to call home or a strong cash-flowing rental opportunity, this condo checks all the boxes.
Key facts
- $319 HOA
- Garage
- Built 1978
Neighborhood map
What this means for you Summary
Snapshot
- This is a 1-bed/1.0-bath condo listed at $65k.
Deal economics
- At list price, monthly cash flow is $204 ($2k/yr) — positive.
- The deal already cash-flows at list — no discount required.
- Meets the 1% rule at list price ($1k rent vs $65k).
- Recommended offer: $59k (9.0% below list) — sets the bar for market timing.
- Cap rate 10.1% vs local median 3.3% in Brooklyn Park — top-decile yield for the area; either an underpriced asset or a hidden risk that comps aren't pricing in. Stress-test before assuming the spread holds.
Location & tenants
- Location reads 81/100 on livability (#50 in MN, #1,308 nationally) — a professional / high-income tenant draw. Strengths: commute A+, employment A+, housing A+; Watch: crime C-, schools D, amenities F.
- Osseo Public School District (suburban): math 42% / reading 51% proficiency, ranked #129 of 301 in MN (top 43%) — families likely to look elsewhere, expect single-tenant / working-renter base with shorter leases.
- Market conditions: Rents rising (+2.5%/yr); 109 active listings in the ZIP; 13 comparable units currently listed for rent nearby; rentals leasing fast (median 5d on market — plan ~1-2 weeks tenant-placement turnaround); 4,651 units permitted in Hennepin County in 2024 (2,443 in 5+ unit buildings).
Forward outlook
- Local home prices are declining (-3.0%/yr); year-one equity from $449 of loan paydown is wiped out by about $2k of value loss. Plan a longer hold.
- Hennepin County population projected at +30% by 2050 — long-run rental-demand tailwind backs the buy-and-hold thesis.
- At projected returns (-3.0% appreciation + 2.5% rent growth), your $18k cash investment doubles in ~9 years — after that, you're playing with house money.
Negotiation context
- It's been on market 92 days — a 9% lower offer ($59k) is reasonable based on typical stale-listing flexibility.
- 6 sale attempts since 33y ago with the ask held roughly flat each time — persistent listings suggest the price (not the market) is what's stuck; bring a comps-based counter.
Risks & watch-outs
- Watch-outs: HOA is 26% of rent.
Questions for the listing agent
- It's been on market 92 days. Have you received any prior offers? Is the seller open to a 9% concession, seller financing, or rate buy-down credit?
- Built in 1978 — when were the roof, HVAC, electrical panel, plumbing, and water heater last replaced?
- What does the HOA fee cover, when was the last increase, and are there any pending special assessments or reserve-fund shortfalls?
- Any open or pending special assessments — roof, HVAC, plumbing, elevator, façade? What's the per-unit balance and payoff schedule, and is the seller paying it off at close or rolling it to the buyer?
- Why hasn't it sold? Are there any deal-killer items the seller is aware of (foundation, flood, title, zoning, code violations)?
- Is there a deadline driving the sale (1031 exchange, divorce, estate, relocation)? That informs how much negotiation room exists.
- Schools are D-rated, which usually means shorter tenancies and higher turnover. Who's the typical renter profile here, and what's been the actual vacancy rate?
- What's the average days-on-market for RENTAL listings here right now (not sales)? A rising rental-DOM trend means longer vacancies and softer asking-rent achievability than the comps imply.
- What's the recent tenant-quality profile in this submarket — average credit score on applications, eviction rate, late-payment / NSF rate, and stable-employment percentage? A property-management company in the area should have these aggregated.
- How much new apartment / multifamily construction is in the pipeline within 1–3 miles? Heavy new supply (>2% of stock underway) typically softens rents 12–24 months out; light construction supports rent growth.
Investment metrics
- 1% rule
- 1.88% ✓
- Cap rate
- 10.05%
- Cash-on-cash
- 13.43%
- DSCR
- 1.60
- GRM
- 4.4
CMA / ARV
- ARV (median comp)
- $68,827
- List price
- $65,000
- Delta
- -5.56%
- Verdict
- FAIR
- Comps
- 2 within 1.0 mi
Projected returns pro-forma
-3.0% appreciation · 2.52% rent growth · sell at horizon
- IRR
- 3.0%
- Equity multiple
- 1.11×
- Total profit
- $2,063
- Equity at exit
- $9,692
- IRR
- 12.1%
- Equity multiple
- 1.93×
- Total profit
- $16,970
- Equity at exit
- $5,620
Cash invested: $18,200 (down + closing). Projections, not guarantees.
Landlord ↔ Tenant lean methodology
- Overall (STATE)
- 46 Balanced
- State Minnesota
- 46 Balanced · D+2
- County
- — inherits STATE
- City
- — inherits STATE
ZIP-level market 55428
- Rents YoY
- 2.5%
- Active inventory
- 109
- Price-to-rent
- 4.4×
Monthly cashflow live
- Estimated rent
- $1,224 high interval (Pro) →
- Mortgage (P&I)
- −$341
- Tax from tax record
- −$76 /mo · $912/yr
- Insurance
- −$27
- HOA
- −$319
- Vacancy / Maint / Mgmt
- −$257
- Net cashflow
- $204
Break-even live
UW: 25.0% down · 7.5% · 30yr · 1.5% tax · 5.0% vac · 8.0% maint · 8.0% mgmt
Financing live
Cash to close
- Down payment
- $16,250
- Closing costs
- $1,950
- Reserves months
- —
- Total cash needed
- —
Loan-product check · same deal, 3 products live
Conventional
25% down · 7.5% · 30yr
- Down + closing
- —
- Monthly P&I
- —
- Monthly cashflow
- —
- DSCR
- —
- Eligible?
- —
Personal DTI + credit; lowest rate.
DSCR
20% down · 8.5% · 30yr
- Down + closing
- —
- Monthly P&I
- —
- Monthly cashflow
- —
- DSCR
- —
- Eligible?
- —
No personal income docs; deal must DSCR.
Hard money
10% down · 12.0% · 12mo
- Down + closing
- —
- Monthly P&I
- —
- Monthly cashflow
- —
- DSCR
- —
- Eligible?
- —
Short-term bridge; refi at stabilization.
Rent comps 13 comps
| Address | Beds | Baths | Sqft | Rent | $/sqft | DOM | Units | Dist |
|---|---|---|---|---|---|---|---|---|
| 7282 72nd Ln N #343 Minneapolis, MN | 1.0 | 1.0 | 608 | $1,255 | $2.06 | 4d | 1 | 0.06mi |
| 7254 72nd Ln N #354 Minneapolis, MN | 1.0 | 1.0 | 702 | $1,250 | $1.78 | 24d | 1 | 0.07mi |
| 7468 72nd Ln N #301 Minneapolis, MN | 1.0 | 1.0 | 608 | $1,350 | $2.22 | 4d | 1 | 0.18mi |
| 5805 73rd Ave N Brooklyn Park, MN | 1.0 | 1.0 | 685 | $1,233 | $1.80 | 4d | 2 | 0.92mi |
| 6232 65th Ave N Brooklyn Park, MN | 1.0 | 1.0 | 750 | $1,062 | $1.42 | 43d | 3 | 1.00mi |
| 5625 69th Ave N Minneapolis, MN | 1.0–2.0 | 1.0 | 750 | $1,075 | $1.43 | 24d | 11 | 1.06mi |
| 6200 78th Ave N Minneapolis, MN | 1.0 | 1.0 | 750 | $1,092 | $1.46 | 1d | 3 | 1.06mi |
| 6390 Douglas Dr N Brooklyn Park, MN | 1.0–2.0 | 1.0 | 850 | $1,179 | $1.39 | 12d | 3 | 1.16mi |
| 6455 Zane Ave N Minneapolis, MN | 1.0–3.0 | 1.0 | 952 | $1,135 | $1.19 | 4d | 12 | 1.19mi |
| 7870 Zane Ave N Minneapolis, MN | 1.0–2.0 | 1.0 | 760 | $965 | $1.27 | 1d | 12 | 1.19mi |
| 7449 Imperial Dr N Minneapolis, MN | 3.0 | 1.0 | 775 | $1,172 | $1.51 | 43d | 1 | 1.21mi |
| 7449 Imperial Dr N Minneapolis, MN | 1.0 | 1.0 | 700 | $1,159 | $1.66 | 10d | 3 | 1.22mi |
| 6046 W Broadway Ave Minneapolis, MN | 1.0–2.0 | 1.0 | 814 | $1,142 | $1.40 | 4d | 2 | 1.44mi |
HOA detail condo
- Monthly dues
- $319 · $3,828/yr
- Assessments
- None detected in remarks — confirm with the listing agent.
Listing history 34 events
-
2026-06-18days on market $65,000 Active 92 DOM
-
2026-06-17days on market $65,000 Active 91 DOM
-
2026-06-16days on market $65,000 Active 90 DOM
-
2026-06-15days on market $65,000 Active 89 DOM
-
2026-06-13days on market $65,000 Active 87 DOM
-
2026-06-09days on market $65,000 Active 83 DOM
-
2026-06-08days on market $65,000 Active 82 DOM
-
2026-06-07days on market $65,000 Active 81 DOM
-
2026-06-04days on market $65,000 Active 78 DOM
-
2026-06-03days on market $65,000 Active 77 DOM
-
2026-06-02days on market $65,000 Active 76 DOM
-
2026-06-01days on market $65,000 Active 75 DOM
-
2026-05-31days on market $65,000 Active 74 DOM
-
2026-03-19$65,000 Active 844-char remark
Show marketing remark (844 chars)
Low-Maintenance Living with Investor Potential! This well-maintained 1 bed, 1 bath corner-unit condo offers comfort, convenience, and versatility—perfect for both homeowners and savvy investors. Freshly painted with a new washer and dryer, the unit is move-in ready and designed for easy living. Enjoy the privacy of a rare fenced-in patio, ideal for relaxing, entertaining, or giving pets their own outdoor space. The corner-unit location provides added privacy and natural light, while the private garage stall offers secure parking and extra storage. Conveniently located just a short drive from major freeways, commuting and accessing nearby shopping, dining, and amenities is quick and easy. Whether you're looking for an affordable place to call home or a strong cash-flowing rental opportunity, this condo checks all the boxes.
-
2026-03-16historical $65,000 844-char remark
Show marketing remark (844 chars)
Low-Maintenance Living with Investor Potential! This well-maintained 1 bed, 1 bath corner-unit condo offers comfort, convenience, and versatility—perfect for both homeowners and savvy investors. Freshly painted with a new washer and dryer, the unit is move-in ready and designed for easy living. Enjoy the privacy of a rare fenced-in patio, ideal for relaxing, entertaining, or giving pets their own outdoor space. The corner-unit location provides added privacy and natural light, while the private garage stall offers secure parking and extra storage. Conveniently located just a short drive from major freeways, commuting and accessing nearby shopping, dining, and amenities is quick and easy. Whether you're looking for an affordable place to call home or a strong cash-flowing rental opportunity, this condo checks all the boxes.
-
2025-11-01historical $1,130
-
2025-10-09$1,130
-
2022-10-13historical
-
2022-10-01historical
-
2021-09-09soldstatus $74,000
-
2021-07-23soldstatus $74,000 Sold
-
2021-06-11status Pending
-
2021-06-01historical Contingent - Inspection
-
2021-05-01$79,990 Active
-
2021-04-17historical $79,990
-
2019-07-19soldstatus $65,000 Sold
-
2019-07-19soldstatus $65,000
-
2019-07-05status Pending
-
2019-06-28$65,000 Active
-
2007-11-30historical
-
2007-07-28$69,900
-
1993-06-25soldstatus $17,500
-
1993-01-07$18,900
-
1980-12-01soldstatus $43,400
ⓘ Source: listings_history table (triggers on properties + properties_extension) + one-shot
backfill from property_details.listing_events for pre-trigger history.
Tax reassessment forecast MN · Partial reset (capped growth)
- Current annual tax
- $912 · $76/mo
- Projected year-2 tax
- $912 · $76/mo
- Expected delta
- $0/yr ($0/mo · 0.0%)
ⓘ Screening estimate from a state-policy table — verify with the county assessor before closing.
Climate risk First Street
- Flood 1/10 Low FEMA zone X (unshaded) · 0% chance over 30 yrs
- Wildfire 1/10 Low
- Heat 2/10 Low 7 d/yr ≥99°F today · 14 d/yr by 30 yrs out
- Wind 2/10 Low
- Air quality 2/10 Low 1 unhealthy d/yr today · 2 by 30 yrs out
Nearby sold comps map
Loading sold comps map…
Walkable amenities ~0.75 mi
Loading nearby amenities…
Taxation est. · year 1
- Rental income
- $14,683
- − Mortgage interest
- −$3,641
- − Property taxes
- −$912
- − Insurance
- −$325
- − Repairs & maintenance
- −$1,175
- − Management
- −$1,175
- − HOA
- −$3,828
- − Depreciation
- −$1,891
- Taxable income
- $1,737
- Est. tax owed @ 24.0%
- −$417
- After-tax cash flow
- $2,027/yr
For passive investors: Depreciation is non-cash, so a rental often shows a tax loss while cash-flowing — sheltering income. Rental losses are passive: they offset passive income freely, and up to $25,000/yr can offset ordinary (W-2) income if you actively participate and your MAGI is under $100k (phasing out to $0 by $150k); unused losses carry forward. On sale, claimed depreciation is recaptured at up to 25%, and gains may owe capital-gains tax (a 1031 exchange can defer both). Figures are a year-1 estimate at your 24.0% rate — not tax advice; consult a CPA.
Schools (NCES district)
- District
- Osseo Public School District
- NCES district ID
- 2725200
- Math proficiency
- 42% ▼ -7.00%
- Reading proficiency
- 51% ▼ -4.00%
- Median HH income
- $76,168
- Composite
- 42.35/100
- National rank
- #3250
- State rank
- #129 of 301 in MN
Livability — Brooklyn Park
- Score
- 81/100
- State rank
- #50
- US rank
- #1308
Category grades
Schools grade is shown separately in the Schools card above.
Census & demographics
- Census place
- Brooklyn Park, MN
- County
- Hennepin County · 1,150,272 people
- City population
- 33,660
- Metro
- Minneapolis-St. Paul-Bloomington, MN-WI
- Population (ZIP)
- 32,499
- Household income
- $74,860
- Rent vs Own
- Severe rent burden
- 1939.0
Population outlook (Hennepin County) Hauer SSP2
- Today (2025)
- 1,405,227 people
- By 2030
- 1,492,650 · +6.2%
- By 2040
- 1,660,157 · +18.1%
- By 2050
- 1,823,498 · +29.8%
- By 2075
- 2,221,283 · +58.1%
- By 2100
- 2,509,976 · +78.6%
Race, ethnicity, and origin ACS 2023
- Neighborhood character
- Diverse neighborhood (Simpson 0.65)
- Race & ethnicity
- White 49% Black 30% Hispanic / Latino 8% Asian 7% Two or more races 7%
- Hispanic origin (detail)
- Mexican 5%
- Common ancestry
- Swiss 8% Portuguese 6% Romanian 2%
- Foreign-born
- 20% · Canada
- Languages at home
- 80% English-only · Spanish 6% Other Asian/Pacific 5% French/Haitian/Cajun 1%
Political lean MEDSL · Hennepin
- 2024 margin
- Solid D (+42.6) · D 70.2% · R 27.5% · Other 2.3%
- 2008→2024 swing
- +14.0pp toward D · 2008: 28.6pp · 2024: 42.6pp
- All cycles
- 2024: D+42.6 2020: D+43.2 2016: D+35.3 2012: D+27.1 2008: D+28.6
Not yet ingested
- Civics
- —
Market trends
- HPI YoY
- ▼ -276.37%
- Current HPI
- 239.4693
- Rent YoY
- ▲ 2.52%
- Metro
- Minneapolis-St. Paul-Bloomington, MN-WI
- State GDP YoY
- ▲ 2.41%
- F500 in state
- 34
Industry mix (Fortune 500 HQ in MN)
| Industry | F500 HQs | Revenue |
|---|---|---|
| Healthcare | 2 | $407B |
|
||
| Retail | 2 | $150B |
|
||
| Consumer Goods | 2 | $32B |
|
||
| Industrial Machinery | 2 | $6B |
|
||
| Agriculture | 1 | $40B |
|
||
| Healthcare / Medical Devices | 1 | $32B |
|
||
Price history
+49.8% since first listed21 events — show timeline
- 2026-03-19 Listed $65,000 NORTHSTARMLS as Distributed by MLS Grid
- 2026-03-16 Coming Soon $65,000 NORTHSTARMLS as Distributed by MLS Grid
- 2025-11-01 Rental Removed $1,130 SHOWMOJO
- 2025-10-09 Listed for Rent $1,130 SHOWMOJO
- 2022-10-13 Listing Removed — NORTHSTARMLS as Distributed by MLS Grid
- 2022-10-01 Coming Soon — NORTHSTARMLS as Distributed by MLS Grid
- 2021-09-09 Sold (Public Records) $74,000 Public Records
- 2021-07-23 Sold (MLS) $74,000 NORTHSTARMLS as Distributed by MLS Grid
- 2021-06-11 Pending — NORTHSTARMLS as Distributed by MLS Grid
- 2021-06-01 Contingent — NORTHSTARMLS as Distributed by MLS Grid
- 2021-05-01 Listed $79,990 NORTHSTARMLS as Distributed by MLS Grid
- 2021-04-17 Coming Soon $79,990 NORTHSTARMLS as Distributed by MLS Grid
- 2019-07-19 Sold (Public Records) $65,000 Public Records
- 2019-07-19 Sold (MLS) $65,000 NORTHSTARMLS as Distributed by MLS Grid
- 2019-07-05 Pending — NORTHSTARMLS as Distributed by MLS Grid
- 2019-06-28 Listed $65,000 NORTHSTARMLS as Distributed by MLS Grid
- 2007-11-30 Listing Removed — NORTHSTARMLS as Distributed by MLS Grid
- 2007-07-28 Listed $69,900 NORTHSTARMLS as Distributed by MLS Grid
- 1993-06-25 Sold (MLS) $17,500 NORTHSTARMLS as Distributed by MLS Grid
- 1993-01-07 Listed $18,900 NORTHSTARMLS as Distributed by MLS Grid
- 1980-12-01 Sold (Public Records) $43,400 Public Records
Property tax history
+5.8%/yrLatest (2025): $912 · -3.4% YoY. Source: county tax records.
Cash-flow waterfall
monthlySold comps — $/sqft
last 12 mo · ≤1 miLoading sold comps…