 🏗️ New Construction
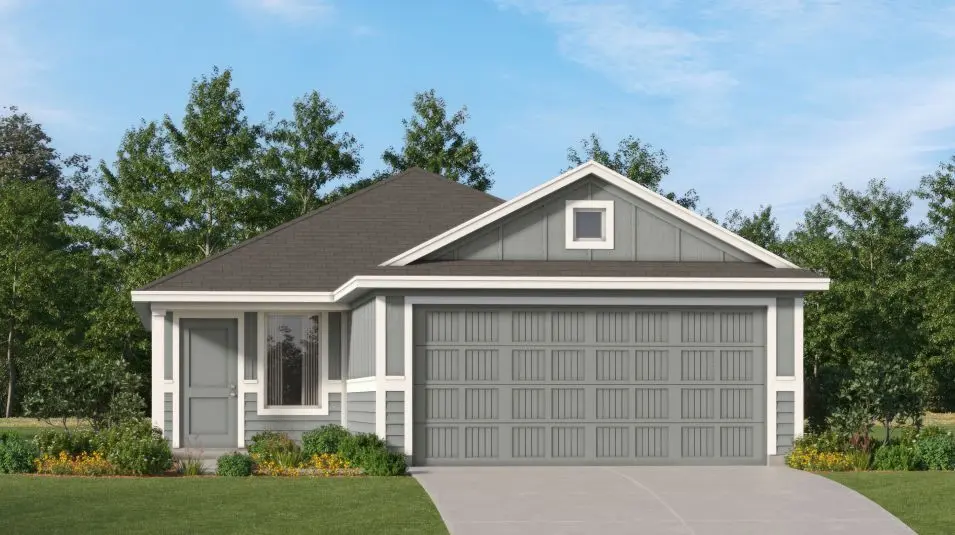
Kitson Plan · New Fairview, TX
Flood risk 1/10 · Minimal
- FEMA flood zone
- X (unshaded)
- Chance of flooding over 30 yrs
- 0.0%
- Est. flood insurance / yr
- —
Fire risk 8/10 · Major
- Est. fire insurance / yr
- $1,222 – $2,270
Heat risk 7/10 · Major
- Hot days now (above 109°F)
- 7 days/yr
- Hot days in 30 yrs
- 22 days/yr
Wind risk 6/10 · Moderate
- Chance of severe wind over 30 yrs
- 19.0%
Air-quality risk No data
- Unhealthy air days now
- —
- Unhealthy air days in 30 yrs
- —
Risk factors via First Street. Map © Google.
Why this score? — see what drove the D grade
The composite is a weighted blend of 9 inputs, each scored 0–100. Each bar is that input's sub-score; the figure is the points it added to the 100-point composite (weight × sub-score).
- Appreciation +10.0/10.0
- Cash flow +8.4/30.0
- ARV discount +7.5/15.0
- Schools +4.6/10.0
- Livability +3.1/5.0
- 1% rule +2.6/10.0
- Rent growth +2.5/5.0
- Condition / age +2.5/5.0
- DSCR +2.3/10.0
$276,999
🖨 Deal sheet 📄 Offer letter ✓ Due diligence
Listing remarks MLS
This single-level home showcases a spacious open floorplan shared between the kitchen, dining area and family room for easy entertaining during gatherings. An owner's suite enjoys a private location in a rear corner of the home, complemented by an en-suite bathroom and walk-in closet. There are two secondary bedrooms along the side of the home, which are comfortable spaces for household members and overnight guests.
Key facts
- Open space
- Trails
- Single-family homes
Tags
Neighborhood map
What this means for you Summary
Snapshot
- This is a 3-bed/2.0-bath single-family listed at $277k.
Deal economics
- At list price, monthly cash flow is $-239 ($-3k/yr) — negative.
- To cash-flow at today's rent, offer at most $232k (16.3% below list).
- To meet the 1% rule (rent ≥ 1% of price), the offer needs to be $203k (26.8% below list).
- Recommended offer: $203k (26.8% below list) — sets the bar for 1% rule.
- Cap rate 5.2% vs local median 2.5% in New Fairview — top-decile yield for the area; either an underpriced asset or a hidden risk that comps aren't pricing in. Stress-test before assuming the spread holds.
Location & tenants
- Location reads 62/100 on livability (#901 in TX) — a middle-class / working-renter tenant base. Strengths: employment A+, cost of living A+, housing A+; Watch: schools F, amenities F, commute F.
- Northwest ISD (rural): math 48% / reading 52% proficiency, ranked #120 of 826 in TX (top 14%) — acceptable for families but not a draw, mixed tenant base, ~2y average lease.
- Market conditions: 262 active listings in the ZIP; 14 comparable units currently listed for rent nearby; rentals at typical pace (median 20d on market — plan ~3-4 weeks tenant-placement turnaround); solid renter incomes; 10,531 units permitted in Denton County in 2024 (2,713 in 5+ unit buildings).
Forward outlook
- In year one you build about $28k of equity ($2k loan paydown + $27k appreciation (10.0% local appreciation)).
- Denton County population projected at +66% by 2050 — long-run rental-demand tailwind backs the buy-and-hold thesis.
- By year 2, paydown + projected appreciation supports a ~$46k cash-out refi (75% LTV) — recoverable capital for the next deal without selling this one.
Negotiation context
- It's been on market 592 days — a 12% lower offer ($244k) is reasonable based on typical stale-listing flexibility.
- 2 sale attempts since 2y ago with the ask held roughly flat each time — persistent listings suggest the price (not the market) is what's stuck; bring a comps-based counter.
Risks & watch-outs
- Climate carrying-cost: major wind risk; severe wildfire risk; extreme-heat days projected 7→22/yr by 2055 (HVAC capex compounding) — expect insurance premiums to compound above CPI over the hold.
Questions for the listing agent
- What do current leases actually rent for vs. the listed asking? Can we see a recent rent roll and the last 12 months of T-12 income?
- It's been on market 592 days. Have you received any prior offers? Is the seller open to a 27% concession, seller financing, or rate buy-down credit?
- Why hasn't it sold? Are there any deal-killer items the seller is aware of (foundation, flood, title, zoning, code violations)?
- Is there a deadline driving the sale (1031 exchange, divorce, estate, relocation)? That informs how much negotiation room exists.
- Schools are F-rated, which usually means shorter tenancies and higher turnover. Who's the typical renter profile here, and what's been the actual vacancy rate?
- The area grade is low — what's the realistic commute time and amenity access for the typical tenant pool here? Any planned neighborhood developments (good or bad) we should know about?
- What's the average days-on-market for RENTAL listings here right now (not sales)? A rising rental-DOM trend means longer vacancies and softer asking-rent achievability than the comps imply.
- What's the recent tenant-quality profile in this submarket — average credit score on applications, eviction rate, late-payment / NSF rate, and stable-employment percentage? A property-management company in the area should have these aggregated.
- How much new for-sale + rental construction is in the pipeline within 1–3 miles? Heavy new supply typically softens prices + rents 12–24 months out; constrained supply supports both.
Investment metrics
- 1% rule
- 0.76% ✗
- Cap rate
- 5.21%
- Cash-on-cash
- -3.85%
- DSCR
- 0.83
- GRM
- 11.0
CMA / ARV
- ARV (median comp)
- $266,374
- List price
- $276,999
- Delta
- 3.99%
- Verdict
- FAIR
- Comps
- 20 within 1.0 mi
Show comp detail 12 sales within ~0.75 mi
| Address | Dist | Beds/Ba | Sqft | Sold | Price | $/sf | Match |
|---|---|---|---|---|---|---|---|
| 11402 Marcellus Way | 0.02mi | 3/2.0 | 1,411 (+1%) | 7mo | $251,099 | $178 | 92 |
| 11811 Mancos Trl | 0.01mi | 3/2.0 | 1,474 (+5%) | 6mo | $256,099 | $174 | 86 |
| 11850 Gabbro Dr | 0.13mi | 3/2.0 | 1,450 (+3%) | 3mo | $249,000 | $172 | 86 |
| 11716 Mancos Trl | 0.05mi | 3/2.0 | 1,474 (+5%) | 7mo | $254,024 | $172 | 83 |
| 11551 Antrim Pl | 0.30mi | 3/2.0 | 1,402 (0%) | 6mo | $266,949 | $190 | 81 |
| 11531 Antrim Pl | 0.31mi | 3/2.0 | 1,402 (0%) | 7mo | $242,149 | $173 | 80 |
| 11715 Mancos Trl | 0.04mi | 3/2.0 | 1,266 (-10%) | 6mo | $241,399 | $191 | 77 |
| 11742 Gammon Ave | 0.23mi | 3/2.0 | 1,266 (-10%) | 1mo | $249,999 | $197 | 72 |
| 12629 Forest Lawn Rd | 0.58mi | 3/2.0 | 1,381 (-2%) | 6mo | $262,000 | $190 | 66 |
| 12242 Big Rock Dr | 0.59mi | 3/2.0 | 1,355 (-3%) | 6mo | $255,000 | $188 | 61 |
| 12418 Worthington Ln | 0.51mi | 3/2.0 | 1,599 (+14%) | 5mo | $265,000 | $166 | 48 |
| 12826 Carpenter Ln | 0.71mi | 4/2.0 (+1) | 1,536 (+10%) | 3mo | $272,500 | $177 | 44 |
Match score weights: distance 35% · size 25% · config 20% · recency 20%. Top-matched comps best support the ARV.
Projected returns pro-forma
10.0% appreciation · 3.0% rent growth · sell at horizon
- IRR
- 21.5%
- Equity multiple
- 2.74×
- Total profit
- $129,854
- Equity at exit
- $239,971
- IRR
- 19.4%
- Equity multiple
- 6.29×
- Total profit
- $394,452
- Equity at exit
- $517,507
Cash invested: $74,585 (down + closing). Projections, not guarantees.
Landlord ↔ Tenant lean methodology
- Overall (STATE)
- 87 Strongly Landlord-Friendly
- State Texas
- 87 Strongly Landlord-Friendly · R+5
- County
- — inherits STATE
- City
- — inherits STATE
ZIP-level market 76078
- Home prices YoY
- 6.5%
- Active inventory
- 262
- Price-to-rent
- 11.4×
Monthly cashflow live
- Estimated rent
- $2,027 high interval (Pro) →
- Mortgage (P&I)
- −$1,397
- Tax est. 1.5%
- −$333 /mo · $3,996/yr
- Insurance
- −$111
- HOA
- −$0
- Vacancy / Maint / Mgmt
- −$426
- Net cashflow
- $-239
Break-even live
UW: 25.0% down · 7.5% · 30yr · 1.5% tax · 5.0% vac · 8.0% maint · 8.0% mgmt
Financing live
Cash to close
- Down payment
- $66,594
- Closing costs
- $7,991
- Reserves months
- —
- Total cash needed
- —
Loan-product check · same deal, 3 products live
Conventional
25% down · 7.5% · 30yr
- Down + closing
- —
- Monthly P&I
- —
- Monthly cashflow
- —
- DSCR
- —
- Eligible?
- —
Personal DTI + credit; lowest rate.
DSCR
20% down · 8.5% · 30yr
- Down + closing
- —
- Monthly P&I
- —
- Monthly cashflow
- —
- DSCR
- —
- Eligible?
- —
No personal income docs; deal must DSCR.
Hard money
10% down · 12.0% · 12mo
- Down + closing
- —
- Monthly P&I
- —
- Monthly cashflow
- —
- DSCR
- —
- Eligible?
- —
Short-term bridge; refi at stabilization.
Rent comps 14 comps
| Address | Beds | Baths | Sqft | Rent | $/sqft | DOM | Units | Dist |
|---|---|---|---|---|---|---|---|---|
| 11828 Mancos Trl Justin, TX | 3.0 | 2.0 | 1474 | $1,809 | $1.23 | 43d | 1 | 0.06mi |
| 11846 Arkoma Dr Justin, TX | 3.0 | 2.0 | 1266 | $1,900 | $1.50 | 12d | 1 | 0.11mi |
| 12408 Sunland Ave Rhome, TX | 3.0 | 2.0 | 1557 | $1,875 | $1.20 | 43d | 1 | 0.61mi |
| 12808 Kingsgate Dr Rhome, TX | 3.0 | 2.0 | 1397 | $2,000 | $1.43 | 18d | 1 | 0.68mi |
| 12630 Carpenter Ln Rhome, TX | 3.0 | 2.0 | 1557 | $1,879 | $1.21 | 24d | 1 | 0.72mi |
| 16729 Milwaukee St Justin, TX | 4.0 | 2.0 | 1836 | $2,325 | $1.27 | 3d | 1 | 0.80mi |
| 16617 Porterfield Ln Justin, TX | 3.0 | 2.0 | 1554 | $2,095 | $1.35 | 43d | 1 | 0.88mi |
| 16612 Portage St Justin, TX | 3.0 | 2.0 | 1478 | $2,000 | $1.35 | 43d | 1 | 0.97mi |
| 708 Basteen Ln Justin, TX | 4.0 | 2.0 | 1728 | $2,300 | $1.33 | 11d | 1 | 1.09mi |
| 1017 Valerian Dr Haslet, TX | 3.0 | 2.0 | 1734 | $2,250 | $1.30 | 3d | 1 | 1.15mi |
| 16009 Wanderer Ln Haslet, TX | 3.0 | 2.0 | 1427 | $2,100 | $1.47 | 19d | 1 | 1.15mi |
| 16428 Milwaukee St Justin, TX | 4.0 | 2.0 | 1738 | $2,500 | $1.44 | 43d | 1 | 1.17mi |
| 1049 Knightly Ln Haslet, TX | 3.0 | 2.0 | 1721 | $2,195 | $1.28 | 18d | 1 | 1.20mi |
| 16029 Pemberly Way Haslet, TX | 3.0 | 2.0 | 1721 | $2,095 | $1.22 | 12d | 1 | 1.33mi |
Listing history 16 events
-
2026-06-18days on market $276,999 Active 592 DOM
-
2026-06-17days on market $276,999 Active 591 DOM
-
2026-06-16days on market $276,999 Active 590 DOM
-
2026-06-15days on market $276,999 Active 589 DOM
-
2026-06-13days on market $276,999 Active 587 DOM
-
2026-06-09days on market $276,999 Active 583 DOM
-
2026-06-08days on market $276,999 Active 582 DOM
-
2026-06-07days on market $276,999 Active 581 DOM
-
2026-06-04days on market $276,999 Active 578 DOM
-
2026-06-03days on market $276,999 Active 577 DOM
-
2026-06-02days on market $276,999 Active 576 DOM
-
2026-06-01days on market $276,999 Active 575 DOM
-
2026-05-31days on market $276,999 Active 574 DOM
-
2025-02-08status Active 419-char remark
Show marketing remark (419 chars)
This single-level home showcases a spacious open floorplan shared between the kitchen, dining area and family room for easy entertaining during gatherings. An owner's suite enjoys a private location in a rear corner of the home, complemented by an en-suite bathroom and walk-in closet. There are two secondary bedrooms along the side of the home, which are comfortable spaces for household members and overnight guests.
-
2025-02-07historical 419-char remark
Show marketing remark (419 chars)
This single-level home showcases a spacious open floorplan shared between the kitchen, dining area and family room for easy entertaining during gatherings. An owner's suite enjoys a private location in a rear corner of the home, complemented by an en-suite bathroom and walk-in closet. There are two secondary bedrooms along the side of the home, which are comfortable spaces for household members and overnight guests.
-
2024-11-02$276,999 Active 419-char remark
Show marketing remark (419 chars)
This single-level home showcases a spacious open floorplan shared between the kitchen, dining area and family room for easy entertaining during gatherings. An owner's suite enjoys a private location in a rear corner of the home, complemented by an en-suite bathroom and walk-in closet. There are two secondary bedrooms along the side of the home, which are comfortable spaces for household members and overnight guests.
ⓘ Source: listings_history table (triggers on properties + properties_extension) + one-shot
backfill from property_details.listing_events for pre-trigger history.
Climate risk First Street
- Flood 1/10 Low FEMA zone X (unshaded) · 0% chance over 30 yrs
- Wildfire 8/10 Severe
- Heat 7/10 Severe 7 d/yr ≥109°F today · 22 d/yr by 30 yrs out
- Wind 6/10 Major 19% chance of damaging wind over 30 yrs
Nearby sold comps map
Loading sold comps map…
Walkable amenities ~0.75 mi
Loading nearby amenities…
Taxation est. · year 1
- Rental income
- $24,325
- − Mortgage interest
- −$14,921
- − Property taxes
- −$3,996
- − Insurance
- −$1,332
- − Repairs & maintenance
- −$1,946
- − Management
- −$1,946
- − Depreciation
- −$7,749
- Taxable loss
- −$7,565
- Est. tax savings @ 24.0%
- +$1,816
- After-tax cash flow
- $-1,058/yr
For passive investors: Depreciation is non-cash, so a rental often shows a tax loss while cash-flowing — sheltering income. Rental losses are passive: they offset passive income freely, and up to $25,000/yr can offset ordinary (W-2) income if you actively participate and your MAGI is under $100k (phasing out to $0 by $150k); unused losses carry forward. On sale, claimed depreciation is recaptured at up to 25%, and gains may owe capital-gains tax (a 1031 exchange can defer both). Figures are a year-1 estimate at your 24.0% rate — not tax advice; consult a CPA.
Schools (NCES district)
- District
- Northwest ISD
- NCES district ID
- 4833180
- Math proficiency
- 48% ▼ -15.00%
- Reading proficiency
- 52% ▼ -8.00%
- Median HH income
- $85,315
- Composite
- 46.15/100
- National rank
- #2504
- State rank
- #120 of 826 in TX
Livability — New Fairview
- Score
- 62/100
- State rank
- #901
- US rank
- #16172
Category grades
Schools grade is shown separately in the Schools card above.
Census & demographics
- County
- Wise County · 49,037 people
- City population
- 10,200
- Metro
- Dallas-Fort Worth-Arlington, TX
- Population (ZIP)
- 10,828
- Household income
- $99,866
- Rent vs Own
- Severe rent burden
- 10.0
Population outlook (Denton County) Hauer SSP2
- Today (2025)
- 1,053,010 people
- By 2030
- 1,192,269 · +13.2%
- By 2040
- 1,472,920 · +39.9%
- By 2050
- 1,746,506 · +65.9%
- By 2075
- 2,358,497 · +124.0%
- By 2100
- 2,779,183 · +163.9%
Race, ethnicity, and origin ACS 2023
- Neighborhood character
- Predominantly White (69%)
- Race & ethnicity
- White 69% Hispanic / Latino 24% Two or more races 11% Native American 4% Black 2%
- Hispanic origin (detail)
- Mexican 20% Puerto Rican 3%
- Common ancestry
- Slovak 2% Lithuanian 2% Italian 1%
- Foreign-born
- 6% · Canada
- Languages at home
- 85% English-only · Spanish 14% German/W. Germanic 1%
Political lean MEDSL · Denton
- 2024 margin
- R (+13.2) · D 42.7% · R 55.8% · Other 1.5%
- 2008→2024 swing
- +11.0pp toward D · 2008: -24.2pp · 2024: -13.2pp
- All cycles
- 2024: R+13.2 2020: R+8.1 2016: R+20.2 2012: R+31.7 2008: R+24.2
Not yet ingested
- Civics
- —
Market trends
- HPI YoY
- ▲ 19.94%
- Current HPI
- 325.22
- Rent YoY
- —
- Metro
- Dallas-Fort Worth-Arlington, TX
- State GDP YoY
- ▲ 3.95%
- F500 in state
- 110
Industry mix (Fortune 500 HQ in TX)
| Industry | F500 HQs | Revenue |
|---|---|---|
| Energy | 16 | $1,198B |
|
||
| Technology | 5 | $198B |
|
||
| Engineering / Construction | 4 | $72B |
|
||
| Energy Services | 3 | $60B |
|
||
| Utilities | 3 | $41B |
|
||
| Healthcare | 2 | $330B |
|
||
Price history
3 events — show timeline
- 2025-02-08 Relisted — Zillow
- 2025-02-07 Delisted — Zillow
- 2024-11-02 Listed $276,999 Zillow
Cash-flow waterfall
monthlySold comps — $/sqft
last 12 mo · ≤1 miLoading sold comps…