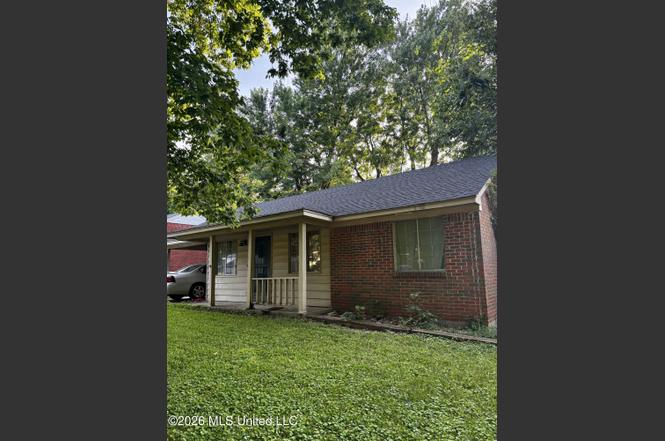
8301 Whitehead Dr · Southaven, MS
Flood risk 1/10 · Minimal
- FEMA flood zone
- X (unshaded)
- Chance of flooding over 30 yrs
- 0.0%
- Est. flood insurance / yr
- $507 – $1,088
Fire risk 3/10 · Minor
- Est. fire insurance / yr
- $1,241 – $2,305
Heat risk 6/10 · Moderate
- Hot days now (above 109°F)
- 7 days/yr
- Hot days in 30 yrs
- 21 days/yr
Wind risk 4/10 · Minor
- Chance of severe wind over 30 yrs
- 18.0%
Air-quality risk 2/10 · Minimal
- Unhealthy air days now
- 2 days/yr
- Unhealthy air days in 30 yrs
- 2 days/yr
Risk factors via First Street. Map © Google.
Why this score? — see what drove the B+ grade
The composite is a weighted blend of 9 inputs, each scored 0–100. Each bar is that input's sub-score; the figure is the points it added to the 100-point composite (weight × sub-score).
- Cash flow +30.0/30.0
- ARV discount +15.0/15.0
- DSCR +10.0/10.0
- 1% rule +8.2/10.0
- Schools +4.0/10.0
- Rent growth +3.3/5.0
- Livability +3.2/5.0
- Condition / age +2.5/5.0
- Appreciation +0.0/10.0
$119,000
🖨 Deal sheet (PDF) 📄 Offer letter ✓ Due diligence
Listing remarks
INVESTOR SPECIAL!!!!
Key facts
- 7,840 sq ft lot
- Garage
- Built 1963
Property features AI
Exterior
- Parking: Attached garage; 1-space carport; Concrete parking surfaces
- Utilities: Public water; Public sewer; Electricity connected; Natural gas connected; Cable available
- Home design: Single-family house; One story; Brick construction; Slab foundation; Asphalt shingle roof
- Construction: Brick exterior; Slab foundation; Asphalt shingle roof
- Exterior features: Private yard; Porch; Full fencing
Interior
- Kitchen: Dishwasher; Disposal; Electric range; Range hood; Eat-in kitchen with breakfast bar
- Flooring: Wood; Tile
- Bathrooms: 1 full bathroom
- Heating & cooling: Central heating; Central air conditioning
- Interior features: Bookcases; Breakfast bar; Built-in features; Ceiling fans; Eat-in kitchen; Dead bolt locks; Wood and tile floors; Fireplace
- Laundry & utility: Washer; Dryer
Neighborhood map
What this means for you Summary
Snapshot
- This is a 3-bed/1.0-bath single-family listed at $119k.
Deal economics
- At list price, monthly cash flow is $504 ($6k/yr) — positive.
- The deal already cash-flows at list — no discount required.
- Meets the 1% rule at list price ($2k rent vs $119k).
- Cap rate 11.4% vs local median 5.2% in Southaven — top-decile yield for the area; either an underpriced asset or a hidden risk that comps aren't pricing in. Stress-test before assuming the spread holds.
Location & tenants
- Location reads 65/100 on livability (#107 in MS) — a middle-class / working-renter tenant base. Strengths: cost of living A+, housing A+; Watch: amenities F, commute F, health & safety F.
- Desoto County School District (suburban): math 48% / reading 42% proficiency, ranked #20 of 130 in MS (top 15%) — families likely to look elsewhere, expect single-tenant / working-renter base with shorter leases.
- Zoned schools: Southaven Elementary (math 20% / reading 23%, grade F, #239 of 375 statewide, top 64%, 684 students, 100% FRL); Southaven Middle School (math 33% / reading 25%, grade F, #90 of 179 statewide, top 52%, 1,456 students, 100% FRL); Southaven High School (math 26% / reading 35%, grade F, #88 of 197 statewide, top 45%, 1,850 students, 100% FRL) — zoned schools average 100% FRL vs 43% district-wide (56 pts higher); higher-poverty schools than district average — tighter screening recommended.
- Zoned-school proficiency averages 27% at this address vs 45% district-wide (-18 pts) — the specific schools serving this property underperform the Desoto County School District average; the district grade overstates school quality for this exact location.
- Market conditions: Rents rising (+3.2%/yr); 193 active listings in the ZIP; 37 comparable units currently listed for rent nearby; rentals at typical pace (median 25d on market — plan ~3-4 weeks tenant-placement turnaround); 1,155 units permitted in DeSoto County in 2024 (0 in 5+ unit buildings).
- This rent runs 30% of the median local income ($62k/yr) — at the standard rent-burdened threshold; future hikes will face affordability resistance.
Forward outlook
- Local home prices are declining (-3.0%/yr); year-one equity from $823 of loan paydown is wiped out by about $4k of value loss. Plan a longer hold.
- DeSoto County population projected at +33% by 2050 — long-run rental-demand tailwind backs the buy-and-hold thesis.
- At projected returns (-3.0% appreciation + 3.2% rent growth), your $33k cash investment doubles in ~7 years — after that, you're playing with house money.
Negotiation context
- Only 5 days on market — expect competitive offers; lowballing is unlikely to land.
- 2 sale attempts since 15y ago with the ask held roughly flat each time — persistent listings suggest the price (not the market) is what's stuck; bring a comps-based counter.
Risks & watch-outs
- Climate carrying-cost: extreme-heat days projected 7→21/yr by 2055 (HVAC capex compounding) — expect insurance premiums to compound above CPI over the hold.
Questions for the listing agent
- Built in 1963 — when were the roof, HVAC, electrical panel, plumbing, and water heater last replaced?
- Is there a deadline driving the sale (1031 exchange, divorce, estate, relocation)? That informs how much negotiation room exists.
- Schools are D-rated, which usually means shorter tenancies and higher turnover. Who's the typical renter profile here, and what's been the actual vacancy rate?
- What's the average days-on-market for RENTAL listings here right now (not sales)? A rising rental-DOM trend means longer vacancies and softer asking-rent achievability than the comps imply.
- What's the recent tenant-quality profile in this submarket — average credit score on applications, eviction rate, late-payment / NSF rate, and stable-employment percentage? A property-management company in the area should have these aggregated.
- How much new for-sale + rental construction is in the pipeline within 1–3 miles? Heavy new supply typically softens prices + rents 12–24 months out; constrained supply supports both.
Investment metrics
- 1% rule
- 1.32% ✓
- Cap rate
- 11.38%
- Cash-on-cash
- 18.15%
- DSCR
- 1.81
- GRM
- 6.3
CMA / ARV
- ARV (on-the-fly)
- $165,984
- Comps found
- 12
Show comp detail 12 sales within ~0.75 mi
| Address | Dist | Beds/Ba | Sqft | Sold | Price | $/sf | Match |
|---|---|---|---|---|---|---|---|
| 8281 Whitehead | 0.02mi | 3/1.0 | 1,200 (+10%) | 5mo | $165,000 | $138 | 78 |
| 8628 Kinard Cv | 0.34mi | 3/1.0 | 1,069 (-2%) | 3mo | $180,000 | $168 | 78 |
| 1884 S Conerly Dr | 0.11mi | 3/1.5 | 1,200 (+10%) | 2mo | $185,000 | $154 | 75 |
| 1818 Whitehead Dr | 0.23mi | 3/1.0 | 1,197 (+10%) | 2mo | $165,000 | $138 | 72 |
| 1821 Tad Cv | 0.18mi | 3/1.0 | 983 (-10%) | 6mo | $149,900 | $152 | 70 |
| 8216 Caprock Cv | 0.28mi | 3/1.5 | 1,219 (+12%) | 4mo | $185,000 | $152 | 63 |
| 7697 Coral Hills Cv | 0.66mi | 3/2.0 | 1,104 (+1%) | 5mo | $224,000 | $203 | 59 |
| 1896 N Southaven Cir | 0.40mi | 3/1.0 | 975 (-11%) | 6mo | $100,000 | $103 | 59 |
| 8232 Caprock Cv | 0.27mi | 3/1.5 | 1,252 (+15%) | 3mo | $205,000 | $164 | 58 |
| 1590 E Gilford Cv | 0.59mi | 3/1.0 | 1,000 (-8%) | 0mo | $149,900 | $150 | 58 |
| 1733 Coral Hills Dr | 0.69mi | 3/1.5 | 1,222 (+12%) | 5mo | $184,900 | $151 | 42 |
| 7752 Charleston Dr | 0.62mi | 4/2.0 (+1) | 1,242 (+14%) | 1mo | $185,000 | $149 | 38 |
Match score weights: distance 35% · size 25% · config 20% · recency 20%. Top-matched comps best support the ARV.
Projected returns pro-forma
-3.0% appreciation · 3.2% rent growth · sell at horizon
- IRR
- 10.0%
- Equity multiple
- 1.39×
- Total profit
- $13,105
- Equity at exit
- $17,743
- IRR
- 19.2%
- Equity multiple
- 2.62×
- Total profit
- $53,935
- Equity at exit
- $10,289
Cash invested: $33,320 (down + closing). Projections, not guarantees.
Landlord ↔ Tenant lean methodology
- Overall (STATE)
- 90 Strongly Landlord-Friendly
- State Mississippi
- 90 Strongly Landlord-Friendly · R+11
- County
- — inherits STATE
- City
- — inherits STATE
ZIP-level market 38671
- Home prices YoY
- -18.2%
- Rents YoY
- 3.2%
- Active inventory
- 193
- Price-to-rent
- 6.3×
Monthly cashflow live
- Estimated rent
- $1,571 high interval (Pro) →
- Mortgage (P&I)
- −$624
- Tax from tax record
- −$63 /mo · $760/yr
- Insurance
- −$50
- HOA
- −$0
- Vacancy / Maint / Mgmt
- −$330
- Net cashflow
- $504
Break-even live
Sensitivity live
| Price | -10% $571 | -5% $538 | +0% $504 | +5% $470 | +10% $437 |
|---|---|---|---|---|---|
| Rent | -10% $380 | -5% $442 | +0% $504 | +5% $566 | +10% $628 |
| Rate | -1.0pp $564 | -0.5pp $534 | base $504 | +0.5pp $473 | +1.0pp $442 |
UW: 25.0% down · 7.5% · 30yr · 1.5% tax · 5.0% vac · 8.0% maint · 8.0% mgmt
Financing live
Cash to close
- Down payment
- $29,750
- Closing costs
- $3,570
- Reserves months
- —
- Total cash needed
- —
Loan-product check · same deal, 3 products live
Conventional
25% down · 7.5% · 30yr
- Down + closing
- —
- Monthly P&I
- —
- Monthly cashflow
- —
- DSCR
- —
- Eligible?
- —
Personal DTI + credit; lowest rate.
DSCR
20% down · 8.5% · 30yr
- Down + closing
- —
- Monthly P&I
- —
- Monthly cashflow
- —
- DSCR
- —
- Eligible?
- —
No personal income docs; deal must DSCR.
Hard money
10% down · 12.0% · 12mo
- Down + closing
- —
- Monthly P&I
- —
- Monthly cashflow
- —
- DSCR
- —
- Eligible?
- —
Short-term bridge; refi at stabilization.
Rent comps 37 comps
| Address | Beds | Baths | Sqft | Rent | $/sqft | DOM | Units | Dist |
|---|---|---|---|---|---|---|---|---|
| 1842 Brookhaven Dr Southaven, MS | 3.0 | 1.0 | 1200 | $1,395 | $1.16 | 5d | 1 | 0.10mi |
| 8349 Cedarbrush Dr Southaven, MS | 3.0 | 1.5 | 1200 | $1,395 | $1.16 | 44d | 1 | 0.12mi |
| 8328 Dottley Dr Southaven, MS | 3.0 | 2.0 | 1184 | $1,573 | $1.33 | 44d | 1 | 0.32mi |
| 8495 Charleston Dr Southaven, MS | 3.0 | 1.5 | 1450 | $1,345 | $0.93 | 15d | 1 | 0.33mi |
| 1699 Whitehead Dr Southaven, MS | 3.0 | 1.0 | 1000 | $1,195 | $1.20 | 44d | 1 | 0.33mi |
| 8297 Baldwyn Cv Southaven, MS | 3.0 | 1.0 | 1065 | $1,323 | $1.24 | 24d | 1 | 0.36mi |
| 1732 Carla Cv Southaven, MS | 4.0 | 1.5 | 1196 | $1,600 | $1.34 | 5d | 1 | 0.42mi |
| 8282 Fayette Cv Southaven, MS | 3.0 | 1.5 | 1297 | $1,545 | $1.19 | 15d | 1 | 0.46mi |
| 8280 Hastings Cv Southaven, MS | 3.0 | 1.5 | 1184 | $1,350 | $1.14 | 22d | 1 | 0.48mi |
| 1984 Custer Dr Southaven, MS | 3.0 | 2.0 | 1131 | $1,523 | $1.35 | 44d | 1 | 0.50mi |
| 1590 Custer Dr Southaven, MS | 3.0 | 1.0 | 900 | $1,295 | $1.44 | 21d | 1 | 0.65mi |
| 7757 Charleston Dr Southaven, MS | 4.0 | 2.0 | 1325 | $1,650 | $1.25 | 24d | 1 | 0.65mi |
| 1344 Brandywine Dr Southaven, MS | 4.0 | 2.0 | 1473 | $1,595 | $1.08 | 12d | 1 | 0.72mi |
| 1748 Newington Cv Southaven, MS | 3.0 | 1.5 | 1124 | $1,500 | $1.33 | 24d | 1 | 0.72mi |
| 2179 Coral Hills Dr Southaven, MS | 4.0 | 1.5 | 1451 | $1,395 | $0.96 | 22d | 1 | 0.75mi |
| 1416 Moss Point Dr Southaven, MS | 3.0 | 1.0 | 1197 | $1,533 | $1.28 | 44d | 1 | 0.75mi |
| 1766 Dorchester Dr Southaven, MS | 3.0 | 2.0 | 1200 | $1,585 | $1.32 | 24d | 1 | 0.79mi |
| 1449 Ticonderoga Dr Southaven, MS | 4.0 | 1.5 | 1447 | $1,623 | $1.12 | 24d | 1 | 0.79mi |
| 7605 Davis Pkwy Southaven, MS | 3.0 | 2.0 | 1351 | $1,710 | $1.27 | 24d | 1 | 0.91mi |
| 7661 Ragland Pl Southaven, MS | 3.0 | 2.0 | 1242 | $1,793 | $1.44 | 44d | 1 | 0.92mi |
| 1319 Stateline Rd W Southaven, MS | 3.0 | 1.5 | 1189 | $1,395 | $1.17 | 5d | 1 | 0.95mi |
| 1296 Vicksburg Dr Southaven, MS | 3.0 | 1.0 | 1000 | $1,250 | $1.25 | 24d | 1 | 1.03mi |
| 842 Farmington Dr N Southaven, MS | 3.0 | 2.0 | 1400 | $1,595 | $1.14 | 5d | 1 | 1.15mi |
| 7400 Pintail Dr Horn Lake, MS | 4.0 | 2.0 | 1450 | $1,595 | $1.10 | 5d | 1 | 1.20mi |
| 7430 Pintail Dr Horn Lake, MS | 4.0 | 2.0 | 1479 | $1,630 | $1.10 | 44d | 1 | 1.21mi |
| 7560 Chesteridge Ave Southaven, MS | 1.0–3.0 | 1.0–2.0 | 887 | $1,475 | $1.66 | 2d | 7 | 1.22mi |
| 5572 Lochinvar Dr Southaven, MS | 3.0 | 1.0 | 1065 | $1,090 | $1.02 | 44d | 1 | 1.23mi |
| 4896 Lochinvar Dr Southaven, MS | 3.0 | 1.5 | 1112 | $1,081 | $0.97 | 22d | 1 | 1.23mi |
| 2621 Pintail Dr Horn Lake, MS | 3.0 | 2.0 | 1356 | $1,740 | $1.28 | 5d | 1 | 1.24mi |
| 7623 Caitlynn Cir W Horn Lake, MS | 3.0 | 2.0 | 1229 | $1,705 | $1.39 | 44d | 1 | 1.30mi |
| 3229 Earlcastle Dr Southaven, MS | 3.0 | 2.0 | 1353 | $1,963 | $1.45 | 3d | 1 | 1.33mi |
| 1000 Sutton Pl Horn Lake, MS | 2.0 | 2.0 | 1100 | $1,540 | $1.40 | 45d | 1 | 1.35mi |
| 3242 Earlcastle Dr Southaven, MS | 3.0 | 2.0 | 1348 | $1,725 | $1.28 | 3d | 1 | 1.36mi |
| 7139 Hampton Dr Horn Lake, MS | 3.0 | 2.0 | 1247 | $1,550 | $1.24 | 24d | 1 | 1.39mi |
| 7084 Windsor Dr Horn Lake, MS | 4.0 | 2.0 | 1480 | $1,815 | $1.23 | 5d | 1 | 1.42mi |
| 7123 Hampton Dr Horn Lake, MS | 4.0 | 2.0 | 1214 | $1,630 | $1.34 | 12d | 1 | 1.43mi |
| 6871 Center St Horn Lake, MS | 2.0 | 1.0 | 1400 | $1,395 | $1.00 | 44d | 1 | 1.48mi |
Listing history 5 events
-
2026-06-18days on market $119,000 Active 5 DOM
-
2026-06-17days on market $119,000 Active 4 DOM
-
2026-06-16days on market $119,000 Active 3 DOM
-
2026-06-15remarks 20-char remark
-
2026-06-15$119,000 Active 2 DOM
ⓘ Source: listings_history table (triggers on properties + properties_extension) + one-shot
backfill from property_details.listing_events for pre-trigger history.
Tax reassessment forecast MS · Resets to sale price
- Current annual tax
- $760 · $63/mo
- Projected year-2 tax
- $940 · $78/mo
- Expected delta
- +$180/yr (+$15/mo · 23.7%)
ⓘ Screening estimate from a state-policy table — verify with the county assessor before closing.
Climate risk First Street
- Flood 1/10 Low FEMA zone X (unshaded) · 0% chance over 30 yrs
- Wildfire 3/10 Moderate
- Heat 6/10 Major 7 d/yr ≥109°F today · 21 d/yr by 30 yrs out
- Wind 4/10 Moderate 18% chance of damaging wind over 30 yrs
- Air quality 2/10 Low 2 unhealthy d/yr today · 2 by 30 yrs out
Nearby sold comps map
Loading sold comps map…
Walkable amenities ~0.75 mi
Loading nearby amenities…
Taxation est. · year 1
- Rental income
- $18,850
- − Mortgage interest
- −$6,666
- − Property taxes
- −$760
- − Insurance
- −$595
- − Repairs & maintenance
- −$1,508
- − Management
- −$1,508
- − Depreciation
- −$3,462
- Taxable income
- $4,352
- Est. tax owed @ 24.0%
- −$1,044
- After-tax cash flow
- $5,004/yr
For passive investors: Depreciation is non-cash, so a rental often shows a tax loss while cash-flowing — sheltering income. Rental losses are passive: they offset passive income freely, and up to $25,000/yr can offset ordinary (W-2) income if you actively participate and your MAGI is under $100k (phasing out to $0 by $150k); unused losses carry forward. On sale, claimed depreciation is recaptured at up to 25%, and gains may owe capital-gains tax (a 1031 exchange can defer both). Figures are a year-1 estimate at your 24.0% rate — not tax advice; consult a CPA.
Schools (NCES district)
- District
- Desoto County School District
- NCES district ID
- 2801320
- Math proficiency
- 48% ▼ -13.00%
- Reading proficiency
- 42% ▼ -6.00%
- Median HH income
- $59,272
- Composite
- 39.56/100
- National rank
- #3933
- State rank
- #20 of 130 in MS
Livability — Southaven
- Score
- 65/100
- State rank
- #107
- US rank
- #12584
Category grades
Schools grade is shown separately in the Schools card above.
Census & demographics
- Census place
- Southaven, MS
- County
- DeSoto County · 176,513 people
- City population
- 53,755
- Metro
- Memphis, TN-MS-AR
- Population (ZIP)
- 37,319
- Household income
- $61,843
- Rent vs Own
- Severe rent burden
- 1583.0
Population outlook (DeSoto County) Hauer SSP2
- Today (2025)
- 203,338 people
- By 2030
- 217,692 · +7.1%
- By 2040
- 245,320 · +20.6%
- By 2050
- 270,133 · +32.8%
- By 2075
- 323,341 · +59.0%
- By 2100
- 348,742 · +71.5%
Race, ethnicity, and origin ACS 2023
- Neighborhood character
- Diverse neighborhood (Simpson 0.58)
- Race & ethnicity
- White 49% Black 42% Hispanic / Latino 6% Two or more races 4%
- Hispanic origin (detail)
- Mexican 3%
- Common ancestry
- Italian 1% Lithuanian 1% Serbian 1%
- Foreign-born
- 3% · Canada
- Languages at home
- 95% English-only · Spanish 4%
Political lean MEDSL · DeSoto
- 2024 margin
- Strong R (+24.1) · D 36.7% · R 60.8% · Other 2.5%
- 2008→2024 swing
- +14.2pp toward D · 2008: -38.2pp · 2024: -24.1pp
- All cycles
- 2024: R+24.1 2020: R+23.9 2016: R+34.8 2012: R+33.5 2008: R+38.2
Not yet ingested
- Civics
- —
Market trends
- HPI YoY
- ▼ -49.08%
- Current HPI
- 220.7875
- Rent YoY
- ▲ 3.20%
- Metro
- Memphis, TN-MS-AR
- State GDP YoY
- —
- F500 in state
- 0
Price history
+128.8% since first listed3 events — show timeline
- 2026-06-13 Listed $119,000 MLSU
- 2012-01-03 Listing Removed — MLSU
- 2011-10-04 Listed $52,000 MLSU
Property tax history
+1.6%/yrLatest (2025): $760 · +8.6% YoY. Source: county tax records.
Cash-flow waterfall
monthlySold comps — $/sqft
last 12 mo · ≤1 miLoading sold comps…