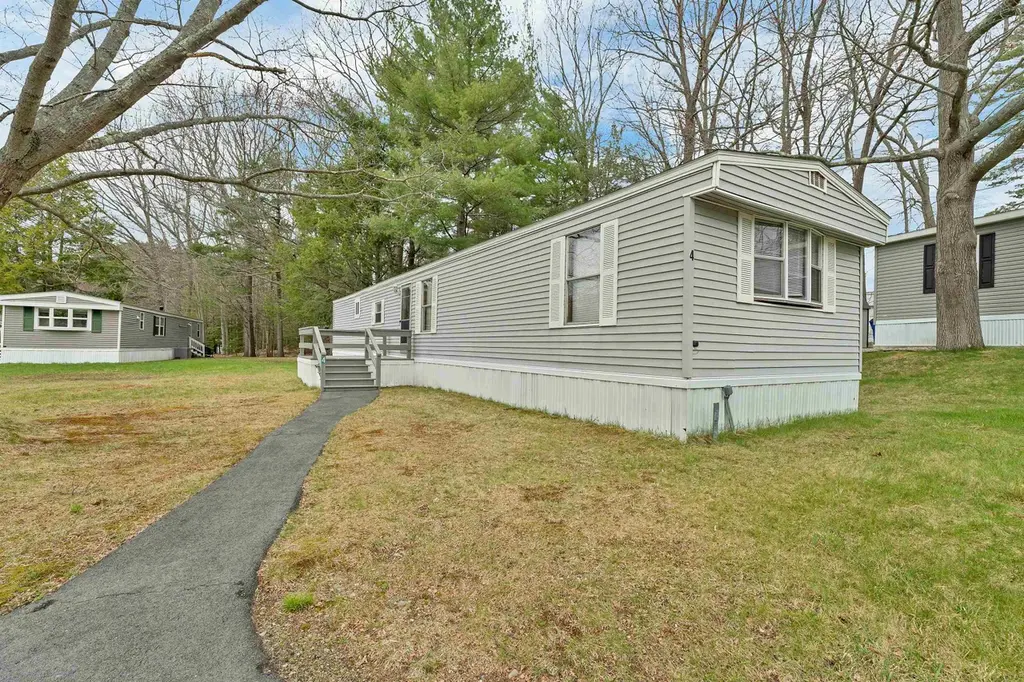
4 Slate Run · Portsmouth, NH
Flood risk No data
- FEMA flood zone
- —
- Chance of flooding over 30 yrs
- —
- Est. flood insurance / yr
- —
Fire risk No data
- Est. fire insurance / yr
- —
Heat risk No data
- Hot days now (above threshold)
- —
- Hot days in 30 yrs
- —
Wind risk No data
- Chance of severe wind over 30 yrs
- —
Air-quality risk No data
- Unhealthy air days now
- —
- Unhealthy air days in 30 yrs
- —
Risk factors via First Street. Map © Google.
Why this score? — see what drove the A- grade
The composite is a weighted blend of 9 inputs, each scored 0–100. Each bar is that input's sub-score; the figure is the points it added to the 100-point composite (weight × sub-score).
- Cash flow +30.0/30.0
- ARV discount +15.0/15.0
- 1% rule +10.0/10.0
- DSCR +10.0/10.0
- Schools +6.7/10.0
- Livability +4.3/5.0
- Rent growth +2.5/5.0
- Condition / age +2.5/5.0
- Appreciation +0.0/10.0
$149,000
🖨 Deal sheet 📄 Offer letter ✓ Due diligence
Listing remarks
Welcome to easy, coastal-inspired living in the highly desirable Granite Post Green community. Just minutes from the beaches, shopping, and everything that makes North Hampton one of the Seacoast’s most loved towns. Set on a quiet, paved street in a well-maintained neighborhood, this 2-bedroom home offers a simple, comfortable layout designed for low-maintenance living and everyday ease. With approximately 938 square feet of living space, the home features a bright main living area that flows into the kitchen, creating a functional space to relax, gather, or entertain. Recent updates add both value and peace of mind, including updated walkway and driveway pavement, updated flooring, r
Key facts
- Quiet paved street
- Updated flooring
- Built 1983
Tags
Property features AI
Finance
- Other: Mobile make: Titan; Mobile serial number: 19-3-879654
- HOA & community: Located in a mobile home park (Granite Post Green) — park approved
Exterior
- Parking: Paved driveway
- Utilities: Public water; Community sewer / Leach field / Septic; 100 Amp electrical service with circuit breakers; High-speed internet available; Cable available; Telephone available
- Home design: Manufactured / Mobile home; Existing construction; Built in 1983
- Construction: Vinyl siding; Asphalt shingle roof
- Exterior features: Landscaped lot; Paved driveway; Located in a mobile home park (Granite Post Green) with park approval
Interior
- Kitchen: Range - Gas; Exhaust hood; Refrigerator; Dishwasher not listed
- Bedrooms: Information not provided
- Bathrooms: 2 full bathrooms
- Heating & cooling: Forced air heat
- Interior features: 4 total rooms
- Laundry & utility: Washer; Dryer
Neighborhood map
What this means for you Summary
Snapshot
- This is a 2-bed/1.0-bath manufactured listed at $149k.
Deal economics
- At list price, monthly cash flow is $2k ($18k/yr) — positive.
- The deal already cash-flows at list — no discount required.
- Meets the 1% rule at list price ($3k rent vs $149k).
- Recommended offer: $145k (3.0% below list) — sets the bar for market timing.
- Cap rate 18.5% vs local median 1.9% in Portsmouth — top-decile yield for the area; either an underpriced asset or a hidden risk that comps aren't pricing in. Stress-test before assuming the spread holds.
Location & tenants
- Location reads 86/100 on livability (#5 in NH, #354 nationally) — a professional / high-income tenant draw. Strengths: schools A+, commute A+, employment A+; Watch: cost of living F.
- North Hampton School District (rural): math 66% / reading 82% proficiency, ranked #14 of 171 in NH (top 8%) — strong family-tenant draw, lease renewals of 3-5y typical; only 7% free/reduced lunch — higher-income household profile.
- Market conditions: 28 active listings in the ZIP; 1,276 units permitted in Rockingham County in 2024 (593 in 5+ unit buildings).
Forward outlook
- Local home prices are declining (-3.0%/yr); year-one equity from $1k of loan paydown is wiped out by about $4k of value loss. Plan a longer hold.
- At projected returns (-3.0% appreciation + 3.0% rent growth), your $42k cash investment doubles in ~3 years — after that, you're playing with house money.
Negotiation context
- It's been on market 31 days — a 3% lower offer ($145k) is reasonable based on typical stale-listing flexibility.
Questions for the listing agent
- It's been on market 31 days. Have you received any prior offers? Is the seller open to a 3% concession, seller financing, or rate buy-down credit?
- Is there a deadline driving the sale (1031 exchange, divorce, estate, relocation)? That informs how much negotiation room exists.
- Schools are A-rated — typically a magnet for longer-tenancy family renters. What's the average tenant stay here, and is there a school-zone premium baked into asking?
- What's the average days-on-market for RENTAL listings here right now (not sales)? A rising rental-DOM trend means longer vacancies and softer asking-rent achievability than the comps imply.
- What's the recent tenant-quality profile in this submarket — average credit score on applications, eviction rate, late-payment / NSF rate, and stable-employment percentage? A property-management company in the area should have these aggregated.
- How much new for-sale + rental construction is in the pipeline within 1–3 miles? Heavy new supply typically softens prices + rents 12–24 months out; constrained supply supports both.
Investment metrics
- 1% rule
- 2.13% ✓
- Cap rate
- 18.50%
- Cash-on-cash
- 43.59%
- DSCR
- 2.94
- GRM
- 3.9
CMA / ARV
- ARV (on-the-fly)
- $189,476
- Comps found
- 11
Show comp detail 11 sales within ~0.75 mi
| Address | Dist | Beds/Ba | Sqft | Sold | Price | $/sf | Match |
|---|---|---|---|---|---|---|---|
| 43 Granite Dr | 0.13mi | 2/1.0 | 924 (-2%) | 17mo | $150,000 | $162 | 78 |
| 7 Granite Dr | 0.13mi | 2/1.5 | 1,019 (+9%) | 2mo | $177,000 | $174 | 76 |
| 6 Granite Dr | 0.20mi | 2/2.0 | 924 (-2%) | 12mo | $289,000 | $313 | 74 |
| 1 Apricot Way | 0.41mi | 2/2.0 | 924 (-2%) | 6mo | $135,000 | $146 | 69 |
| 10 Black Forest Rd | 0.38mi | 2/2.0 | 920 (-2%) | 8mo | $295,000 | $321 | 68 |
| 10 Lilac Way | 0.33mi | 2/2.0 | 924 (-2%) | 13mo | $205,000 | $222 | 67 |
| 39 Granite Dr | 0.07mi | 2/2.0 | 896 (-4%) | 23mo | $144,900 | $162 | 66 |
| 20 Black Forest Rd | 0.38mi | 2/2.0 | 906 (-3%) | 18mo | $170,000 | $188 | 58 |
| 31 Hickory Ave | 0.46mi | 2/2.0 | 924 (-2%) | 19mo | $269,000 | $291 | 56 |
| 56 Oak Dr | 0.33mi | 3/2.0 (+1) | 1,064 (+13%) | 11mo | $219,000 | $206 | 44 |
| 39 Hickory Ave | 0.45mi | 3/2.0 (+1) | 1,064 (+13%) | 19mo | $215,000 | $202 | 31 |
Match score weights: distance 35% · size 25% · config 20% · recency 20%. Top-matched comps best support the ARV.
Projected returns pro-forma
-3.0% appreciation · 3.0% rent growth · sell at horizon
- IRR
- 40.5%
- Equity multiple
- 2.74×
- Total profit
- $72,392
- Equity at exit
- $22,216
- IRR
- 46.8%
- Equity multiple
- 5.49×
- Total profit
- $187,405
- Equity at exit
- $12,883
Cash invested: $41,720 (down + closing). Projections, not guarantees.
Landlord ↔ Tenant lean methodology
- Overall (STATE)
- 56 Moderately Landlord-Leaning
- State New Hampshire
- 56 Moderately Landlord-Leaning · D+1
- County
- — inherits STATE
- City
- — inherits STATE
ZIP-level market 03862
- Home prices YoY
- -17.5%
- Active inventory
- 28
- Price-to-rent
- 3.9×
Monthly cashflow live
- Estimated rent
- $3,168 medium interval (Pro) →
- Mortgage (P&I)
- −$781
- Tax from tax record
- −$144 /mo · $1,726/yr
- Insurance
- −$62
- HOA
- −$0
- Vacancy / Maint / Mgmt
- −$665
- Net cashflow
- $1,515
Break-even live
UW: 25.0% down · 7.5% · 30yr · 1.5% tax · 5.0% vac · 8.0% maint · 8.0% mgmt
Financing live
Cash to close
- Down payment
- $37,250
- Closing costs
- $4,470
- Reserves months
- —
- Total cash needed
- —
Loan-product check · same deal, 3 products live
Conventional
25% down · 7.5% · 30yr
- Down + closing
- —
- Monthly P&I
- —
- Monthly cashflow
- —
- DSCR
- —
- Eligible?
- —
Personal DTI + credit; lowest rate.
DSCR
20% down · 8.5% · 30yr
- Down + closing
- —
- Monthly P&I
- —
- Monthly cashflow
- —
- DSCR
- —
- Eligible?
- —
No personal income docs; deal must DSCR.
Hard money
10% down · 12.0% · 12mo
- Down + closing
- —
- Monthly P&I
- —
- Monthly cashflow
- —
- DSCR
- —
- Eligible?
- —
Short-term bridge; refi at stabilization.
Listing history 5 events
-
2026-05-18status Pending
-
2026-04-17$149,000 Active
-
2025-09-15price $159,900
-
2025-07-04price $179,900
-
2023-08-25price $224,900
ⓘ Source: listings_history table (triggers on properties + properties_extension) + one-shot
backfill from property_details.listing_events for pre-trigger history.
Tax reassessment forecast NH · Partial reset (capped growth)
- Current annual tax
- $1,726 · $144/mo
- Projected year-2 tax
- $2,487 · $207/mo
- Expected delta
- +$761/yr (+$63/mo · 44.1%)
ⓘ Screening estimate from a state-policy table — verify with the county assessor before closing.
Nearby sold comps map
Loading sold comps map…
Walkable amenities ~0.75 mi
Loading nearby amenities…
Taxation est. · year 1
- Rental income
- $38,015
- − Mortgage interest
- −$8,346
- − Property taxes
- −$1,726
- − Insurance
- −$745
- − Repairs & maintenance
- −$3,041
- − Management
- −$3,041
- − Depreciation
- −$4,335
- Taxable income
- $16,781
- Est. tax owed @ 24.0%
- −$4,027
- After-tax cash flow
- $14,157/yr
For passive investors: Depreciation is non-cash, so a rental often shows a tax loss while cash-flowing — sheltering income. Rental losses are passive: they offset passive income freely, and up to $25,000/yr can offset ordinary (W-2) income if you actively participate and your MAGI is under $100k (phasing out to $0 by $150k); unused losses carry forward. On sale, claimed depreciation is recaptured at up to 25%, and gains may owe capital-gains tax (a 1031 exchange can defer both). Figures are a year-1 estimate at your 24.0% rate — not tax advice; consult a CPA.
Schools (NCES district)
- District
- North Hampton School District
- NCES district ID
- 3305370
- Math proficiency
- 66% ▲ 1.00%
- Reading proficiency
- 82% ▲ 3.00%
- Median HH income
- $83,171
- Composite
- 66.85/100
- National rank
- #883
- State rank
- #14 of 171 in NH
Livability — Portsmouth
- Score
- 86/100
- State rank
- #5
- US rank
- #354
Category grades
Schools grade is shown separately in the Schools card above.
Census & demographics
- City population
- 23,484
- Population (ZIP)
- 4,563
Population outlook (Rockingham County) Hauer SSP2
- Today (2025)
- 316,118 people
- By 2030
- 320,929 · +1.5%
- By 2040
- 323,358 · +2.3%
- By 2050
- 314,977 · -0.4%
- By 2075
- 297,686 · -5.8%
- By 2100
- 256,363 · -18.9%
Race, ethnicity, and origin ACS 2023
- Neighborhood character
- Predominantly White (88%)
- Race & ethnicity
- White 88% Hispanic / Latino 4% Asian 4% Two or more races 3%
- Common ancestry
- Lithuanian 8% Scotch-Irish 4% Slovak 4%
- Foreign-born
- 5% · China, Canada
- Languages at home
- 88% English-only · Spanish 6% Chinese 3% Other Indo-European 1%
Political lean MEDSL · Rockingham
- 2024 margin
- Toss-up / Even · D 48.3% · R 50.8%
- 2008→2024 swing
- -3.5pp toward R · 2008: 1.1pp · 2024: -2.4pp
- All cycles
- 2024: R+2.4 2020: D+2.1 2016: R+5.8 2012: R+4.5 2008: D+1.1
Not yet ingested
- Civics
- —
Market trends
- HPI YoY
- ▼ -81.37%
- Current HPI
- 384.1561
- Rent YoY
- —
- Metro
- —
- State GDP YoY
- —
- F500 in state
- 0
Price history
-33.7% since first listed5 events — show timeline
- 2026-05-18 Pending — PrimeMLS
- 2026-04-17 Listed $149,000 PrimeMLS
- 2025-09-15 Price Changed $159,900 PrimeMLS
- 2025-07-04 Price Changed $179,900 PrimeMLS
- 2023-08-25 Price Changed $224,900 PrimeMLS
Property tax history
+12.7%/yrLatest (2025): $1,726 · +5.1% YoY. Source: county tax records.
Cash-flow waterfall
monthlySold comps — $/sqft
last 12 mo · ≤1 miLoading sold comps…