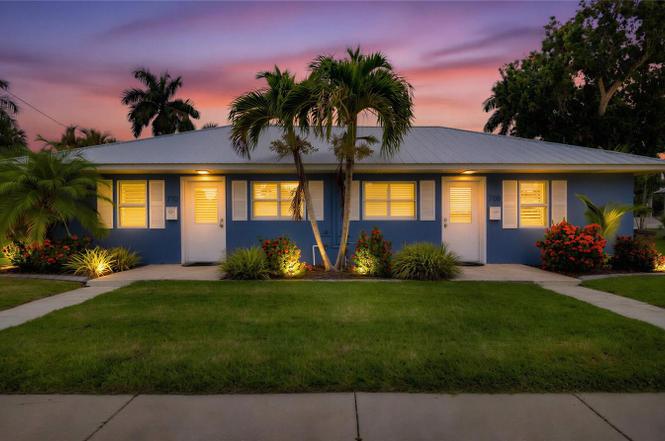
 Duplex
708 W Olympia Ave · Punta Gorda, FL
Flood risk 10/10 · Severe
- FEMA flood zone
- AE
- Chance of flooding over 30 yrs
- 0.99%
- Est. flood insurance / yr
- $1,737 – $8,500
Fire risk 1/10 · Minimal
- Est. fire insurance / yr
- $947 – $1,759
Heat risk 10/10 · Severe
- Hot days now (above 107°F)
- 7 days/yr
- Hot days in 30 yrs
- 28 days/yr
Wind risk 10/10 · Severe
- Chance of severe wind over 30 yrs
- 99.0%
Air-quality risk 3/10 · Minor
- Unhealthy air days now
- 2 days/yr
- Unhealthy air days in 30 yrs
- 2 days/yr
Risk factors via First Street. Map © Google.
Why this score? — see what drove the D grade
The composite is a weighted blend of 9 inputs, each scored 0–100. Each bar is that input's sub-score; the figure is the points it added to the 100-point composite (weight × sub-score).
- Cash flow +15.4/30.0
- ARV discount +7.5/15.0
- DSCR +4.7/10.0
- Schools +4.6/10.0
- 1% rule +3.9/10.0
- Livability +3.8/5.0
- Rent growth +2.5/5.0
- Condition / age +2.5/5.0
- Appreciation +0.0/10.0
$299,000
🖨 Deal sheet (PDF) 📄 Offer letter ✓ Due diligence
Multi-family units
County records classify this as Multi-Family (2-4 Unit). Listing-text estimate: 2 units. confirmed
Listing remarks MLS
Great Location, location, location Duplex in Historical District downtown Punta Gorda. Only a few blocks away from the river and parks. Short distance to restaurants, shopping, entertainment and more downtown. Perfect for a investment with more income potential.
Key facts
- 5,978 sq ft lot
- Built 1947
- Listed 6 days
Property features AI
Finance
- Other: Pets allowed
- Financial info: Annual net income reported (multi-family): $40,000; No lease restrictions reported
- HOA & community: No association
Exterior
- Utilities: Public water; Public sewer; Broadband/high-speed internet available; Cable available and connected; Phone available; Water connected; Sewer connected; Sprinkler meter
- Home design: Residential income property — duplex; One building
- Construction: Stucco construction; Metal roof; Slab foundation; Built area approximately 1,152 (owner reported)
- Exterior features: Private mailbox; Sidewalk; Sprinkler meter; Irrigation equipment
Interior
- Kitchen: Convection oven; Ice maker; Microwave; Range hood; Refrigerator
- Bedrooms: Two total bedrooms; Each unit is a 1-bedroom unit (duplex with two 1-bedroom units)
- Bathrooms: Two total bathrooms (one per unit)
- Heating & cooling: Central heating (electric); Central air conditioning
- Interior features: Ceiling fans; Living room/dining room combo; Thermostat; Window treatments
- Laundry & utility: Washer; Dryer; Electric dryer hookup; Laundry located inside; Electric water heater
Neighborhood map
What this means for you Summary
Snapshot
- This is a 2 × 1-bed/1.0-bath units multifamily listed at $299k.
Deal economics
- At list price, monthly cash flow is $-312 ($-4k/yr) — negative. Per door: $-156/mo.
- To cash-flow at today's rent, offer at most $244k (18.5% below list).
- To meet the 1% rule (rent ≥ 1% of price), the offer needs to be $265k (11.3% below list).
- Recommended offer: $244k (18.5% below list) — sets the bar for cash-flow.
- Cap rate 6.8% vs local median 2.8% in Punta Gorda — top-decile yield for the area; either an underpriced asset or a hidden risk that comps aren't pricing in. Stress-test before assuming the spread holds.
Location & tenants
- Location reads 76/100 on livability (#225 in FL, #3,567 nationally) — a middle-class / working-renter tenant base. Strengths: crime A+, health & safety A+, housing B; Watch: cost of living D+, amenities D-, commute F.
- Charlotte (suburban): math 54% / reading 54% proficiency, ranked #22 of 73 in FL (top 30%) — acceptable for families but not a draw, mixed tenant base, ~2y average lease.
- Zoned schools: Sallie Jones Elementary School (math 75% / reading 74%, grade A, #230 of 2,144 statewide, top 12%, 694 students, 47% FRL); Punta Gorda Middle School (math 54% / reading 52%, grade C+, #209 of 571 statewide, top 37%, 1,120 students, 41% FRL); Charlotte High School (math 44% / reading 46%, grade D-, #228 of 667 statewide, top 35%, 1,994 students, 41% FRL).
- Market conditions: Rents soft (-0.1%/yr); 1004 active listings in the ZIP; 8 comparable units currently listed for rent nearby; rentals at typical pace (median 23d on market — plan ~3-4 weeks tenant-placement turnaround); solid renter incomes; 4,585 units permitted in Charlotte County in 2024 (703 in 5+ unit buildings).
- This rent runs 42% of the median local income ($76k/yr) — at the standard rent-burdened threshold; future hikes will face affordability resistance.
Forward outlook
- Local home prices are declining (-3.0%/yr); year-one equity from $2k of loan paydown is wiped out by about $9k of value loss. Plan a longer hold.
- Charlotte County population projected at +24% by 2050 — long-run rental-demand tailwind backs the buy-and-hold thesis.
Negotiation context
- Only 6 days on market — expect competitive offers; lowballing is unlikely to land.
- 8 sale attempts since 10y ago; this cycle's ask is 15% above the opening price — seller raised mid-cycle; expect resistance to lowballs.
- Current owner paid $250k; 20% above their basis — modest negotiation headroom, anchor on the comps not their cost.
Risks & watch-outs
- Watch-outs: flood insurance adds $427/mo; built in 1947 — expect roof / HVAC / electrical / plumbing capex.
- Climate carrying-cost: in FEMA flood zone AE (mandatory federal flood insurance); severe wind risk, 99% chance of damaging wind over 30y; extreme-heat days projected 7→28/yr by 2055 (HVAC capex compounding) — expect insurance premiums to compound above CPI over the hold.
Questions for the listing agent
- What do current leases actually rent for vs. the listed asking? Can we see a recent rent roll and the last 12 months of T-12 income?
- Can we see the unit-by-unit rent roll, current vacancy, and any below-market leases? What's the average tenancy length?
- What capital expenditures (roof, boiler, parking lot, exteriors) have been made in the last 5 years, and what's planned in the next 2?
- Built in 1947 — when were the roof, HVAC, electrical panel, plumbing, and water heater last replaced?
- What's the actual annual flood-insurance premium (NFIP or private), and is the property in a SFHA with mandatory coverage?
- Is there a deadline driving the sale (1031 exchange, divorce, estate, relocation)? That informs how much negotiation room exists.
- Schools are A-rated — typically a magnet for longer-tenancy family renters. What's the average tenant stay here, and is there a school-zone premium baked into asking?
- The area grade is low — what's the realistic commute time and amenity access for the typical tenant pool here? Any planned neighborhood developments (good or bad) we should know about?
- What's the average days-on-market for RENTAL listings here right now (not sales)? A rising rental-DOM trend means longer vacancies and softer asking-rent achievability than the comps imply.
- What's the recent tenant-quality profile in this submarket — average credit score on applications, eviction rate, late-payment / NSF rate, and stable-employment percentage? A property-management company in the area should have these aggregated.
- How much new apartment / multifamily construction is in the pipeline within 1–3 miles? Heavy new supply (>2% of stock underway) typically softens rents 12–24 months out; light construction supports rent growth.
Investment metrics
- 1% rule
- 0.89% ✗
- Cap rate
- 6.75%
- Cash-on-cash
- 1.64%
- DSCR
- 1.07
- GRM
- 9.4
CMA / ARV
No comps found within radius.
Projected returns pro-forma
-3.0% appreciation · 0.0% rent growth · sell at horizon
- IRR
- -27.8%
- Equity multiple
- 0.09×
- Total profit
- $-75,862
- Equity at exit
- $44,582
- IRR
- -47.4%
- Equity multiple
- -0.44×
- Total profit
- $-120,685
- Equity at exit
- $25,852
Cash invested: $83,720 (down + closing). Projections, not guarantees.
Landlord ↔ Tenant lean methodology
- Overall (STATE)
- 87 Strongly Landlord-Friendly
- State Florida
- 87 Strongly Landlord-Friendly · R+3
- County
- — inherits STATE
- City
- — inherits STATE
ZIP-level market 33950
- Home prices YoY
- -29.9%
- Rents YoY
- -0.1%
- Active inventory
- 1004
- Price-to-rent
- 18.8×
Monthly cashflow live
- Estimated rent
- $2,651 high interval (Pro) →
- Mortgage (P&I)
- −$1,568
- Tax from tax record
- −$287 /mo · $3,450/yr
- Insurance
- −$125
- Flood insurance flood zone
- −$427 /mo · $5,118/yr
- HOA
- −$0
- Vacancy / Maint / Mgmt
- −$557
- Net cashflow
- $-312
Break-even live
Sensitivity live
| Price | -10% $-143 | -5% $-228 | +0% $-312 | +5% $-397 | +10% $-482 |
|---|---|---|---|---|---|
| Rent | -10% $-522 | -5% $-417 | +0% $-312 | +5% $-208 | +10% $-103 |
| Rate | -1.0pp $-162 | -0.5pp $-236 | base $-312 | +0.5pp $-390 | +1.0pp $-469 |
2-unit breakdown (identical units grouped — click to expand)
| Units | Beds | Baths | Est. rent |
|---|---|---|---|
| 2× units | 1 | 1 | $2,652 |
| #1 | 1 | 1 | $1,326 |
| #2 | 1 | 1 | $1,326 |
| Total (2 units) | $2,651 | ||
UW: 25.0% down · 7.5% · 30yr · 1.5% tax · 5.0% vac · 8.0% maint · 8.0% mgmt
Financing live
Cash to close
- Down payment
- $74,750
- Closing costs
- $8,970
- Reserves months
- —
- Total cash needed
- —
Loan-product check · same deal, 3 products live
Conventional
25% down · 7.5% · 30yr
- Down + closing
- —
- Monthly P&I
- —
- Monthly cashflow
- —
- DSCR
- —
- Eligible?
- —
Personal DTI + credit; lowest rate.
DSCR
20% down · 8.5% · 30yr
- Down + closing
- —
- Monthly P&I
- —
- Monthly cashflow
- —
- DSCR
- —
- Eligible?
- —
No personal income docs; deal must DSCR.
Hard money
10% down · 12.0% · 12mo
- Down + closing
- —
- Monthly P&I
- —
- Monthly cashflow
- —
- DSCR
- —
- Eligible?
- —
Short-term bridge; refi at stabilization.
Rent comps 8 comps
| Address | Beds | Baths | Sqft | Rent | $/sqft | DOM | Units | Dist |
|---|---|---|---|---|---|---|---|---|
| 927 W Olympia Ave Punta Gorda, FL | 3.0 | 1.0 | 912 | $1,750 | $1.92 | 15d | 1 | 0.26mi |
| 309 E Virginia Ave Punta Gorda, FL | 3.0 | 3.5 | 1344 | $3,000 | $2.23 | 23d | 1 | 0.78mi |
| 1477 Park Beach Cir Punta Gorda, FL | 2.0–3.0 | 2.0–3.0 | 1767 | $4,750 | $2.69 | 15d | 2 | 0.79mi |
| 1500 Park Beach Cir Punta Gorda, FL | 2.0–4.0 | 2.0 | 1494 | $5,500 | $3.68 | 15d | 2 | 0.82mi |
| 215 Lewis Cir #111 Punta Gorda, FL | 3.0 | 2.0 | 1377 | $4,500 | $3.27 | 23d | 1 | 0.84mi |
| 219 Lewis Cir #112 Punta Gorda, FL | 3.0 | 2.0 | 1377 | $4,500 | $3.27 | 23d | 1 | 0.85mi |
| 255 W End Dr Punta Gorda, FL | 2.0–3.0 | 2.0 | 1559 | $3,500 | $2.24 | 23d | 3 | 0.87mi |
| 2926 Vasco St Unit 112 Punta Gorda, FL | 3.0 | 2.0 | 1329 | $2,250 | $1.69 | 23d | 1 | 1.35mi |
Listing history 28 events
-
2026-06-22days on market $299,000 Active 6 DOM
-
2026-06-18days on market $299,000 Active 3 DOM
-
2026-06-17days on market $299,000 Active 2 DOM
-
2026-06-15pricestatusdays on market $299,000 Active 1 DOM
-
2026-05-03status Pending
-
2026-04-26price $239,000
-
2026-04-25status Active
-
2026-04-17status Pending
-
2025-11-20$259,000 Active
-
2021-03-26soldstatus $249,900
-
2021-03-24soldstatus $249,900 Closed 263-char remark
Show marketing remark (255 chars)
Great location, location, location. Duplex in Historical Downtown Punta Gorda. Only a few blocks away from the river and parks. Short distance to restaurants, shopping, entertainment and more downtown. Perfect for an investment with more income potential.
-
2021-03-24soldstatus $249,900 Closed 255-char remark
Show marketing remark (255 chars)
Great location, location, location. Duplex in Historical Downtown Punta Gorda. Only a few blocks away from the river and parks. Short distance to restaurants, shopping, entertainment and more downtown. Perfect for an investment with more income potential.
-
2021-03-10status Pending 263-char remark
Show marketing remark (255 chars)
Great location, location, location. Duplex in Historical Downtown Punta Gorda. Only a few blocks away from the river and parks. Short distance to restaurants, shopping, entertainment and more downtown. Perfect for an investment with more income potential.
-
2021-03-10status Pending 255-char remark
Show marketing remark (255 chars)
Great location, location, location. Duplex in Historical Downtown Punta Gorda. Only a few blocks away from the river and parks. Short distance to restaurants, shopping, entertainment and more downtown. Perfect for an investment with more income potential.
-
2021-03-08$249,900 Active 255-char remark
Show marketing remark (255 chars)
Great location, location, location. Duplex in Historical Downtown Punta Gorda. Only a few blocks away from the river and parks. Short distance to restaurants, shopping, entertainment and more downtown. Perfect for an investment with more income potential.
-
2021-03-05$249,900 Active 263-char remark
Show marketing remark (263 chars)
Great Location, location, location Duplex in Historical District downtown Punta Gorda. Only a few blocks away from the river and parks. Short distance to restaurants, shopping, entertainment and more downtown. Perfect for a investment with more income potential.
-
2018-05-26status Pending
-
2018-05-25historical
-
2018-02-15price $229,900
-
2018-01-29$236,900 Active
-
2017-02-15historical
-
2016-12-07price $244,900
-
2016-12-05$250,000 Active
-
2016-11-30historical
-
2016-11-16historical
-
2016-06-03$250,000 Active
-
2016-05-16$250,000 Active
-
1990-06-01soldstatus $45,000
ⓘ Source: listings_history table (triggers on properties + properties_extension) + one-shot
backfill from property_details.listing_events for pre-trigger history.
Tax reassessment forecast FL · Resets to sale price
- Current annual tax
- $3,450 · $287/mo
- Projected year-2 tax
- $3,450 · $287/mo
- Expected delta
- $0/yr ($0/mo · 0.0%)
ⓘ Screening estimate from a state-policy table — verify with the county assessor before closing.
Climate risk First Street
- Flood 10/10 Extreme FEMA zone AE · 99% chance over 30 yrs
- Wildfire 1/10 Low
- Heat 10/10 Extreme 7 d/yr ≥107°F today · 28 d/yr by 30 yrs out
- Wind 10/10 Extreme 99% chance of damaging wind over 30 yrs
- Air quality 3/10 Moderate 2 unhealthy d/yr today · 2 by 30 yrs out
Nearby sold comps map
Loading sold comps map…
Walkable amenities ~0.75 mi
Loading nearby amenities…
Taxation est. · year 1
- Rental income
- $31,812
- − Mortgage interest
- −$16,749
- − Property taxes
- −$3,450
- − Insurance
- −$6,614
- − Repairs & maintenance
- −$2,545
- − Management
- −$2,545
- − Depreciation
- −$8,698
- Taxable loss
- −$8,788
- Est. tax savings @ 24.0%
- +$2,109
- After-tax cash flow
- $-1,639/yr
For passive investors: Depreciation is non-cash, so a rental often shows a tax loss while cash-flowing — sheltering income. Rental losses are passive: they offset passive income freely, and up to $25,000/yr can offset ordinary (W-2) income if you actively participate and your MAGI is under $100k (phasing out to $0 by $150k); unused losses carry forward. On sale, claimed depreciation is recaptured at up to 25%, and gains may owe capital-gains tax (a 1031 exchange can defer both). Figures are a year-1 estimate at your 24.0% rate — not tax advice; consult a CPA.
Schools (NCES district)
- District
- Charlotte
- NCES district ID
- 1200240
- Math proficiency
- 54% ▼ -6.00%
- Reading proficiency
- 54% ▼ -1.00%
- Median HH income
- $44,864
- Composite
- 45.62/100
- National rank
- #2586
- State rank
- #22 of 73 in FL
Livability — Punta Gorda
- Score
- 76/100
- State rank
- #225
- US rank
- #3567
Category grades
Schools grade is shown separately in the Schools card above.
Census & demographics
- Census place
- Punta Gorda, FL
- County
- Charlotte County · 196,994 people
- City population
- 68,831
- Metro
- Punta Gorda, FL
- Population (ZIP)
- 24,955
- Household income
- $76,369
- Rent vs Own
- Severe rent burden
- 608.0
Population outlook (Charlotte County) Hauer SSP2
- Today (2025)
- 198,646 people
- By 2030
- 210,507 · +6.0%
- By 2040
- 230,857 · +16.2%
- By 2050
- 247,148 · +24.4%
- By 2075
- 281,777 · +41.8%
- By 2100
- 293,609 · +47.8%
Race, ethnicity, and origin ACS 2023
- Neighborhood character
- Predominantly White (86%)
- Race & ethnicity
- White 86% Two or more races 5% Black 5% Hispanic / Latino 4% Asian 1%
- Common ancestry
- Lithuanian 5% Romanian 4% Italian 2%
- Foreign-born
- 7% · Canada
- Languages at home
- 95% English-only · Spanish 3% Other Indo-European 1% German/W. Germanic 1%
Political lean MEDSL · Charlotte
- 2024 margin
- Solid R (+34.0) · D 32.7% · R 66.7%
- 2008→2024 swing
- -26.7pp toward R · 2008: -7.2pp · 2024: -34.0pp
- All cycles
- 2024: R+34.0 2020: R+26.6 2016: R+27.8 2012: R+14.3 2008: R+7.2
Not yet ingested
- Civics
- —
Market trends
- HPI YoY
- ▼ -111.73%
- Current HPI
- 261.6573
- Rent YoY
- ▼ -0.06%
- Metro
- Punta Gorda, FL
- State GDP YoY
- ▲ 3.28%
- F500 in state
- 36
Industry mix (Fortune 500 HQ in FL)
| Industry | F500 HQs | Revenue |
|---|---|---|
| Industrial Technology | 2 | $29B |
|
||
| Insurance | 2 | $17B |
|
||
| Retail | 1 | $60B |
|
||
| Technology Distribution | 1 | $58B |
|
||
| Homebuilding | 1 | $35B |
|
||
| Technology Manufacturing | 1 | $35B |
|
||
Price history
+431.1% since first listed24 events — show timeline
- 2026-05-03 Pending — Stellar MLS as Distributed by MLS Grid
- 2026-04-26 Price Changed $239,000 Stellar MLS as Distributed by MLS Grid
- 2026-04-25 Relisted — Stellar MLS as Distributed by MLS Grid
- 2026-04-17 Pending — Stellar MLS as Distributed by MLS Grid
- 2025-11-20 Listed $259,000 Stellar MLS as Distributed by MLS Grid
- 2021-03-26 Sold (Public Records) $249,900 Public Records
- 2021-03-24 Sold (MLS) $249,900 Stellar MLS as Distributed by MLS Grid
- 2021-03-24 Sold (MLS) $249,900 FORTMLS
- 2021-03-10 Pending — FORTMLS
- 2021-03-10 Pending — Stellar MLS as Distributed by MLS Grid
- 2021-03-08 Listed $249,900 Stellar MLS as Distributed by MLS Grid
- 2021-03-05 Listed $249,900 FORTMLS
- 2018-05-26 Pending — Stellar MLS as Distributed by MLS Grid
- 2018-05-25 Listing Removed — Stellar MLS as Distributed by MLS Grid
- 2018-02-15 Price Changed $229,900 Stellar MLS as Distributed by MLS Grid
- 2018-01-29 Listed $236,900 Stellar MLS as Distributed by MLS Grid
- 2017-02-15 Listing Removed — Stellar MLS as Distributed by MLS Grid
- 2016-12-07 Price Changed $244,900 Stellar MLS as Distributed by MLS Grid
- 2016-12-05 Listed $250,000 Stellar MLS as Distributed by MLS Grid
- 2016-11-30 Listing Removed — Stellar MLS as Distributed by MLS Grid
- 2016-11-16 Listing Removed — FORTMLS
- 2016-06-03 Listed $250,000 FORTMLS
- 2016-05-16 Listed $250,000 Stellar MLS as Distributed by MLS Grid
- 1990-06-01 Sold (Public Records) $45,000 Public Records
Property tax history
+11.9%/yrLatest (2025): $3,450 · +16.9% YoY. Source: county tax records.
Cash-flow waterfall
monthlySold comps — $/sqft
last 12 mo · ≤1 miLoading sold comps…