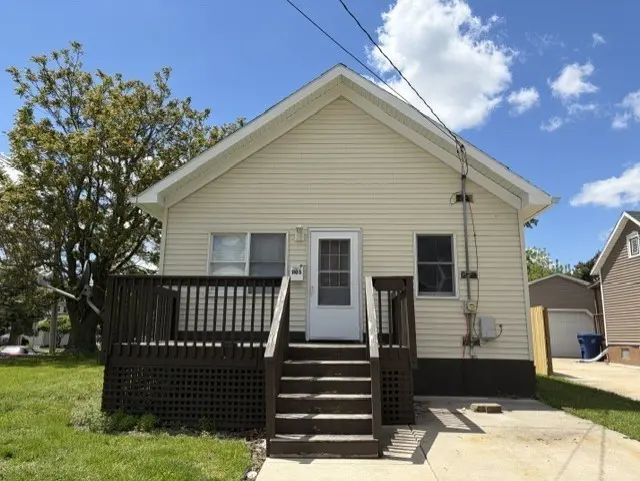
1105 Hennepin St · LaSalle, IL
Flood risk 1/10 · Minimal
- FEMA flood zone
- X (unshaded)
- Chance of flooding over 30 yrs
- 0.0%
- Est. flood insurance / yr
- $473 – $860
Fire risk 1/10 · Minimal
- Est. fire insurance / yr
- $804 – $1,492
Heat risk 3/10 · Minor
- Hot days now (above 104°F)
- 7 days/yr
- Hot days in 30 yrs
- 16 days/yr
Wind risk 2/10 · Minimal
- Chance of severe wind over 30 yrs
- 0.0%
Air-quality risk 2/10 · Minimal
- Unhealthy air days now
- 1 days/yr
- Unhealthy air days in 30 yrs
- 1 days/yr
Risk factors via First Street. Map © Google.
Why this score? — see what drove the D grade
The composite is a weighted blend of 9 inputs, each scored 0–100. Each bar is that input's sub-score; the figure is the points it added to the 100-point composite (weight × sub-score).
- Cash flow +14.9/30.0
- ARV discount +8.1/15.0
- 1% rule +5.5/10.0
- DSCR +4.6/10.0
- Livability +3.2/5.0
- Rent growth +2.5/5.0
- Condition / age +2.5/5.0
- Schools +1.7/10.0
- Appreciation +0.0/10.0
$97,900
🖨 Deal sheet (PDF) 📄 Offer letter ✓ Due diligence
Listing remarks MLS
Nice & neat! Great rental property or starter home. Features include maintenance free vinyl siding, 2 bedrooms, 1 bath, basement with outside entrance, eat-in kitchen & 2 decks in a nice location on a corner lot. Priced to sell!
Key facts
- Eat-in kitchen
- Corner lot
- 2 decks
Tags
Property features AI
Finance
- Other: School bus service available; Parcel number 1810415034
- HOA & community: No master association fee required; Community amenities nearby include park, pool, tennis courts, curbs, sidewalks, street lights, and paved streets
Exterior
- Parking: 1 parking space; Concrete driveway (owned)
- Utilities: Public water; Public sewer; Electric with circuit breakers
- Home design: Detached single-family; One-story; Fee simple ownership; Built more than 100 years ago; Property built before 1978
- Construction: Vinyl siding; Asphalt roof; Concrete perimeter foundation
- Exterior features: Deck; Corner lot; Lot dimensions approximately 54.67 x 60
Interior
- Kitchen: Eating area / table space; Vinyl flooring in the kitchen
- Bedrooms: 2 bedrooms (both on the main level)
- Flooring: Carpet in living areas and bedrooms; Vinyl flooring in kitchen
- Bathrooms: 1 full bathroom
- Heating & cooling: Natural gas forced air heating; Central air conditioning
- Interior features: 4 total rooms; Full, unfinished basement
- Laundry & utility: Main-level laundry
Neighborhood map
What this means for you Summary
Snapshot
- This is a 2-bed/1.0-bath single-family listed at $98k.
Deal economics
- At list price, monthly cash flow is $29 ($343/yr) — positive.
- The deal already cash-flows at list — no discount required.
- Meets the 1% rule at list price ($1k rent vs $98k).
- Recommended offer: $96k (1.5% below list) — sets the bar for market timing.
Location & tenants
- Location reads 64/100 on livability (#718 in IL) — a middle-class / working-renter tenant base. Strengths: crime A+, cost of living A+, housing A+; Watch: health & safety C-, employment D+, schools F.
- La Salle-Peru Twp Hsd 120 (town): math 15% / reading 26% proficiency, ranked #427 of 620 in IL (top 69%) — low school quality limits family demand, transient renter base, plan for 1-2y turnover.
- Market conditions: 68 active listings in the ZIP; 82 units permitted in LaSalle County in 2024 (0 in 5+ unit buildings).
Forward outlook
- Local home prices are declining (-3.0%/yr); year-one equity from $677 of loan paydown is wiped out by about $3k of value loss. Plan a longer hold.
- LaSalle County population projected at -16% by 2050 — secular population decline; favor cash flow + early exit over multi-decade hold.
Negotiation context
- It's been on market 29 days — a 2% lower offer ($96k) is reasonable based on typical stale-listing flexibility.
- 2 sale attempts; this cycle's ask has dropped $12k (11%) from the opening price — seller is motivated, your offer sets the floor, not the list.
- Current owner paid $40k; list at $98k implies a 145% gain — meaningful room to come down on a strong offer.
Risks & watch-outs
- Watch-outs: property tax is 2.8% of price; built in 1845 — expect roof / HVAC / electrical / plumbing capex.
Questions for the listing agent
- Built in 1845 — when were the roof, HVAC, electrical panel, plumbing, and water heater last replaced?
- Property tax is high relative to price — has the assessment been appealed recently, and will the sale trigger a re-assessment?
- Is there a deadline driving the sale (1031 exchange, divorce, estate, relocation)? That informs how much negotiation room exists.
- Schools are F-rated, which usually means shorter tenancies and higher turnover. Who's the typical renter profile here, and what's been the actual vacancy rate?
- The area grade is low — what's the realistic commute time and amenity access for the typical tenant pool here? Any planned neighborhood developments (good or bad) we should know about?
- What's the average days-on-market for RENTAL listings here right now (not sales)? A rising rental-DOM trend means longer vacancies and softer asking-rent achievability than the comps imply.
- What's the recent tenant-quality profile in this submarket — average credit score on applications, eviction rate, late-payment / NSF rate, and stable-employment percentage? A property-management company in the area should have these aggregated.
- How much new for-sale + rental construction is in the pipeline within 1–3 miles? Heavy new supply typically softens prices + rents 12–24 months out; constrained supply supports both.
Investment metrics
- 1% rule
- 1.05% ✓
- Cap rate
- 6.64%
- Cash-on-cash
- 1.25%
- DSCR
- 1.06
- GRM
- 7.9
CMA / ARV
- ARV (on-the-fly)
- $99,280
- Comps found
- 12
Show comp detail 12 sales within ~0.75 mi
| Address | Dist | Beds/Ba | Sqft | Sold | Price | $/sf | Match |
|---|---|---|---|---|---|---|---|
| 1140 7th St | 0.36mi | 2/1.0 | 712 (-2%) | 12mo | $102,500 | $144 | 69 |
| 444 6th St | 0.48mi | 2/1.0 | 704 (-4%) | 5mo | $96,000 | $136 | 68 |
| 1040 3rd St | 0.62mi | 2/1.0 | 722 (-1%) | 6mo | $57,000 | $79 | 64 |
| 844 Walnut Rd | 0.27mi | 2/1.0 | 812 (+11%) | 11mo | $130,000 | $160 | 60 |
| 336 4th St | 0.66mi | 2/1.0 | 741 (+2%) | 10mo | $64,000 | $86 | 58 |
| 336 4th St | 0.66mi | 2/1.0 | 741 (+2%) | 10mo | $64,000 | $86 | 58 |
| 2054 Crosat St | 0.70mi | 1/1.0 (-1) | 725 (-1%) | 5mo | $114,900 | $158 | 58 |
| 1216 Bucklin St | 0.35mi | 1/1.0 (-1) | 768 (+5%) | 22mo | $72,000 | $94 | 52 |
| 1379 Laharpe St | 0.31mi | 3/1.0 (+1) | 806 (+10%) | 16mo | $40,000 | $50 | 49 |
| 1750 Campbell Ave | 0.61mi | 2/1.0 | 750 (+3%) | 22mo | $128,500 | $171 | 49 |
| 561 Laharpe St | 0.44mi | 2/1.5 | 795 (+9%) | 18mo | $40,000 | $50 | 48 |
| 1781 Campbell Ave | 0.64mi | 2/1.0 | 768 (+5%) | 23mo | $135,000 | $176 | 42 |
Match score weights: distance 35% · size 25% · config 20% · recency 20%. Top-matched comps best support the ARV.
Projected returns pro-forma
-3.0% appreciation · 3.0% rent growth · sell at horizon
- IRR
- -14.2%
- Equity multiple
- 0.49×
- Total profit
- $-13,964
- Equity at exit
- $14,597
- IRR
- -5.3%
- Equity multiple
- 0.65×
- Total profit
- $-9,489
- Equity at exit
- $8,465
Cash invested: $27,412 (down + closing). Projections, not guarantees.
Landlord ↔ Tenant lean methodology
- Overall (STATE)
- 43 Moderately Tenant-Leaning
- State Illinois
- 43 Moderately Tenant-Leaning · D+7
- County
- — inherits STATE
- City
- — inherits STATE
ZIP-level market 61301
- Home prices YoY
- -24.3%
- Active inventory
- 68
- Price-to-rent
- 7.9×
Monthly cashflow live
- Estimated rent
- $1,027 medium interval (Pro) →
- Mortgage (P&I)
- −$513
- Tax from tax record
- −$228 /mo · $2,741/yr
- Insurance
- −$41
- HOA
- −$0
- Vacancy / Maint / Mgmt
- −$216
- Net cashflow
- $29
Break-even live
Sensitivity live
| Price | -10% $84 | -5% $56 | +0% $29 | +5% $1 | +10% $-27 |
|---|---|---|---|---|---|
| Rent | -10% $-53 | -5% $-12 | +0% $29 | +5% $69 | +10% $110 |
| Rate | -1.0pp $78 | -0.5pp $53 | base $29 | +0.5pp $3 | +1.0pp $-23 |
UW: 25.0% down · 7.5% · 30yr · 1.5% tax · 5.0% vac · 8.0% maint · 8.0% mgmt
Financing live
Cash to close
- Down payment
- $24,475
- Closing costs
- $2,937
- Reserves months
- —
- Total cash needed
- —
Loan-product check · same deal, 3 products live
Conventional
25% down · 7.5% · 30yr
- Down + closing
- —
- Monthly P&I
- —
- Monthly cashflow
- —
- DSCR
- —
- Eligible?
- —
Personal DTI + credit; lowest rate.
DSCR
20% down · 8.5% · 30yr
- Down + closing
- —
- Monthly P&I
- —
- Monthly cashflow
- —
- DSCR
- —
- Eligible?
- —
No personal income docs; deal must DSCR.
Hard money
10% down · 12.0% · 12mo
- Down + closing
- —
- Monthly P&I
- —
- Monthly cashflow
- —
- DSCR
- —
- Eligible?
- —
Short-term bridge; refi at stabilization.
Listing history 19 events
-
2026-06-19days on market $97,900 Active 29 DOM
-
2026-06-18price $97,900 Active 28 DOM
-
2026-06-18days on market $109,900 Active 28 DOM
-
2026-06-17days on market $109,900 Active 27 DOM
-
2026-06-16days on market $109,900 Active 26 DOM
-
2026-06-16days on market $109,900 Active 25 DOM
-
2026-06-15days on market $109,900 Active 32 DOM
-
2026-06-14days on market $109,900 Active 30 DOM
-
2026-06-12days on market $109,900 Active 29 DOM
-
2026-06-09days on market $109,900 Active 26 DOM
-
2026-06-08days on market $109,900 Active 25 DOM
-
2026-06-07days on market $109,900 Active 24 DOM
-
2026-06-02days on market $109,900 Active 19 DOM
-
2026-06-01days on market $109,900 Active 18 DOM
-
2026-05-31days on market $109,900 Active 17 DOM
-
2026-05-30days on market $109,900 Active 16 DOM
-
2026-05-14$109,900 Active
Show marketing remark (240 chars)
Nice & neat! Great rental property or starter home. Features include maintenance free vinyl siding, 2 bedrooms, 1 bath, basement with outside entrance, eat-in kitchen & 2 decks in a nice location on a corner lot. Priced to sell!
-
2026-05-14$109,900 Active 240-char remark
Show marketing remark (240 chars)
Nice & neat! Great rental property or starter home. Features include maintenance free vinyl siding, 2 bedrooms, 1 bath, basement with outside entrance, eat-in kitchen & 2 decks in a nice location on a corner lot. Priced to sell!
-
2013-10-31soldstatus $40,000
ⓘ Source: listings_history table (triggers on properties + properties_extension) + one-shot
backfill from property_details.listing_events for pre-trigger history.
Tax reassessment forecast IL · Partial reset (capped growth)
- Current annual tax
- $2,741 · $228/mo
- Projected year-2 tax
- $2,741 · $228/mo
- Expected delta
- $0/yr ($0/mo · 0.0%)
ⓘ Screening estimate from a state-policy table — verify with the county assessor before closing.
Climate risk First Street
- Flood 1/10 Low FEMA zone X (unshaded) · 0% chance over 30 yrs
- Wildfire 1/10 Low
- Heat 3/10 Moderate 7 d/yr ≥104°F today · 16 d/yr by 30 yrs out
- Wind 2/10 Low 0% chance of damaging wind over 30 yrs
- Air quality 2/10 Low 1 unhealthy d/yr today · 1 by 30 yrs out
Nearby sold comps map
Loading sold comps map…
Walkable amenities ~0.75 mi
Loading nearby amenities…
Taxation est. · year 1
- Rental income
- $12,321
- − Mortgage interest
- −$5,484
- − Property taxes
- −$2,741
- − Insurance
- −$490
- − Repairs & maintenance
- −$986
- − Management
- −$986
- − Depreciation
- −$2,848
- Taxable loss
- −$1,212
- Est. tax savings @ 24.0%
- +$291
- After-tax cash flow
- $634/yr
For passive investors: Depreciation is non-cash, so a rental often shows a tax loss while cash-flowing — sheltering income. Rental losses are passive: they offset passive income freely, and up to $25,000/yr can offset ordinary (W-2) income if you actively participate and your MAGI is under $100k (phasing out to $0 by $150k); unused losses carry forward. On sale, claimed depreciation is recaptured at up to 25%, and gains may owe capital-gains tax (a 1031 exchange can defer both). Figures are a year-1 estimate at your 24.0% rate — not tax advice; consult a CPA.
Schools (NCES district)
- District
- La Salle-Peru Twp Hsd 120
- NCES district ID
- 1722110
- Math proficiency
- 15% ▼ -11.00%
- Reading proficiency
- 26% ▼ -11.00%
- Median HH income
- $40,449
- Composite
- 17.37/100
- National rank
- #9070
- State rank
- #427 of 620 in IL
Livability — LaSalle
- Score
- 64/100
- State rank
- #718
- US rank
- #14579
Category grades
Schools grade is shown separately in the Schools card above.
Census & demographics
- Census place
- LaSalle, IL
- Population (ZIP)
- 10,312
Population outlook (LaSalle County) Hauer SSP2
- Today (2025)
- 107,080 people
- By 2030
- 104,196 · -2.7%
- By 2040
- 97,413 · -9.0%
- By 2050
- 90,294 · -15.7%
- By 2075
- 76,252 · -28.8%
- By 2100
- 61,339 · -42.7%
Race, ethnicity, and origin ACS 2023
- Neighborhood character
- Predominantly White (74%)
- Race & ethnicity
- White 74% Hispanic / Latino 18% Two or more races 8% Black 5%
- Hispanic origin (detail)
- Mexican 18%
- Common ancestry
- Romanian 9% Lithuanian 3% Scotch-Irish 1%
- Foreign-born
- 6% · Canada
- Languages at home
- 87% English-only · Spanish 10% German/W. Germanic 1% Other Indo-European 1%
Political lean MEDSL · LaSalle
- 2024 margin
- R (+18.5) · D 40.1% · R 58.6% · Other 1.3%
- 2008→2024 swing
- -29.6pp toward R · 2008: 11.1pp · 2024: -18.5pp
- All cycles
- 2024: R+18.5 2020: R+14.3 2016: R+14.4 2012: R+0.4 2008: D+11.1
Not yet ingested
- Civics
- —
Market trends
- HPI YoY
- ▼ -52.46%
- Current HPI
- 163.091
- Rent YoY
- —
- Metro
- —
- State GDP YoY
- ▲ 1.59%
- F500 in state
- 60
Industry mix (Fortune 500 HQ in IL)
| Industry | F500 HQs | Revenue |
|---|---|---|
| Insurance | 4 | $201B |
|
||
| Consumer Goods | 4 | $87B |
|
||
| Industrial Machinery | 3 | $64B |
|
||
| Healthcare | 2 | $55B |
|
||
| Retail / Pharmacy | 1 | $148B |
|
||
| Agriculture / Food | 1 | $86B |
|
||
Price history
+174.8% since first listed3 events — show timeline
- 2026-05-14 Listed $109,900 NWIAR
- 2026-05-14 Listed $109,900 MRED as Distributed by MLS Grid
- 2013-10-31 Sold (Public Records) $40,000 Public Records
Property tax history
+22.2%/yrLatest (2024): $2,741 · +6.1% YoY. Source: county tax records.
Cash-flow waterfall
monthlySold comps — $/sqft
last 12 mo · ≤1 miLoading sold comps…