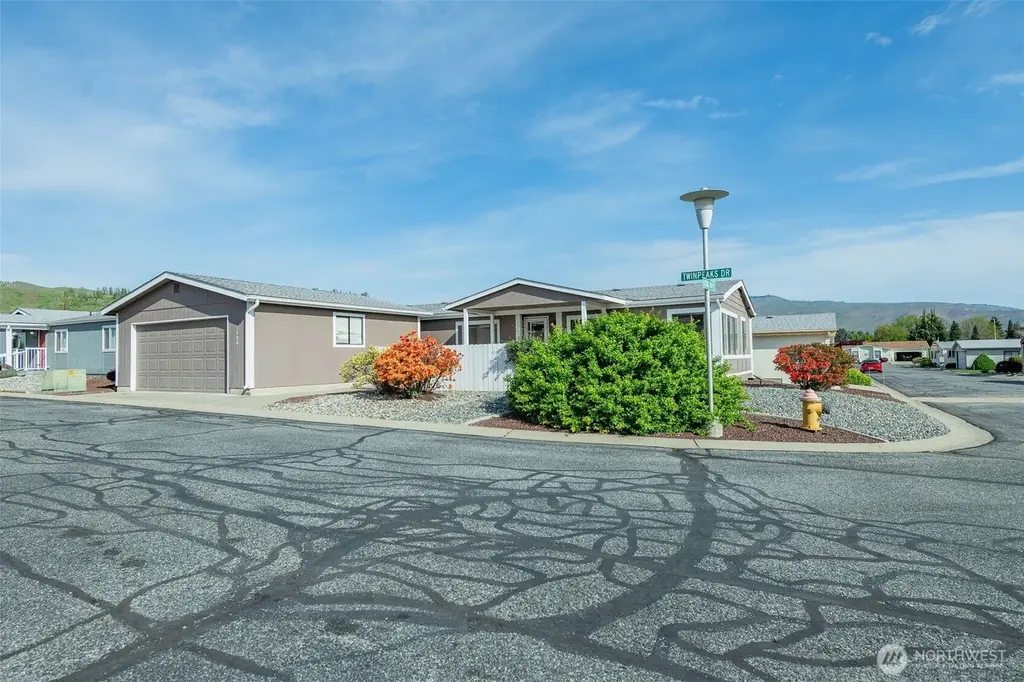
1706 Twin Peaks Dr #83 · Wenatchee, WA
Flood risk 1/10 · Minimal
- FEMA flood zone
- X (shaded)
- Chance of flooding over 30 yrs
- 0.0%
- Est. flood insurance / yr
- $507 – $1,088
Fire risk 7/10 · Major
- Est. fire insurance / yr
- $604 – $1,122
Heat risk 5/10 · Moderate
- Hot days now (above 96°F)
- 7 days/yr
- Hot days in 30 yrs
- 14 days/yr
Wind risk 1/10 · Minimal
- Chance of severe wind over 30 yrs
- —
Air-quality risk 10/10 · Severe
- Unhealthy air days now
- 25 days/yr
- Unhealthy air days in 30 yrs
- 25 days/yr
Risk factors via First Street. Map © Google.
Why this score? — see what drove the B+ grade
The composite is a weighted blend of 9 inputs, each scored 0–100. Each bar is that input's sub-score; the figure is the points it added to the 100-point composite (weight × sub-score).
- Cash flow +30.0/30.0
- ARV discount +15.0/15.0
- 1% rule +10.0/10.0
- DSCR +10.0/10.0
- Schools +4.2/10.0
- Livability +3.6/5.0
- Rent growth +2.7/5.0
- Condition / age +2.5/5.0
- Appreciation +0.0/10.0
$145,000
🖨 Deal sheet 📄 Offer letter ✓ Due diligence
Listing remarks
* * SELLER AGREES TO PAY 4 MONTHS LOT RENT IN ADVANCE AT CLOSING * * Bright and inviting 3-bedroom, 2-bath manufactured home located in a welcoming 55+ community. This spacious residence offers an open floor plan filled with abundant natural light, creating a warm and comfortable atmosphere throughout. The primary suite features a private bath, while two additional bedrooms provide flexibility for guests, hobbies, or office space. Enjoy convenient single-level living in a peaceful neighborhood designed for active adults. Situated on leased land, this home offers a low-maintenance lifestyle with access to community amenities and a friendly environment perfect for relaxed living. RV Parkin
Key facts
- Open floor plan
- Rv parking
- Private bath
Tags
Property features AI
Finance
- Other: Calculated living area: 1568; Property condition: Good; Structure type: Manufactured house; Mobile home remains
- Financial info: Land lease: $888; Listing terms: Cash
- HOA & community: Located in Twin Peaks Manor (manufactured home park); Park approved for sale; Senior community; Park amenities include pool and RV parking; Bus service nearby (routes 1 & 2)
Exterior
- Parking: Individual garage; Has garage; RV parking (park amenity)
- Utilities: Electric power; Public water (see remarks); Public sewer; Electric water heater (located in bathroom closet); Power provided by Chelan PUD
- Home design: Manufactured double-wide home; One story; Southwest facing; Entry level: One
- Construction: Wood construction; Composition roof; Tie-down foundation; Built by Marlette Homes, model 2359; Manufactured after 6/15/1976
- Exterior features: Wood products exterior; Patio/porch/deck; Landscaped; Corner lot; Has view
Interior
- Kitchen: Dishwasher; Garbage disposal; Refrigerator; Stove/Range
- Bedrooms: 3 bedrooms
- Flooring: Ceramic tile; Laminate
- Bathrooms: 2 full bathrooms; 2 bathtubs; 2 showers
- Heating & cooling: Forced air heating; Central air conditioning
- Interior features: Water heater; Skylights; Vaulted ceilings; Walk-in closet; Dining room; Living room; Utility room; Bath off primary
- Laundry & utility: Washer; Dryer
Neighborhood map
What this means for you Summary
Snapshot
- This is a 3-bed/2.0-bath manufactured listed at $145k.
Deal economics
- At list price, monthly cash flow is $866 ($10k/yr) — positive.
- The deal already cash-flows at list — no discount required.
- Meets the 1% rule at list price ($2k rent vs $145k).
- Recommended offer: $143k (1.5% below list) — sets the bar for market timing.
- Cap rate 13.5% vs local median 2.9% in Wenatchee — top-decile yield for the area; either an underpriced asset or a hidden risk that comps aren't pricing in. Stress-test before assuming the spread holds.
Location & tenants
- Location reads 72/100 on livability (#211 in WA) — a middle-class / working-renter tenant base. Strengths: health & safety A+, housing A, amenities B; Watch: crime C-, commute F.
- Wenatchee School District (urban): math 38% / reading 54% proficiency, ranked #175 of 291 in WA (top 60%) — families likely to look elsewhere, expect single-tenant / working-renter base with shorter leases.
- Market conditions: Rents flat; 326 active listings in the ZIP; 8 comparable units currently listed for rent nearby; rentals lingering (median 44d on market — plan ~5-8 weeks vacancy on turnover, expect pricing pressure); 100% of comp listings sitting > 30 days — soft ceiling on asking rent; solid renter incomes; 762 units permitted in Chelan County in 2024 (377 in 5+ unit buildings).
- This rent runs 34% of the median local income ($81k/yr) — at the standard rent-burdened threshold; future hikes will face affordability resistance.
Forward outlook
- Local home prices are declining (-3.0%/yr); year-one equity from $1k of loan paydown is wiped out by about $4k of value loss. Plan a longer hold.
- Chelan County population projected at +13% by 2050 — modest demand growth; plan on rents tracking national, not racing it.
- At projected returns (-3.0% appreciation + 0.8% rent growth), your $41k cash investment doubles in ~6 years — after that, you're playing with house money.
Negotiation context
- It's been on market 24 days — a 2% lower offer ($143k) is reasonable based on typical stale-listing flexibility.
Risks & watch-outs
- Climate carrying-cost: major wildfire risk; extreme-heat days projected 7→14/yr by 2055 (HVAC capex compounding) — expect insurance premiums to compound above CPI over the hold.
Questions for the listing agent
- Is there a deadline driving the sale (1031 exchange, divorce, estate, relocation)? That informs how much negotiation room exists.
- What's the average days-on-market for RENTAL listings here right now (not sales)? A rising rental-DOM trend means longer vacancies and softer asking-rent achievability than the comps imply.
- What's the recent tenant-quality profile in this submarket — average credit score on applications, eviction rate, late-payment / NSF rate, and stable-employment percentage? A property-management company in the area should have these aggregated.
- How much new for-sale + rental construction is in the pipeline within 1–3 miles? Heavy new supply typically softens prices + rents 12–24 months out; constrained supply supports both.
Investment metrics
- 1% rule
- 1.57% ✓
- Cap rate
- 13.46%
- Cash-on-cash
- 25.60%
- DSCR
- 2.14
- GRM
- 5.3
CMA / ARV
- ARV (on-the-fly)
- $175,616
- Comps found
- 12
Show comp detail 12 sales within ~0.75 mi
| Address | Dist | Beds/Ba | Sqft | Sold | Price | $/sf | Match |
|---|---|---|---|---|---|---|---|
| 1610 Twin Peaks Dr | 0.06mi | 2/2.0 (-1) | 1,568 (0%) | 2mo | $175,000 | $112 | 90 |
| 1701 Clark Dr #66 | 0.07mi | 3/2.0 | 1,680 (+7%) | 2mo | $174,672 | $104 | 83 |
| 1705 Twins Peaks Dr | 0.03mi | 3/2.0 | 1,680 (+7%) | 5mo | $217,000 | $129 | 83 |
| 1702 Clark Dr | 0.09mi | 3/2.0 | 1,680 (+7%) | 2mo | $184,900 | $110 | 82 |
| 914 Meadowridge Dr | 0.44mi | 3/2.0 | 1,568 (0%) | 3mo | $105,000 | $67 | 77 |
| 1700 Twin Peaks Dr #71 | 0.04mi | 2/2.0 (-1) | 1,668 (+6%) | 8mo | $135,000 | $81 | 76 |
| 1635 Meadowridge Dr | 0.47mi | 3/2.0 | 1,620 (+3%) | 1mo | $222,000 | $137 | 72 |
| 1814 Heritage Dr | 0.17mi | 2/2.0 (-1) | 1,691 (+8%) | 4mo | $400,000 | $237 | 70 |
| 1311 Maple St #18 | 0.51mi | 3/2.0 | 1,536 (-2%) | 4mo | $80,000 | $52 | 69 |
| 611 N Western Ave #34 | 0.67mi | 3/2.0 | 1,568 (0%) | 5mo | $120,000 | $77 | 65 |
| 909 Meadowridge Dr #37 | 0.49mi | 2/2.0 (-1) | 1,404 (-10%) | 6mo | $210,000 | $150 | 49 |
| 611 N Western Ave #25 | 0.67mi | 3/2.0 | 1,344 (-14%) | 8mo | $185,500 | $138 | 38 |
Match score weights: distance 35% · size 25% · config 20% · recency 20%. Top-matched comps best support the ARV.
Projected returns pro-forma
-3.0% appreciation · 0.75% rent growth · sell at horizon
- IRR
- 16.7%
- Equity multiple
- 1.66×
- Total profit
- $26,624
- Equity at exit
- $21,620
- IRR
- 23.6%
- Equity multiple
- 2.83×
- Total profit
- $74,410
- Equity at exit
- $12,537
Cash invested: $40,600 (down + closing). Projections, not guarantees.
Landlord ↔ Tenant lean methodology
- Overall (STATE)
- 28 Tenant-Leaning
- State Washington
- 28 Tenant-Leaning · D+8
- County
- — inherits STATE
- City
- — inherits STATE
ZIP-level market 98801
- Rents YoY
- 0.8%
- Active inventory
- 326
- Price-to-rent
- 5.3×
Monthly cashflow live
- Estimated rent
- $2,278 high interval (Pro) →
- Mortgage (P&I)
- −$760
- Tax from tax record
- −$113 /mo · $1,351/yr
- Insurance
- −$60
- HOA
- −$0
- Vacancy / Maint / Mgmt
- −$478
- Net cashflow
- $866
Break-even live
UW: 25.0% down · 7.5% · 30yr · 1.5% tax · 5.0% vac · 8.0% maint · 8.0% mgmt
Financing live
Cash to close
- Down payment
- $36,250
- Closing costs
- $4,350
- Reserves months
- —
- Total cash needed
- —
Loan-product check · same deal, 3 products live
Conventional
25% down · 7.5% · 30yr
- Down + closing
- —
- Monthly P&I
- —
- Monthly cashflow
- —
- DSCR
- —
- Eligible?
- —
Personal DTI + credit; lowest rate.
DSCR
20% down · 8.5% · 30yr
- Down + closing
- —
- Monthly P&I
- —
- Monthly cashflow
- —
- DSCR
- —
- Eligible?
- —
No personal income docs; deal must DSCR.
Hard money
10% down · 12.0% · 12mo
- Down + closing
- —
- Monthly P&I
- —
- Monthly cashflow
- —
- DSCR
- —
- Eligible?
- —
Short-term bridge; refi at stabilization.
Rent comps 8 comps
| Address | Beds | Baths | Sqft | Rent | $/sqft | DOM | Units | Dist |
|---|---|---|---|---|---|---|---|---|
| 1409 Maple St Unit 2 Wenatchee, WA | 2.0 | 2.0 | 1300 | $2,195 | $1.69 | 43d | 1 | 0.35mi |
| 1030 Finch Ln Unit H Wenatchee, WA | 3.0 | 2.5 | 1750 | $2,600 | $1.49 | 43d | 1 | 0.35mi |
| 1312 Springwater Ave Wenatchee, WA | 3.0 | 2.0 | 1150 | $2,550 | $2.22 | 43d | 1 | 0.56mi |
| 1013 Fifth St Wenatchee, WA | 3.0 | 3.5 | 2152 | $2,295 | $1.07 | 43d | 1 | 1.14mi |
| 1100 First St Unit 1107 Wenatchee, WA | 2.0 | 1.5 | 1600 | $1,795 | $1.12 | 43d | 1 | 1.34mi |
| 895 Riverside Dr Wenatchee, WA | 2.0 | 1.0–2.5 | 1000 | $2,225 | $2.22 | 43d | 15 | 1.39mi |
| 309 N Emerson Ave Unit 1 Wenatchee, WA | 2.0 | 1.0 | 1400 | $1,595 | $1.14 | 43d | 1 | 1.39mi |
| 615 N Piere St Wenatchee, WA | 2.0 | 1.0–2.0 | 809 | $2,355 | $2.91 | 43d | 9 | 1.44mi |
Listing history 11 events
-
2026-06-13pricestatusdays on market $145,000 Pending 24 DOM
-
2026-06-10days on market $150,000 Active 22 DOM
-
2026-06-09days on market $150,000 Active 21 DOM
-
2026-06-08days on market $150,000 Active 20 DOM
-
2026-06-07days on market $150,000 Active 19 DOM
-
2026-06-05days on market $150,000 Active 16 DOM
-
2026-06-02days on market $150,000 Active 14 DOM
-
2026-06-01days on market $150,000 Active 13 DOM
-
2026-05-31days on market $150,000 Active 12 DOM
-
2026-05-30days on market $150,000 Active 11 DOM
-
2026-04-22$150,000 Active
ⓘ Source: listings_history table (triggers on properties + properties_extension) + one-shot
backfill from property_details.listing_events for pre-trigger history.
Tax reassessment forecast WA · Resets to sale price
- Current annual tax
- $1,351 · $113/mo
- Projected year-2 tax
- $1,421 · $118/mo
- Expected delta
- +$70/yr (+$6/mo · 5.2%)
ⓘ Screening estimate from a state-policy table — verify with the county assessor before closing.
Climate risk First Street
- Flood 1/10 Low FEMA zone X (shaded) · 0% chance over 30 yrs
- Wildfire 7/10 Severe
- Heat 5/10 Major 7 d/yr ≥96°F today · 14 d/yr by 30 yrs out
- Wind 1/10 Low
- Air quality 10/10 Extreme 25 unhealthy d/yr today · 25 by 30 yrs out
Nearby sold comps map
Loading sold comps map…
Walkable amenities ~0.75 mi
Loading nearby amenities…
Taxation est. · year 1
- Rental income
- $27,337
- − Mortgage interest
- −$8,122
- − Property taxes
- −$1,351
- − Insurance
- −$725
- − Repairs & maintenance
- −$2,187
- − Management
- −$2,187
- − Depreciation
- −$4,218
- Taxable income
- $8,546
- Est. tax owed @ 24.0%
- −$2,051
- After-tax cash flow
- $8,344/yr
For passive investors: Depreciation is non-cash, so a rental often shows a tax loss while cash-flowing — sheltering income. Rental losses are passive: they offset passive income freely, and up to $25,000/yr can offset ordinary (W-2) income if you actively participate and your MAGI is under $100k (phasing out to $0 by $150k); unused losses carry forward. On sale, claimed depreciation is recaptured at up to 25%, and gains may owe capital-gains tax (a 1031 exchange can defer both). Figures are a year-1 estimate at your 24.0% rate — not tax advice; consult a CPA.
Schools (NCES district)
- District
- Wenatchee School District
- NCES district ID
- 5309660
- Math proficiency
- 38% ▲ 1.00%
- Reading proficiency
- 54% ▲ 2.00%
- Median HH income
- $51,059
- Composite
- 41.72/100
- National rank
- #7189
- State rank
- #175 of 291 in WA
Livability — Wenatchee
- Score
- 72/100
- State rank
- #211
- US rank
- #6003
Category grades
Schools grade is shown separately in the Schools card above.
Census & demographics
- Census place
- Wenatchee, WA
- County
- Chelan County · 53,031 people
- City population
- 45,426
- Metro
- Wenatchee, WA
- Population (ZIP)
- 45,426
- Household income
- $81,488
- Rent vs Own
- Severe rent burden
- 1278.0
Population outlook (Chelan County) Hauer SSP2
- Today (2025)
- 81,630 people
- By 2030
- 84,312 · +3.3%
- By 2040
- 88,619 · +8.6%
- By 2050
- 91,915 · +12.6%
- By 2075
- 99,409 · +21.8%
- By 2100
- 100,032 · +22.5%
Race, ethnicity, and origin ACS 2023
- Neighborhood character
- Majority White (61%)
- Race & ethnicity
- White 61% Hispanic / Latino 33% Two or more races 14% Native American 2%
- Hispanic origin (detail)
- Mexican 28%
- Common ancestry
- Portuguese 4% Italian 3% Slovak 3%
- Foreign-born
- 14% · Canada, Dominican Republic
- Languages at home
- 72% English-only · Spanish 27%
Political lean MEDSL · Chelan
- 2024 margin
- Lean R (+9.5) · D 43.9% · R 53.4% · Other 2.7%
- 2008→2024 swing
- +2.5pp toward D · 2008: -12.0pp · 2024: -9.5pp
- All cycles
- 2024: R+9.5 2020: R+7.8 2016: R+15.7 2012: R+16.9 2008: R+12.0
Not yet ingested
- Civics
- —
Market trends
- HPI YoY
- ▼ -569.39%
- Current HPI
- 227.1555
- Rent YoY
- ▲ 0.75%
- Metro
- Wenatchee, WA
- State GDP YoY
- ▲ 4.65%
- F500 in state
- 22
Industry mix (Fortune 500 HQ in WA)
| Industry | F500 HQs | Revenue |
|---|---|---|
| Retail | 2 | $269B |
|
||
| Technology / Retail | 1 | $638B |
|
||
| Technology | 1 | $245B |
|
||
| Telecommunications | 1 | $38B |
|
||
| Food / Beverage | 1 | $36B |
|
||
| Automotive / Trucks | 1 | $34B |
|
||
Price history
-3.3% since first listed3 events — show timeline
- 2026-06-12 Pending — NWMLS as Distributed by MLS Grid
- 2026-06-10 Price Changed $145,000 NWMLS as Distributed by MLS Grid
- 2026-05-19 Listed $150,000 NWMLS as Distributed by MLS Grid
Property tax history
+5.8%/yrLatest (2026): $1,351 · +10.5% YoY. Source: county tax records.
Cash-flow waterfall
monthlySold comps — $/sqft
last 12 mo · ≤1 miLoading sold comps…