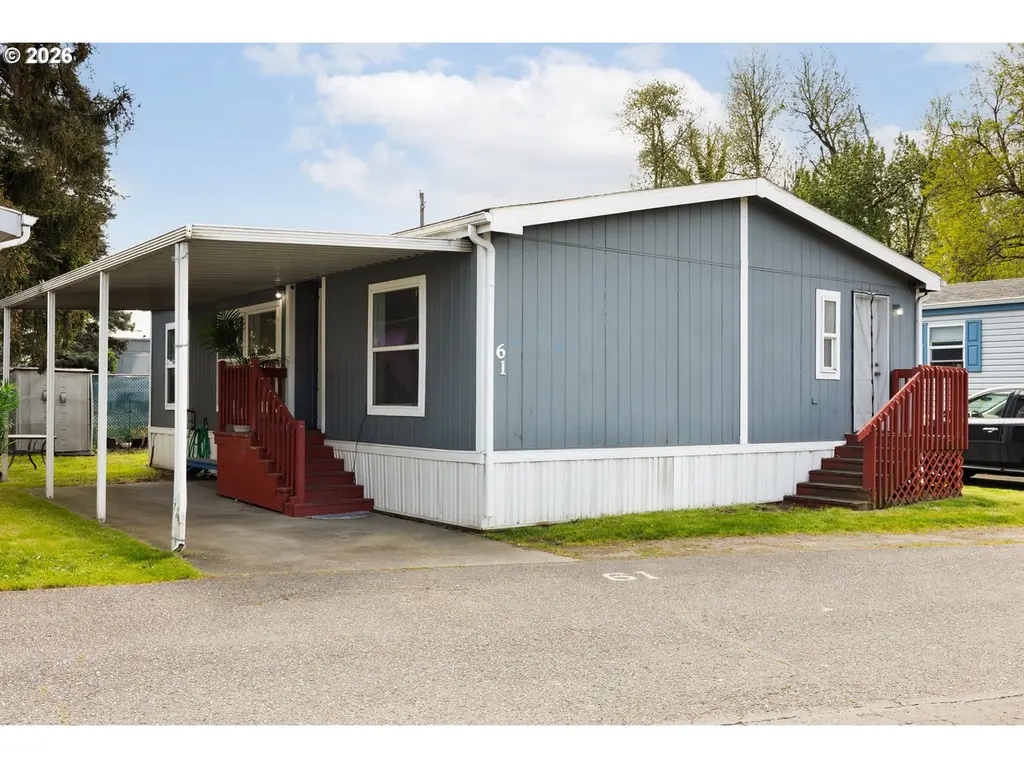
9000 NE M L King Blvd #61 · Portland, OR
Flood risk 4/10 · Minor
- FEMA flood zone
- X
- Chance of flooding over 30 yrs
- 0.2%
- Est. flood insurance / yr
- $507 – $1,088
Fire risk 1/10 · Minimal
- Est. fire insurance / yr
- $498 – $926
Heat risk 3/10 · Minor
- Hot days now (above 92°F)
- 7 days/yr
- Hot days in 30 yrs
- 14 days/yr
Wind risk 1/10 · Minimal
- Chance of severe wind over 30 yrs
- —
Air-quality risk 10/10 · Severe
- Unhealthy air days now
- 19 days/yr
- Unhealthy air days in 30 yrs
- 20 days/yr
Risk factors via First Street. Map © Google.
Why this score? — see what drove the C+ grade
The composite is a weighted blend of 9 inputs, each scored 0–100. Each bar is that input's sub-score; the figure is the points it added to the 100-point composite (weight × sub-score).
- Cash flow +30.0/30.0
- 1% rule +10.0/10.0
- DSCR +10.0/10.0
- Schools +4.7/10.0
- Livability +3.9/5.0
- Rent growth +2.6/5.0
- Condition / age +2.5/5.0
- ARV discount +0.0/15.0
- Appreciation +0.0/10.0
$119,999
🖨 Deal sheet 📄 Offer letter ✓ Due diligence
Listing remarks MLS
**QUALIFIED BUYERS MAY HAVE THE CHANCE TO PURCHASE THIS HOME WITH $0 DOWN. ASK ME HOW!** Welcome to this beautifully updated double-wide home located in a desirable all-ages community! One of the standout features is the incredibly affordable space rent of just $795/month—making this an excellent opportunity for comfortable, budget-friendly living. Inside, you’ll find a spacious 3-bedroom, 2-bathroom layout with an updated kitchen designed for both functionality and style. The home also offers covered parking and a warm, inviting atmosphere throughout. Whether you're relaxing at home or entertaining, this property delivers both comfort and value. Don’t miss your chance to own an updated home at an affordable price.
Key facts
- 2 garage spots
- Built 1995
- Listed 61 days
Neighborhood map
What this means for you Summary
Snapshot
- This is a 3-bed/2.0-bath manufactured listed at $120k.
Deal economics
- At list price, monthly cash flow is $964 ($12k/yr) — positive.
- The deal already cash-flows at list — no discount required.
- Meets the 1% rule at list price ($2k rent vs $120k).
- Recommended offer: $113k (6.0% below list) — sets the bar for market timing.
- Cap rate 15.9% vs local median 2.2% in Portland — top-decile yield for the area; either an underpriced asset or a hidden risk that comps aren't pricing in. Stress-test before assuming the spread holds.
Location & tenants
- Location reads 77/100 on livability (#72 in OR, #3,256 nationally) — a middle-class / working-renter tenant base. Strengths: amenities A+, commute A+, health & safety A+; Watch: crime F, cost of living F.
- Portland SD 1J (urban): math 46% / reading 58% proficiency, ranked #23 of 183 in OR (top 13%) — acceptable for families but not a draw, mixed tenant base, ~2y average lease.
- Market conditions: Rents flat; 180 active listings in the ZIP; 29 comparable units currently listed for rent nearby; rentals at typical pace (median 15d on market — plan ~3-4 weeks tenant-placement turnaround); high-income renter base; 2,041 units permitted in Multnomah County in 2024 (905 in 5+ unit buildings).
Forward outlook
- Local home prices are declining (-3.0%/yr); year-one equity from $829 of loan paydown is wiped out by about $4k of value loss. Plan a longer hold.
- Multnomah County population projected at +33% by 2050 — long-run rental-demand tailwind backs the buy-and-hold thesis.
- At projected returns (-3.0% appreciation + 0.5% rent growth), your $34k cash investment doubles in ~4 years — after that, you're playing with house money.
Negotiation context
- It's been on market 61 days — a 6% lower offer ($113k) is reasonable based on typical stale-listing flexibility.
Questions for the listing agent
- It's been on market 61 days. Have you received any prior offers? Is the seller open to a 6% concession, seller financing, or rate buy-down credit?
- Why hasn't it sold? Are there any deal-killer items the seller is aware of (foundation, flood, title, zoning, code violations)?
- Is there a deadline driving the sale (1031 exchange, divorce, estate, relocation)? That informs how much negotiation room exists.
- Crime grade is F in this area — have there been break-ins, vandalism, or insurance claims at this property in the last 3 years? What carrier currently insures it and at what premium?
- What's the average days-on-market for RENTAL listings here right now (not sales)? A rising rental-DOM trend means longer vacancies and softer asking-rent achievability than the comps imply.
- What's the recent tenant-quality profile in this submarket — average credit score on applications, eviction rate, late-payment / NSF rate, and stable-employment percentage? A property-management company in the area should have these aggregated.
- How much new for-sale + rental construction is in the pipeline within 1–3 miles? Heavy new supply typically softens prices + rents 12–24 months out; constrained supply supports both.
Investment metrics
- 1% rule
- 1.81% ✓
- Cap rate
- 15.94%
- Cash-on-cash
- 34.44%
- DSCR
- 2.53
- GRM
- 4.6
CMA / ARV
- ARV (median comp)
- $101,678
- List price
- $119,999
- Delta
- 18.02%
- Verdict
- OVERPRICED
- Comps
- 8 within 1.0 mi
Show comp detail 5 sales within ~0.75 mi
| Address | Dist | Beds/Ba | Sqft | Sold | Price | $/sf | Match |
|---|---|---|---|---|---|---|---|
| 9000 NE M L King Blvd #88 | 0.00mi | 2/2.0 (-1) | 924 (-13%) | 4mo | $44,000 | $48 | 70 |
| 9000 NE M L King Blvd #34 | 0.00mi | 2/2.0 (-1) | 938 (-12%) | 11mo | $70,000 | $75 | 66 |
| 9000 NE M L King Blvd #77 | 0.00mi | 3/2.0 | 1,215 (+14%) | 13mo | $129,999 | $107 | 65 |
| 9000 NE Martin Luther King Jr Blvd #77 | 0.01mi | 3/2.0 | 1,215 (+14%) | 13mo | $129,999 | $107 | 65 |
| 9000 NE M L King Blvd #36 | 0.00mi | 3/2.0 | 924 (-13%) | 18mo | $99,000 | $107 | 63 |
Match score weights: distance 35% · size 25% · config 20% · recency 20%. Top-matched comps best support the ARV.
Projected returns pro-forma
-3.0% appreciation · 0.52% rent growth · sell at horizon
- IRR
- 27.1%
- Equity multiple
- 2.09×
- Total profit
- $36,668
- Equity at exit
- $17,892
- IRR
- 33.2%
- Equity multiple
- 3.69×
- Total profit
- $90,290
- Equity at exit
- $10,375
Cash invested: $33,600 (down + closing). Projections, not guarantees.
Landlord ↔ Tenant lean methodology
- Overall (CITY)
- 0 Strongly Tenant-Friendly
- State Oregon
- 28 Tenant-Leaning · D+6
- County
- — inherits STATE
- City Portland
- 0 Strongly Tenant-Friendly · D+39
ZIP-level market 97211
- Rents YoY
- 0.5%
- Active inventory
- 180
- Price-to-rent
- 4.6×
Monthly cashflow live
- Estimated rent
- $2,174 high interval (Pro) →
- Mortgage (P&I)
- −$629
- Tax from tax record
- −$74 /mo · $890/yr
- Insurance
- −$50
- HOA
- −$0
- Vacancy / Maint / Mgmt
- −$457
- Net cashflow
- $964
Break-even live
UW: 25.0% down · 7.5% · 30yr · 1.5% tax · 5.0% vac · 8.0% maint · 8.0% mgmt
Financing live
Cash to close
- Down payment
- $30,000
- Closing costs
- $3,600
- Reserves months
- —
- Total cash needed
- —
Loan-product check · same deal, 3 products live
Conventional
25% down · 7.5% · 30yr
- Down + closing
- —
- Monthly P&I
- —
- Monthly cashflow
- —
- DSCR
- —
- Eligible?
- —
Personal DTI + credit; lowest rate.
DSCR
20% down · 8.5% · 30yr
- Down + closing
- —
- Monthly P&I
- —
- Monthly cashflow
- —
- DSCR
- —
- Eligible?
- —
No personal income docs; deal must DSCR.
Hard money
10% down · 12.0% · 12mo
- Down + closing
- —
- Monthly P&I
- —
- Monthly cashflow
- —
- DSCR
- —
- Eligible?
- —
Short-term bridge; refi at stabilization.
Rent comps 29 comps
| Address | Beds | Baths | Sqft | Rent | $/sqft | DOM | Units | Dist |
|---|---|---|---|---|---|---|---|---|
| 9000 NE M L King Blvd #248 Portland, OR | 2.0 | 2.0 | 799 | $1,525 | $1.91 | 43d | 1 | 0.01mi |
| 1034 NE Lija Loop Unit 10474-1022 Portland, OR | 2.0 | 1.5 | 1094 | $1,885 | $1.72 | 7d | 1 | 0.49mi |
| 927 N Watts St Portland, OR | 2.0 | 1.0 | 900 | $1,895 | $2.11 | 10d | 1 | 0.81mi |
| 424 NE Stafford St Portland, OR | 1.0–2.0 | 1.0–1.5 | 975 | $1,950 | $2.00 | 1d | 3 | 0.89mi |
| 7676 N Mississippi Ave Portland, OR | 3.0 | 1.0 | 1000 | $2,650 | $2.65 | 14d | 1 | 0.90mi |
| 1209 N Winchell St #4 Portland, OR | 2.0 | 3.0 | 899 | $2,121 | $2.36 | 43d | 1 | 0.92mi |
| 7134 NE Martin Luther King Junior Blvd Portland, OR | 2.0 | 1.5 | 1461 | $2,100 | $1.44 | 3d | 1 | 0.98mi |
| 818 N Stafford St Portland, OR | 3.0 | 2.0 | 768 | $2,645 | $3.44 | 22d | 1 | 1.03mi |
| 858 N Stafford St Portland, OR | 2.0 | 1.0 | 1500 | $2,300 | $1.53 | 43d | 1 | 1.05mi |
| 8338 N Interstate Ave Portland, OR | 2.0 | 1.0–2.0 | 752 | $1,975 | $2.63 | 22d | 6 | 1.07mi |
| 7134 N Albina Ave Portland, OR | 3.0 | 2.0 | 1253 | $2,750 | $2.19 | 43d | 1 | 1.09mi |
| 1315 N Russet St Portland, OR | 2.0 | 1.5 | 1200 | $2,440 | $2.03 | 14d | 1 | 1.10mi |
| 1315 N Russet St Portland, OR | 2.0 | 1.5 | 1200 | $2,562 | $2.13 | 12d | 1 | 1.10mi |
| 995 N Marine Dr Portland, OR | 2.0 | 1.0–2.0 | 924 | $2,036 | $2.20 | 2d | 11 | 1.13mi |
| 110 N Tomahawk Island Dr Portland, OR | 1.0–2.0 | 1.0–2.0 | 994 | $2,674 | $2.69 | 1d | 27 | 1.15mi |
| 11505 NE Yacht Harbor Dr Portland, OR | 2.0 | 2.0 | 2559 | $4,356 | $1.70 | 1d | 5 | 1.16mi |
| 1217 N Morgan St Portland, OR | 2.0 | 2.5 | 1039 | $2,375 | $2.29 | 4d | 1 | 1.24mi |
| 1055 N Anchor Way Portland, OR | 1.0–2.0 | 1.0–2.0 | 1056 | $3,150 | $2.98 | 1d | 34 | 1.25mi |
| 8408 N Brandon Ave Portland, OR | 2.0 | 1.0 | 652 | $1,550 | $2.38 | 24d | 4 | 1.25mi |
| 1820 NE Lombard St Unit 1923 Portland, OR | 2.0 | 1.5 | 1000 | $1,695 | $1.70 | 43d | 1 | 1.29mi |
| 1250 N Bryant St Portland, OR | 1.0–2.0 | 1.0 | 594 | $2,099 | $3.53 | 4d | 3 | 1.29mi |
| 1923 NE Buffalo St Portland, OR | 2.0 | 1.5 | 1000 | $1,695 | $1.70 | 24d | 1 | 1.31mi |
| 6525 N Haight Ave Unit 6519 Portland, OR | 2.0 | 1.5 | 1429 | $1,800 | $1.26 | 17d | 1 | 1.32mi |
| 1245 N Anchor Way Portland, OR | 2.0 | 1.0–2.0 | 856 | $2,250 | $2.63 | 1d | 16 | 1.34mi |
| 7100 N Greenwich Ave Unit 8 Portland, OR | 2.0 | 1.5 | 995 | $1,795 | $1.80 | 11d | 1 | 1.36mi |
| 6935 N Maryland Ave Unit 6937 Portland, OR | 3.0 | 2.0 | 1152 | $2,195 | $1.91 | 24d | 1 | 1.37mi |
| 1770 NE Bryant St Portland, OR | 2.0 | 1.0 | 1013 | $2,195 | $2.17 | 43d | 1 | 1.38mi |
| 6521 N Albina Ave Portland, OR | 2.0 | 1.0 | 872 | $1,615 | $1.85 | 43d | 1 | 1.39mi |
| 1520 N Bryant St Portland, OR | 1.0–2.0 | 1.0–2.0 | 638 | $2,045 | $3.20 | 24d | 17 | 1.40mi |
Listing history 13 events
-
2026-06-18days on market $119,999 Active 61 DOM
-
2026-06-17days on market $119,999 Active 60 DOM
-
2026-06-16days on market $119,999 Active 59 DOM
-
2026-06-15days on market $119,999 Active 58 DOM
-
2026-06-13days on market $119,999 Active 56 DOM
-
2026-06-09days on market $119,999 Active 52 DOM
-
2026-06-08days on market $119,999 Active 51 DOM
-
2026-06-07pricedays on market $119,999 Active 50 DOM
-
2026-06-03days on market $124,999 Active 46 DOM
-
2026-06-02days on market $124,999 Active 45 DOM
-
2026-06-01days on market $124,999 Active 44 DOM
-
2026-05-31days on market $124,999 Active 43 DOM
-
2026-04-17$124,999 Active 742-char remark
Show marketing remark (742 chars)
**QUALIFIED BUYERS MAY HAVE THE CHANCE TO PURCHASE THIS HOME WITH $0 DOWN. ASK ME HOW!** Welcome to this beautifully updated double-wide home located in a desirable all-ages community! One of the standout features is the incredibly affordable space rent of just $795/month—making this an excellent opportunity for comfortable, budget-friendly living. Inside, you’ll find a spacious 3-bedroom, 2-bathroom layout with an updated kitchen designed for both functionality and style. The home also offers covered parking and a warm, inviting atmosphere throughout. Whether you're relaxing at home or entertaining, this property delivers both comfort and value. Don’t miss your chance to own an updated home at an affordable price.
ⓘ Source: listings_history table (triggers on properties + properties_extension) + one-shot
backfill from property_details.listing_events for pre-trigger history.
Tax reassessment forecast OR · Resets to sale price
- Current annual tax
- $890 · $74/mo
- Projected year-2 tax
- $1,164 · $97/mo
- Expected delta
- +$274/yr (+$23/mo · 30.8%)
ⓘ Screening estimate from a state-policy table — verify with the county assessor before closing.
Climate risk First Street
- Flood 4/10 Moderate FEMA zone X · 20% chance over 30 yrs
- Wildfire 1/10 Low
- Heat 3/10 Moderate 7 d/yr ≥92°F today · 14 d/yr by 30 yrs out
- Wind 1/10 Low
- Air quality 10/10 Extreme 19 unhealthy d/yr today · 20 by 30 yrs out
Nearby sold comps map
Loading sold comps map…
Walkable amenities ~0.75 mi
Loading nearby amenities…
Taxation est. · year 1
- Rental income
- $26,093
- − Mortgage interest
- −$6,722
- − Property taxes
- −$890
- − Insurance
- −$600
- − Repairs & maintenance
- −$2,087
- − Management
- −$2,087
- − Depreciation
- −$3,491
- Taxable income
- $10,216
- Est. tax owed @ 24.0%
- −$2,452
- After-tax cash flow
- $9,121/yr
For passive investors: Depreciation is non-cash, so a rental often shows a tax loss while cash-flowing — sheltering income. Rental losses are passive: they offset passive income freely, and up to $25,000/yr can offset ordinary (W-2) income if you actively participate and your MAGI is under $100k (phasing out to $0 by $150k); unused losses carry forward. On sale, claimed depreciation is recaptured at up to 25%, and gains may owe capital-gains tax (a 1031 exchange can defer both). Figures are a year-1 estimate at your 24.0% rate — not tax advice; consult a CPA.
Schools (NCES district)
- District
- Portland SD 1J
- NCES district ID
- 4110040
- Math proficiency
- 46% ▼ -2.00%
- Reading proficiency
- 58% ▼ -3.00%
- Median HH income
- $57,851
- Composite
- 47.1/100
- National rank
- #5112
- State rank
- #23 of 183 in OR
Livability — Portland
- Score
- 77/100
- State rank
- #72
- US rank
- #3256
Category grades
Schools grade is shown separately in the Schools card above.
Census & demographics
- Census place
- Portland, OR
- County
- Multnomah County · 786,692 people
- City population
- 774,334
- Metro
- Portland-Vancouver-Hillsboro, OR-WA
- Population (ZIP)
- 33,769
- Household income
- $112,586
- Rent vs Own
- Severe rent burden
- 1162.0
Population outlook (Multnomah County) Hauer SSP2
- Today (2025)
- 930,825 people
- By 2030
- 996,904 · +7.1%
- By 2040
- 1,121,379 · +20.5%
- By 2050
- 1,242,124 · +33.4%
- By 2075
- 1,464,431 · +57.3%
- By 2100
- 1,576,181 · +69.3%
Race, ethnicity, and origin ACS 2023
- Neighborhood character
- Predominantly White (68%)
- Race & ethnicity
- White 68% Two or more races 12% Black 10% Hispanic / Latino 9% Asian 4%
- Hispanic origin (detail)
- Mexican 6%
- Common ancestry
- Italian 3% Lithuanian 3% Slovak 3%
- Foreign-born
- 7% · Canada, Vietnam, China
- Languages at home
- 88% English-only · Spanish 6% French/Haitian/Cajun 1% Vietnamese 1%
Political lean MEDSL · Multnomah
- 2024 margin
- Solid D (+62.1) · D 79.3% · R 17.2% · Other 3.5%
- 2008→2024 swing
- +6.0pp toward D · 2008: 56.1pp · 2024: 62.1pp
- All cycles
- 2024: D+62.1 2020: D+61.3 2016: D+58.3 2012: D+54.9 2008: D+56.1
Not yet ingested
- Civics
- —
Market trends
- HPI YoY
- ▼ -813.54%
- Current HPI
- 372.7719
- Rent YoY
- ▲ 0.52%
- Metro
- Portland-Vancouver-Hillsboro, OR-WA
- State GDP YoY
- ▲ 2.05%
- F500 in state
- 2
Industry mix (Fortune 500 HQ in OR)
| Industry | F500 HQs | Revenue |
|---|---|---|
| Consumer Goods | 1 | $51B |
|
||
Price history
1 event — show timeline
- 2026-04-17 Listed $124,999 RMLS
Property tax history
+7.0%/yrLatest (2022): $890 · +103.1% YoY. Source: county tax records.
Cash-flow waterfall
monthlySold comps — $/sqft
last 12 mo · ≤1 miLoading sold comps…