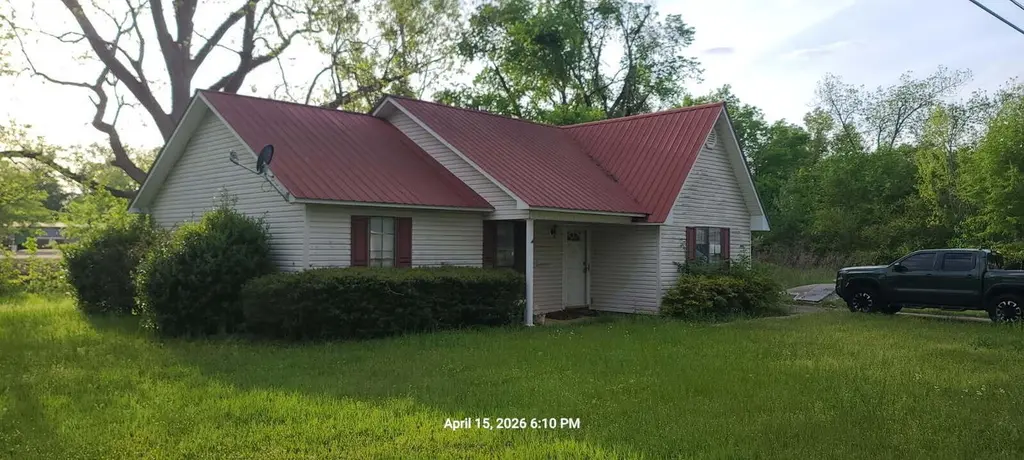
25 Central Ave · Ecru, MS
Flood risk 1/10 · Minimal
- FEMA flood zone
- X (unshaded)
- Chance of flooding over 30 yrs
- 0.0%
- Est. flood insurance / yr
- $507 – $1,088
Fire risk 5/10 · Moderate
- Est. fire insurance / yr
- $1,241 – $2,305
Heat risk 7/10 · Major
- Hot days now (above 108°F)
- 7 days/yr
- Hot days in 30 yrs
- 21 days/yr
Wind risk 6/10 · Moderate
- Chance of severe wind over 30 yrs
- 27.0%
Air-quality risk 1/10 · Minimal
- Unhealthy air days now
- 0 days/yr
- Unhealthy air days in 30 yrs
- 0 days/yr
Risk factors via First Street. Map © Google.
Why this score? — see what drove the C grade
The composite is a weighted blend of 9 inputs, each scored 0–100. Each bar is that input's sub-score; the figure is the points it added to the 100-point composite (weight × sub-score).
- Cash flow +17.6/30.0
- Appreciation +9.3/10.0
- ARV discount +7.5/15.0
- DSCR +5.5/10.0
- 1% rule +4.8/10.0
- Schools +3.7/10.0
- Livability +3.4/5.0
- Rent growth +2.5/5.0
- Condition / age +2.5/5.0
$99,900
🖨 Deal sheet (PDF) 📄 Offer letter ✓ Due diligence
Listing remarks
This home is a steal! Yes, it has had water damage in the house, but could be a great home. Low price has been factored in for repairs. Good location beside Tanglefoot Trail and corner of Main St.
Key facts
- 1 acre lot
- Built 1997
- Listed 26 days
Property features AI
Exterior
- Parking: Attached garage with 1 parking space
- Home design: Single-family residence (Traditional); One story
- Exterior features: 1-acre lot; Located beside Tanglefoot Trail; Subdivision: Other
Interior
- Bathrooms: 2 full bathrooms
- Interior features: Total of 5 rooms
Neighborhood map
What this means for you Summary
Snapshot
- This is a 3-bed/1.0-bath other listed at $100k.
Deal economics
- At list price, monthly cash flow is $79 ($952/yr) — positive.
- The deal already cash-flows at list — no discount required.
- To meet the 1% rule (rent ≥ 1% of price), the offer needs to be $98k (2.2% below list).
- Recommended offer: $98k (2.2% below list) — sets the bar for 1% rule.
Location & tenants
- Location reads 68/100 on livability (#64 in MS) — a middle-class / working-renter tenant base. Strengths: crime A+, cost of living A+, housing B+; Watch: amenities F, commute F, employment D-.
- Pontotoc County School District (rural): math 48% / reading 40% proficiency, ranked #31 of 130 in MS (top 24%) — families likely to look elsewhere, expect single-tenant / working-renter base with shorter leases.
- Zoned schools: North Pontotoc Elementary School (math 49% / reading 44%, grade D-, #87 of 375 statewide, top 23%, 743 students, 100% FRL); North Pontotoc Upper Elementary (math 56% / reading 36%, grade D+, #39 of 179 statewide, top 22%, 285 students, 99% FRL); North Pontotoc High School (math 27% / reading 37%, grade F, #80 of 197 statewide, top 42%, 513 students, 99% FRL) — zoned schools average 99% FRL vs 55% district-wide (44 pts higher); higher-poverty schools than district average — tighter screening recommended.
- Market conditions: 13 active listings in the ZIP; 86 units permitted in Pontotoc County in 2024 (60 in 5+ unit buildings).
Forward outlook
- In year one you build about $9k of equity ($691 loan paydown + $9k appreciation (8.6% local appreciation)).
- Pontotoc County population projected at +7% by 2050 — modest demand growth; plan on rents tracking national, not racing it.
- At projected returns (8.6% appreciation + 3.0% rent growth), your $28k cash investment doubles in ~3 years — after that, you're playing with house money.
- By year 4, paydown + projected appreciation supports a ~$32k cash-out refi (75% LTV) — recoverable capital for the next deal without selling this one.
Negotiation context
- It's been on market 26 days — a 2% lower offer ($98k) is reasonable based on typical stale-listing flexibility.
Risks & watch-outs
- Climate carrying-cost: major wind risk, 27% chance of damaging wind over 30y; moderate wildfire risk; extreme-heat days projected 7→21/yr by 2055 (HVAC capex compounding) — expect insurance premiums to compound above CPI over the hold.
Questions for the listing agent
- Is there a deadline driving the sale (1031 exchange, divorce, estate, relocation)? That informs how much negotiation room exists.
- Schools are D-rated, which usually means shorter tenancies and higher turnover. Who's the typical renter profile here, and what's been the actual vacancy rate?
- What's the average days-on-market for RENTAL listings here right now (not sales)? A rising rental-DOM trend means longer vacancies and softer asking-rent achievability than the comps imply.
- What's the recent tenant-quality profile in this submarket — average credit score on applications, eviction rate, late-payment / NSF rate, and stable-employment percentage? A property-management company in the area should have these aggregated.
- How much new for-sale + rental construction is in the pipeline within 1–3 miles? Heavy new supply typically softens prices + rents 12–24 months out; constrained supply supports both.
Investment metrics
- 1% rule
- 0.98% ✗
- Cap rate
- 7.25%
- Cash-on-cash
- 3.40%
- DSCR
- 1.15
- GRM
- 8.5
CMA / ARV
No comps found within radius.
Projected returns pro-forma
8.55% appreciation · 3.0% rent growth · sell at horizon
- IRR
- 23.8%
- Equity multiple
- 2.78×
- Total profit
- $49,772
- Equity at exit
- $79,673
- IRR
- 21.4%
- Equity multiple
- 6.04×
- Total profit
- $140,950
- Equity at exit
- $161,895
Cash invested: $27,972 (down + closing). Projections, not guarantees.
Landlord ↔ Tenant lean methodology
- Overall (STATE)
- 90 Strongly Landlord-Friendly
- State Mississippi
- 90 Strongly Landlord-Friendly · R+11
- County
- — inherits STATE
- City
- — inherits STATE
ZIP-level market 38841
- Home prices YoY
- 6.7%
- Active inventory
- 13
- Price-to-rent
- 8.5×
Monthly cashflow live
- Estimated rent
- $977 medium interval (Pro) →
- Mortgage (P&I)
- −$524
- Tax from tax record
- −$127 /mo · $1,524/yr
- Insurance
- −$42
- HOA
- −$0
- Vacancy / Maint / Mgmt
- −$205
- Net cashflow
- $79
Break-even live
Sensitivity live
| Price | -10% $136 | -5% $108 | +0% $79 | +5% $51 | +10% $23 |
|---|---|---|---|---|---|
| Rent | -10% $2 | -5% $41 | +0% $79 | +5% $118 | +10% $157 |
| Rate | -1.0pp $130 | -0.5pp $105 | base $79 | +0.5pp $53 | +1.0pp $27 |
UW: 25.0% down · 7.5% · 30yr · 1.5% tax · 5.0% vac · 8.0% maint · 8.0% mgmt
Financing live
Cash to close
- Down payment
- $24,975
- Closing costs
- $2,997
- Reserves months
- —
- Total cash needed
- —
Loan-product check · same deal, 3 products live
Conventional
25% down · 7.5% · 30yr
- Down + closing
- —
- Monthly P&I
- —
- Monthly cashflow
- —
- DSCR
- —
- Eligible?
- —
Personal DTI + credit; lowest rate.
DSCR
20% down · 8.5% · 30yr
- Down + closing
- —
- Monthly P&I
- —
- Monthly cashflow
- —
- DSCR
- —
- Eligible?
- —
No personal income docs; deal must DSCR.
Hard money
10% down · 12.0% · 12mo
- Down + closing
- —
- Monthly P&I
- —
- Monthly cashflow
- —
- DSCR
- —
- Eligible?
- —
Short-term bridge; refi at stabilization.
Listing history 7 events
-
2026-06-03status $99,900 Pending 26 DOM
-
2026-06-02days on market $99,900 Active 26 DOM
-
2026-06-01days on market $99,900 Active 25 DOM
-
2026-05-31days on market $99,900 Active 24 DOM
-
2026-05-30days on market $99,900 Active 23 DOM
-
2026-05-06$99,900 Active
-
2009-07-31soldstatus
ⓘ Source: listings_history table (triggers on properties + properties_extension) + one-shot
backfill from property_details.listing_events for pre-trigger history.
Tax reassessment forecast MS · Resets to sale price
- Current annual tax
- $1,524 · $127/mo
- Projected year-2 tax
- $1,524 · $127/mo
- Expected delta
- $0/yr ($0/mo · 0.0%)
ⓘ Screening estimate from a state-policy table — verify with the county assessor before closing.
Climate risk First Street
- Flood 1/10 Low FEMA zone X (unshaded) · 0% chance over 30 yrs
- Wildfire 5/10 Major
- Heat 7/10 Severe 7 d/yr ≥108°F today · 21 d/yr by 30 yrs out
- Wind 6/10 Major 27% chance of damaging wind over 30 yrs
- Air quality 1/10 Low 0 unhealthy d/yr today · 0 by 30 yrs out
Nearby sold comps map
Loading sold comps map…
Walkable amenities ~0.75 mi
Loading nearby amenities…
Taxation est. · year 1
- Rental income
- $11,724
- − Mortgage interest
- −$5,596
- − Property taxes
- −$1,524
- − Insurance
- −$500
- − Repairs & maintenance
- −$938
- − Management
- −$938
- − Depreciation
- −$2,906
- Taxable loss
- −$677
- Est. tax savings @ 24.0%
- +$163
- After-tax cash flow
- $1,115/yr
For passive investors: Depreciation is non-cash, so a rental often shows a tax loss while cash-flowing — sheltering income. Rental losses are passive: they offset passive income freely, and up to $25,000/yr can offset ordinary (W-2) income if you actively participate and your MAGI is under $100k (phasing out to $0 by $150k); unused losses carry forward. On sale, claimed depreciation is recaptured at up to 25%, and gains may owe capital-gains tax (a 1031 exchange can defer both). Figures are a year-1 estimate at your 24.0% rate — not tax advice; consult a CPA.
Schools (NCES district)
- District
- Pontotoc County School District
- NCES district ID
- 2803660
- Math proficiency
- 48% ▼ -7.00%
- Reading proficiency
- 40% ▼ -4.00%
- Median HH income
- $38,709
- Composite
- 36.77/100
- National rank
- #4572
- State rank
- #31 of 130 in MS
Livability — Ecru
- Score
- 68/100
- State rank
- #64
- US rank
- #9552
Category grades
Schools grade is shown separately in the Schools card above.
Census & demographics
- Census place
- Ecru, MS
- City population
- 4,057
- Population (ZIP)
- 4,057
Population outlook (Pontotoc County) Hauer SSP2
- Today (2025)
- 32,690 people
- By 2030
- 33,445 · +2.3%
- By 2040
- 34,588 · +5.8%
- By 2050
- 35,066 · +7.3%
- By 2075
- 35,241 · +7.8%
- By 2100
- 32,290 · -1.2%
Race, ethnicity, and origin ACS 2023
- Neighborhood character
- Predominantly White (69%)
- Race & ethnicity
- White 69% Hispanic / Latino 16% Black 13% Two or more races 2%
- Hispanic origin (detail)
- Mexican 3%
- Common ancestry
- Slovak 3% Lithuanian 1% Serbian 1%
- Foreign-born
- 8% · Canada
- Languages at home
- 86% English-only · Spanish 14%
Political lean MEDSL · Pontotoc
- 2024 margin
- Solid R (+67.7) · D 15.7% · R 83.5%
- 2008→2024 swing
- -15.3pp toward R · 2008: -52.4pp · 2024: -67.7pp
- All cycles
- 2024: R+67.7 2020: R+62.2 2016: R+62.0 2012: R+53.6 2008: R+52.4
Not yet ingested
- Civics
- —
Market trends
- HPI YoY
- ▲ 8.55%
- Current HPI
- 135.5769
- Rent YoY
- —
- Metro
- —
- State GDP YoY
- —
- F500 in state
- 0
Price history
2 events — show timeline
- 2026-05-06 Listed $99,900 NEMSBD
- 2009-07-31 Sold (Public Records) — Public Records
Cash-flow waterfall
monthlySold comps — $/sqft
last 12 mo · ≤1 miLoading sold comps…