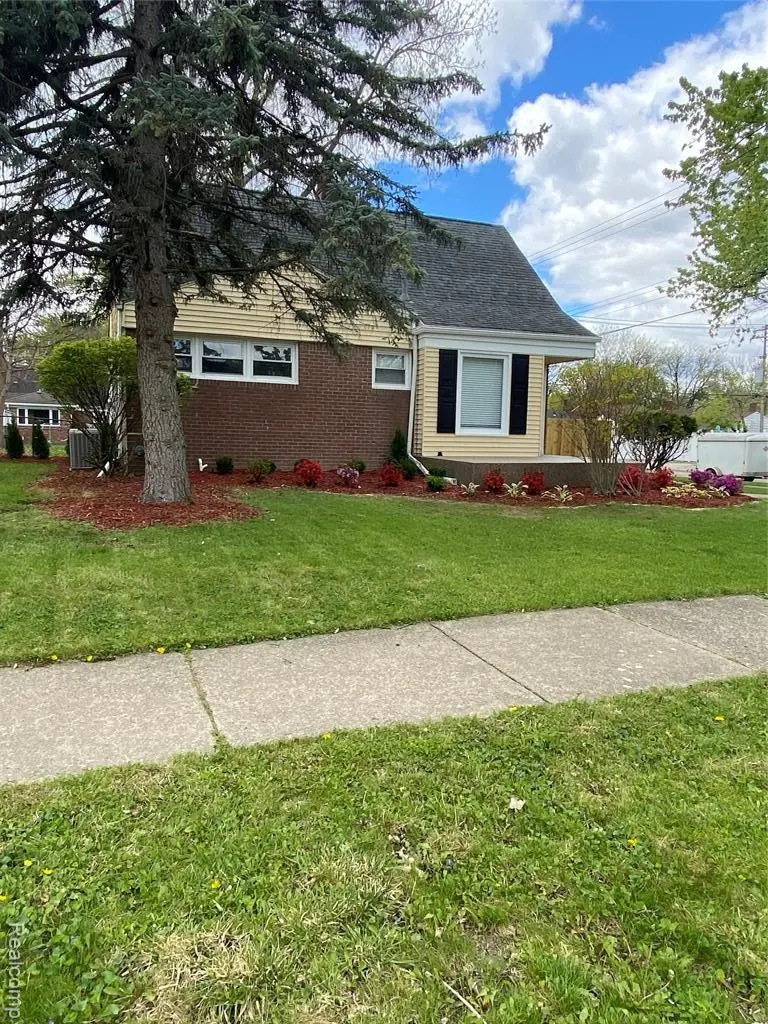
20202 Lancaster St · Harper Woods, MI
Flood risk 1/10 · Minimal
- FEMA flood zone
- X (unshaded)
- Chance of flooding over 30 yrs
- 0.0%
- Est. flood insurance / yr
- $507 – $1,088
Fire risk 1/10 · Minimal
- Est. fire insurance / yr
- $784 – $1,456
Heat risk 3/10 · Minor
- Hot days now (above 96°F)
- 7 days/yr
- Hot days in 30 yrs
- 15 days/yr
Wind risk 2/10 · Minimal
- Chance of severe wind over 30 yrs
- —
Air-quality risk 3/10 · Minor
- Unhealthy air days now
- 3 days/yr
- Unhealthy air days in 30 yrs
- 4 days/yr
Risk factors via First Street. Map © Google.
Why this score? — see what drove the D+ grade
The composite is a weighted blend of 9 inputs, each scored 0–100. Each bar is that input's sub-score; the figure is the points it added to the 100-point composite (weight × sub-score).
- Cash flow +19.2/30.0
- DSCR +6.1/10.0
- Schools +5.7/10.0
- 1% rule +4.1/10.0
- ARV discount +3.9/15.0
- Rent growth +3.8/5.0
- Livability +3.7/5.0
- Condition / age +2.5/5.0
- Appreciation +0.0/10.0
$174,900
🖨 Deal sheet 📄 Offer letter ✓ Due diligence
Listing remarks MLS
Wow! Completely remodeled 4 bedroom 2 full bath brick home with finished basement. Beautiful open lay out with updated kitchen and bathrooms. Brand new front porch. Private fully fenced backyard. Hurry Priced below market! Move in ready.
Key facts
- Finished basement
- Updated kitchen
- 8,712 sq ft lot
Tags
Property features AI
Exterior
- Parking: Detached 1-car garage
- Utilities: Public water; Public sewer
- Home design: Single-family residence; One and one-half story; Ground-level entry
- Construction: Brick and vinyl siding exterior; Block foundation; Above-grade finished area and additional finished lower level
- Exterior features: Paved road access; Lot approximately 0.2 acres (67.5 x 127.2)
Interior
- Kitchen: Dishwasher; Free-standing refrigerator; Gas cooktop
- Bedrooms: Total of 5 rooms (bedroom breakdown not specified)
- Bathrooms: 2 full bathrooms
- Heating & cooling: Forced air heating (natural gas); No central cooling
- Interior features: Finished walk-out daylight basement with sump pump
Neighborhood map
What this means for you Summary
Snapshot
- This is a 4-bed/2.0-bath single-family listed at $175k.
Deal economics
- At list price, monthly cash flow is $188 ($2k/yr) — positive.
- The deal already cash-flows at list — no discount required.
- To meet the 1% rule (rent ≥ 1% of price), the offer needs to be $159k (9.2% below list).
- Recommended offer: $159k (9.2% below list) — sets the bar for 1% rule.
Location & tenants
- Location reads 73/100 on livability (#199 in MI) — a middle-class / working-renter tenant base. Strengths: commute A+, cost of living A+, housing A+; Watch: employment D+, health & safety D+, schools D-.
- Grosse Pointe Public Schools (suburban): math 56% / reading 68% proficiency, ranked #24 of 540 in MI (top 4%) — acceptable for families but not a draw, mixed tenant base, ~2y average lease; only 13% free/reduced lunch — higher-income household profile.
- Market conditions: Rents rising fast (+5.1%/yr); 133 active listings in the ZIP; 22 comparable units currently listed for rent nearby; rentals at typical pace (median 18d on market — plan ~3-4 weeks tenant-placement turnaround); 2,639 units permitted in Wayne County in 2024 (1,216 in 5+ unit buildings).
- This rent runs 31% of the median local income ($62k/yr) — at the standard rent-burdened threshold; future hikes will face affordability resistance.
Forward outlook
- Local home prices are declining (-3.0%/yr); year-one equity from $1k of loan paydown is wiped out by about $5k of value loss. Plan a longer hold.
- Wayne County population projected at -17% by 2050 — secular population decline; favor cash flow + early exit over multi-decade hold.
Negotiation context
- Only 8 days on market — expect competitive offers; lowballing is unlikely to land.
- 17 sale attempts since 31y ago with the ask held roughly flat each time — persistent listings suggest the price (not the market) is what's stuck; bring a comps-based counter.
- Current owner paid $120k; 46% above their basis — modest negotiation headroom, anchor on the comps not their cost.
Risks & watch-outs
- Watch-outs: built in 1950 — expect roof / HVAC / electrical / plumbing capex.
Questions for the listing agent
- Built in 1950 — when were the roof, HVAC, electrical panel, plumbing, and water heater last replaced?
- Is there a deadline driving the sale (1031 exchange, divorce, estate, relocation)? That informs how much negotiation room exists.
- Schools are D-rated, which usually means shorter tenancies and higher turnover. Who's the typical renter profile here, and what's been the actual vacancy rate?
- Crime grade is F in this area — have there been break-ins, vandalism, or insurance claims at this property in the last 3 years? What carrier currently insures it and at what premium?
- The area grade is low — what's the realistic commute time and amenity access for the typical tenant pool here? Any planned neighborhood developments (good or bad) we should know about?
- What's the average days-on-market for RENTAL listings here right now (not sales)? A rising rental-DOM trend means longer vacancies and softer asking-rent achievability than the comps imply.
- What's the recent tenant-quality profile in this submarket — average credit score on applications, eviction rate, late-payment / NSF rate, and stable-employment percentage? A property-management company in the area should have these aggregated.
- How much new for-sale + rental construction is in the pipeline within 1–3 miles? Heavy new supply typically softens prices + rents 12–24 months out; constrained supply supports both.
Investment metrics
- 1% rule
- 0.91% ✗
- Cap rate
- 7.58%
- Cash-on-cash
- 4.61%
- DSCR
- 1.21
- GRM
- 9.2
CMA / ARV
- ARV (on-the-fly)
- $162,074
- Comps found
- 12
Show comp detail 12 sales within ~0.75 mi
| Address | Dist | Beds/Ba | Sqft | Sold | Price | $/sf | Match |
|---|---|---|---|---|---|---|---|
| 20260 Lancaster St | 0.05mi | 4/2.0 | 1,272 (+9%) | 1mo | $112,700 | $89 | 82 |
| 20703 Fleetwood Dr | 0.37mi | 3/1.0 (-1) | 1,200 (+3%) | 7mo | $180,000 | $150 | 64 |
| 20402 Kenmore Ave | 0.25mi | 3/1.5 (-1) | 1,055 (-10%) | 3mo | $110,000 | $104 | 63 |
| 20456 Lennon St | 0.25mi | 3/1.5 (-1) | 1,260 (+8%) | 6mo | $175,000 | $139 | 62 |
| 20602 Kenmore Ave | 0.35mi | 3/2.0 (-1) | 1,055 (-10%) | 3mo | $163,850 | $155 | 60 |
| 20860 Ridgemont Rd | 0.73mi | 4/2.5 | 1,180 (+1%) | 4mo | $40,000 | $34 | 58 |
| 20640 Fleetwood Dr | 0.30mi | 3/1.0 (-1) | 1,300 (+12%) | 1mo | $125,000 | $96 | 57 |
| 20631 Lochmoor St | 0.30mi | 3/2.5 (-1) | 1,311 (+12%) | 2mo | $219,000 | $167 | 57 |
| 20688 Fleetwood Dr | 0.35mi | 3/1.0 (-1) | 1,053 (-10%) | 3mo | $173,000 | $164 | 56 |
| 20672 Fleetwood Dr | 0.33mi | 3/1.0 (-1) | 1,031 (-12%) | 6mo | $115,000 | $112 | 51 |
| 20886 Hunt Club Dr | 0.53mi | 3/1.5 (-1) | 1,044 (-10%) | 7mo | $213,300 | $204 | 45 |
| 20842 Ridgemont Rd | 0.73mi | 3/1.0 (-1) | 1,001 (-14%) | 3mo | $85,000 | $85 | 31 |
Match score weights: distance 35% · size 25% · config 20% · recency 20%. Top-matched comps best support the ARV.
Projected returns pro-forma
-3.0% appreciation · 5.1% rent growth · sell at horizon
- IRR
- -7.0%
- Equity multiple
- 0.73×
- Total profit
- $-13,000
- Equity at exit
- $26,078
- IRR
- 4.8%
- Equity multiple
- 1.38×
- Total profit
- $18,522
- Equity at exit
- $15,122
Cash invested: $48,972 (down + closing). Projections, not guarantees.
Landlord ↔ Tenant lean methodology
- Overall (STATE)
- 62 Landlord-Friendly
- State Michigan
- 62 Landlord-Friendly · EVEN
- County
- — inherits STATE
- City
- — inherits STATE
ZIP-level market 48225
- Rents YoY
- 5.1%
- Active inventory
- 133
- Price-to-rent
- 9.2×
Monthly cashflow live
- Estimated rent
- $1,588 high interval (Pro) →
- Mortgage (P&I)
- −$917
- Tax from tax record
- −$76 /mo · $918/yr
- Insurance
- −$73
- HOA
- −$0
- Vacancy / Maint / Mgmt
- −$334
- Net cashflow
- $188
Break-even live
UW: 25.0% down · 7.5% · 30yr · 1.5% tax · 5.0% vac · 8.0% maint · 8.0% mgmt
Financing live
Cash to close
- Down payment
- $43,725
- Closing costs
- $5,247
- Reserves months
- —
- Total cash needed
- —
Loan-product check · same deal, 3 products live
Conventional
25% down · 7.5% · 30yr
- Down + closing
- —
- Monthly P&I
- —
- Monthly cashflow
- —
- DSCR
- —
- Eligible?
- —
Personal DTI + credit; lowest rate.
DSCR
20% down · 8.5% · 30yr
- Down + closing
- —
- Monthly P&I
- —
- Monthly cashflow
- —
- DSCR
- —
- Eligible?
- —
No personal income docs; deal must DSCR.
Hard money
10% down · 12.0% · 12mo
- Down + closing
- —
- Monthly P&I
- —
- Monthly cashflow
- —
- DSCR
- —
- Eligible?
- —
Short-term bridge; refi at stabilization.
Rent comps 22 comps
| Address | Beds | Baths | Sqft | Rent | $/sqft | DOM | Units | Dist |
|---|---|---|---|---|---|---|---|---|
| 20015 Lochmoor St Harper Woods, MI | 3.0 | 1.0 | 1006 | $1,500 | $1.49 | 16d | 1 | 0.09mi |
| 20270 Hollywood St Harper Woods, MI | 3.0 | 1.0 | 1228 | $1,650 | $1.34 | 1d | 1 | 0.52mi |
| 1992 Hawthorne Rd Grosse Pointe Woods, MI | 3.0 | 2.0 | 1071 | $2,100 | $1.96 | 10d | 1 | 0.93mi |
| 19152 Woodside St Harper Woods, MI | 3.0 | 1.0 | 916 | $1,500 | $1.64 | 17d | 1 | 0.95mi |
| 19661 Kenosha St Harper Woods, MI | 3.0 | 2.0 | 1000 | $1,400 | $1.40 | 24d | 1 | 0.96mi |
| 20461 Kingsville St Harper Woods, MI | 4.0 | 1.0 | 1100 | $1,399 | $1.27 | 15d | 1 | 1.09mi |
| 19365 Kingsville St Harper Woods, MI | 4.0 | 1.5 | 996 | $1,650 | $1.66 | 15d | 1 | 1.11mi |
| 19442 Kingsville St Harper Woods, MI | 3.0 | 1.0 | 1000 | $1,500 | $1.50 | 17d | 1 | 1.12mi |
| 19982 McCormick St Detroit, MI | 3.0 | 1.0 | 866 | $1,200 | $1.39 | 3d | 1 | 1.13mi |
| 19435 McCormick St Detroit, MI | 3.0 | 2.0 | 1148 | $1,300 | $1.13 | 17d | 1 | 1.14mi |
| 10985 Peerless St Detroit, MI | 3.0 | 1.0 | 1000 | $1,364 | $1.36 | 5d | 1 | 1.30mi |
| 16410 Edmore Dr Detroit, MI | 3.0 | 1.0 | 850 | $1,250 | $1.47 | 15d | 1 | 1.31mi |
| 10870 Marne St Detroit, MI | 3.0 | 1.0 | 1156 | $1,100 | $0.95 | 17d | 1 | 1.32mi |
| 16291 Eastburn St Detroit, MI | 3.0 | 1.0 | 1000 | $1,364 | $1.36 | 24d | 1 | 1.33mi |
| 20926 Moross Rd Grosse Pointe, MI | 3.0 | 1.0 | 1200 | $1,350 | $1.12 | 43d | 1 | 1.34mi |
| 16225 Manning St Detroit, MI | 4.0 | 2.0 | 1036 | $1,475 | $1.42 | 43d | 1 | 1.38mi |
| 12075 Rossiter St Detroit, MI | 3.0 | 1.0 | 1100 | $1,245 | $1.13 | 15d | 1 | 1.38mi |
| 12075 Rossiter St Detroit, MI | 3.0 | 1.0 | 1100 | $1,245 | $1.13 | 43d | 1 | 1.38mi |
| 16242 Bringard Dr Detroit, MI | 3.0 | 1.0 | 1350 | $1,300 | $0.96 | 5d | 1 | 1.38mi |
| 18530 Kingsville St Harper Woods, MI | 3.0 | 1.5 | 1396 | $1,375 | $0.98 | 17d | 1 | 1.39mi |
| 10542 Lanark St Detroit, MI | 3.0 | 1.0 | 1023 | $1,250 | $1.22 | 43d | 1 | 1.46mi |
| 19168 Berden St Grosse Pointe, MI | 3.0 | 1.0 | 1200 | $1,800 | $1.50 | 1d | 1 | 1.47mi |
Listing history 45 events
-
2026-05-12status Pending 237-char remark
Show marketing remark (237 chars)
Wow! Completely remodeled 4 bedroom 2 full bath brick home with finished basement. Beautiful open lay out with updated kitchen and bathrooms. Brand new front porch. Private fully fenced backyard. Hurry Priced below market! Move in ready.
-
2026-05-12status Pending
Show marketing remark (237 chars)
Wow! Completely remodeled 4 bedroom 2 full bath brick home with finished basement. Beautiful open lay out with updated kitchen and bathrooms. Brand new front porch. Private fully fenced backyard. Hurry Priced below market! Move in ready.
-
2026-05-06historical Accepting Backup Offers 237-char remark
Show marketing remark (237 chars)
Wow! Completely remodeled 4 bedroom 2 full bath brick home with finished basement. Beautiful open lay out with updated kitchen and bathrooms. Brand new front porch. Private fully fenced backyard. Hurry Priced below market! Move in ready.
-
2026-05-06historical Active Under Contract
Show marketing remark (237 chars)
Wow! Completely remodeled 4 bedroom 2 full bath brick home with finished basement. Beautiful open lay out with updated kitchen and bathrooms. Brand new front porch. Private fully fenced backyard. Hurry Priced below market! Move in ready.
-
2026-05-04$174,900 Active
Show marketing remark (237 chars)
Wow! Completely remodeled 4 bedroom 2 full bath brick home with finished basement. Beautiful open lay out with updated kitchen and bathrooms. Brand new front porch. Private fully fenced backyard. Hurry Priced below market! Move in ready.
-
2026-05-04$174,900 Active 237-char remark
Show marketing remark (237 chars)
Wow! Completely remodeled 4 bedroom 2 full bath brick home with finished basement. Beautiful open lay out with updated kitchen and bathrooms. Brand new front porch. Private fully fenced backyard. Hurry Priced below market! Move in ready.
-
2017-09-11historical
-
2017-09-11historical
-
2017-09-10status Active
-
2017-08-30status Pending
-
2017-08-14historical
-
2017-08-14status Active
-
2017-06-06status Pending
-
2017-05-31status Active
-
2017-03-22status Pending
-
2017-03-22status Pending
-
2017-03-22price $82,000
-
2017-03-22price $82,000
-
2017-03-22historical
-
2017-03-22historical
-
2017-02-08status Active
-
2017-01-20status Pending
-
2017-01-10$80,000 Active
-
2017-01-10$80,000 Active
-
2017-01-10$82,000
-
2017-01-10$82,000
-
2014-12-11historical
-
2014-12-10historical
-
2014-07-11$69,900 Active
-
2014-07-11$69,900
-
2006-03-28soldstatus $120,000
-
2006-02-28soldstatus $120,000
-
2006-02-28soldstatus $120,000
-
2006-02-18historical
-
2006-01-06historical
-
2006-01-06$125,876
-
2006-01-06$125,876
-
2006-01-06historical
-
2005-07-11$134,700
-
2005-07-11$134,700
-
1999-08-11soldstatus $127,000
-
1995-05-30soldstatus $75,000
-
1995-05-15soldstatus $75,000
-
1995-02-01historical
-
1995-01-31$72,800
ⓘ Source: listings_history table (triggers on properties + properties_extension) + one-shot
backfill from property_details.listing_events for pre-trigger history.
Tax reassessment forecast MI · Partial reset (capped growth)
- Current annual tax
- $918 · $76/mo
- Projected year-2 tax
- $1,806 · $150/mo
- Expected delta
- +$888/yr (+$74/mo · 96.8%)
ⓘ Screening estimate from a state-policy table — verify with the county assessor before closing.
Climate risk First Street
- Flood 1/10 Low FEMA zone X (unshaded) · 0% chance over 30 yrs
- Wildfire 1/10 Low
- Heat 3/10 Moderate 7 d/yr ≥96°F today · 15 d/yr by 30 yrs out
- Wind 2/10 Low
- Air quality 3/10 Moderate 3 unhealthy d/yr today · 4 by 30 yrs out
Nearby sold comps map
Loading sold comps map…
Walkable amenities ~0.75 mi
Loading nearby amenities…
Taxation est. · year 1
- Rental income
- $19,057
- − Mortgage interest
- −$9,797
- − Property taxes
- −$918
- − Insurance
- −$874
- − Repairs & maintenance
- −$1,525
- − Management
- −$1,525
- − Depreciation
- −$5,088
- Taxable loss
- −$669
- Est. tax savings @ 24.0%
- +$161
- After-tax cash flow
- $2,418/yr
For passive investors: Depreciation is non-cash, so a rental often shows a tax loss while cash-flowing — sheltering income. Rental losses are passive: they offset passive income freely, and up to $25,000/yr can offset ordinary (W-2) income if you actively participate and your MAGI is under $100k (phasing out to $0 by $150k); unused losses carry forward. On sale, claimed depreciation is recaptured at up to 25%, and gains may owe capital-gains tax (a 1031 exchange can defer both). Figures are a year-1 estimate at your 24.0% rate — not tax advice; consult a CPA.
Schools (NCES district)
- District
- Grosse Pointe Public Schools
- NCES district ID
- 2625740
- Math proficiency
- 56% ▼ -2.00%
- Reading proficiency
- 68% ▲ 2.00%
- Median HH income
- $89,975
- Composite
- 56.51/100
- National rank
- #1152
- State rank
- #24 of 540 in MI
Livability — Harper Woods
- Score
- 73/100
- State rank
- #199
- US rank
- #5054
Category grades
Schools grade is shown separately in the Schools card above.
Census & demographics
- Census place
- Harper Woods, MI
- County
- Wayne County · 1,562,939 people
- City population
- 16,098
- Metro
- Detroit-Warren-Dearborn, MI
- Population (ZIP)
- 16,098
- Household income
- $61,750
- Rent vs Own
- Severe rent burden
- 410.0
Population outlook (Wayne County) Hauer SSP2
- Today (2025)
- 1,675,273 people
- By 2030
- 1,620,300 · -3.3%
- By 2040
- 1,502,341 · -10.3%
- By 2050
- 1,384,039 · -17.4%
- By 2075
- 1,124,592 · -32.9%
- By 2100
- 881,193 · -47.4%
Race, ethnicity, and origin ACS 2023
- Neighborhood character
- Predominantly Black (65%)
- Race & ethnicity
- Black 65% White 28% Two or more races 4% Hispanic / Latino 1%
- Common ancestry
- Romanian 4% Lithuanian 1% German 1%
- Foreign-born
- 2% · Canada
- Languages at home
- 95% English-only · Arabic 2% Spanish 1%
Political lean MEDSL · Wayne
- 2024 margin
- Strong D (+29.0) · D 62.7% · R 33.7% · Other 3.6%
- 2008→2024 swing
- -20.5pp toward R · 2008: 49.5pp · 2024: 29.0pp
- All cycles
- 2024: D+29.0 2020: D+38.1 2016: D+37.3 2012: D+46.9 2008: D+49.5
Not yet ingested
- Civics
- —
Market trends
- HPI YoY
- ▼ -150.40%
- Current HPI
- 181.4961
- Rent YoY
- ▲ 5.10%
- Metro
- Detroit-Warren-Dearborn, MI
- State GDP YoY
- ▲ 1.37%
- F500 in state
- 28
Industry mix (Fortune 500 HQ in MI)
| Industry | F500 HQs | Revenue |
|---|---|---|
| Automotive Parts | 3 | $48B |
|
||
| Automotive | 2 | $372B |
|
||
| Chemicals | 1 | $45B |
|
||
| Automotive Retail | 1 | $29B |
|
||
| Healthcare / Medical Devices | 1 | $23B |
|
||
| Automotive Technology | 1 | $20B |
|
||
Price history
+140.2% since first listed45 events — show timeline
- 2026-05-12 Pending — MiRealSource-MiMLS
- 2026-05-12 Pending — REALCOMP
- 2026-05-06 Contingent — MiRealSource-MiMLS
- 2026-05-06 Contingent — REALCOMP
- 2026-05-04 Listed $174,900 REALCOMP
- 2026-05-04 Listed $174,900 MiRealSource-MiMLS
- 2017-09-11 Listing Removed — REALCOMP
- 2017-09-11 Listing Removed — MiRealSource-MiMLS
- 2017-09-10 Relisted — MiRealSource-MiMLS
- 2017-08-30 Pending — MiRealSource-MiMLS
- 2017-08-14 Listing Removed — REALCOMP
- 2017-08-14 Relisted — MiRealSource-MiMLS
- 2017-06-06 Pending — MiRealSource-MiMLS
- 2017-05-31 Relisted — MiRealSource-MiMLS
- 2017-03-22 Pending — MiRealSource-MiMLS
- 2017-03-22 Pending — REALCOMP
- 2017-03-22 Listing Removed — MiRealSource-MiMLS
- 2017-03-22 Listing Removed — MiRealSource-MiMLS
- 2017-03-22 Price Changed $82,000 MiRealSource-MiMLS
- 2017-03-22 Price Changed $82,000 REALCOMP
- 2017-02-08 Relisted — REALCOMP
- 2017-01-20 Pending — REALCOMP
- 2017-01-10 Listed $80,000 REALCOMP
- 2017-01-10 Listed $80,000 MiRealSource-MiMLS
- 2017-01-10 Listed $82,000 MiRealSource-MiMLS
- 2017-01-10 Listed $82,000 REALCOMP
- 2014-12-11 Listing Removed — REALCOMP
- 2014-12-10 Listing Removed — MiRealSource-MiMLS
- 2014-07-11 Listed $69,900 MiRealSource-MiMLS
- 2014-07-11 Listed $69,900 REALCOMP
- 2006-03-28 Sold (Public Records) $120,000 Public Records
- 2006-02-28 Sold (MLS) $120,000 REALCOMP
- 2006-02-28 Sold (MLS) $120,000 MiRealSource-MiMLS
- 2006-02-18 Listing Removed — MiRealSource-MiMLS
- 2006-01-06 Listing Removed — REALCOMP
- 2006-01-06 Listed $125,876 REALCOMP
- 2006-01-06 Listed $125,876 MiRealSource-MiMLS
- 2006-01-06 Listing Removed — MiRealSource-MiMLS
- 2005-07-11 Listed $134,700 REALCOMP
- 2005-07-11 Listed $134,700 MiRealSource-MiMLS
- 1999-08-11 Sold (Public Records) $127,000 Public Records
- 1995-05-30 Sold (Public Records) $75,000 Public Records
- 1995-05-15 Sold (MLS) $75,000 MiRealSource-MiMLS
- 1995-02-01 Listing Removed — MiRealSource-MiMLS
- 1995-01-31 Listed $72,800 MiRealSource-MiMLS
Property tax history
-7.8%/yrLatest (2025): $918 · -75.9% YoY. Source: county tax records.
Cash-flow waterfall
monthlySold comps — $/sqft
last 12 mo · ≤1 miLoading sold comps…