12035 Stevens Ave · Becker, MN
Flood risk 1/10 · Minimal
- FEMA flood zone
- X (unshaded)
- Chance of flooding over 30 yrs
- 0.0%
- Est. flood insurance / yr
- $507 – $1,088
Fire risk 4/10 · Minor
- Est. fire insurance / yr
- $888 – $1,650
Heat risk 2/10 · Minimal
- Hot days now (above 98°F)
- 7 days/yr
- Hot days in 30 yrs
- 14 days/yr
Wind risk 2/10 · Minimal
- Chance of severe wind over 30 yrs
- —
Air-quality risk 2/10 · Minimal
- Unhealthy air days now
- 2 days/yr
- Unhealthy air days in 30 yrs
- 2 days/yr
Risk factors via First Street. Map © Google.
Why this score? — see what drove the B grade
The composite is a weighted blend of 9 inputs, each scored 0–100. Each bar is that input's sub-score; the figure is the points it added to the 100-point composite (weight × sub-score).
- Cash flow +30.0/30.0
- 1% rule +10.0/10.0
- DSCR +10.0/10.0
- ARV discount +7.5/15.0
- Schools +4.9/10.0
- Condition / age +4.0/5.0
- Livability +3.8/5.0
- Rent growth +2.5/5.0
- Appreciation +0.0/10.0
$60,000
🖨 Deal sheet 📄 Offer letter ✓ Due diligence
Listing remarks
Looking for a beautiful and completely reliable home in the highly desirable Becker Estates community? This spacious 16x80 single-wide is turn-key and ready for its next owner. CRITICAL BUYER RULES & acirc; & euro; & ldquo; PLEASE READ BEFORE REPLYING: Buyers must have cash in hand or prequalified letter. PARK APPROVAL REQUIRED. Any buyer must apply, pass a background/credit check, and be approved by Becker Estates management. NO rent-to-own, NO contract for deed, NO owner financing. THE BIG UPGRADES: & acirc; & euro; & cent; NEW ROOF (Installed 2022) & acirc; & euro; & ldquo; Only 4 years old! Saves you thousands in future maintenance costs and provide
Key facts
- Massive storage
- Reliable mechanicals
- New roof
Tags
Neighborhood map
What this means for you Summary
Snapshot
- This is a 3-bed/2.0-bath single-family listed at $60k. Condition is rated good.
Deal economics
- At list price, monthly cash flow is $1k ($16k/yr) — positive.
- The deal already cash-flows at list — no discount required.
- Meets the 1% rule at list price ($2k rent vs $60k).
- Recommended offer: $59k (1.5% below list) — sets the bar for market timing.
- Cap rate 32.3% vs local median 3.0% in Becker — top-decile yield for the area; either an underpriced asset or a hidden risk that comps aren't pricing in. Stress-test before assuming the spread holds.
Location & tenants
- Location reads 75/100 on livability (#181 in MN, #3,909 nationally) — a middle-class / working-renter tenant base. Strengths: crime A+, employment A+, housing A+; Watch: amenities F, commute F.
- Becker Public School District (town): math 52% / reading 56% proficiency, ranked #61 of 301 in MN (top 20%) — acceptable for families but not a draw, mixed tenant base, ~2y average lease; only 14% free/reduced lunch — higher-income household profile.
- Market conditions: 74 active listings in the ZIP; 1 comparable units currently listed for rent nearby; 334 units permitted in Sherburne County in 2024 (58 in 5+ unit buildings).
Forward outlook
- Local home prices are declining (-3.0%/yr); year-one equity from $415 of loan paydown is wiped out by about $2k of value loss. Plan a longer hold.
- At projected returns (-3.0% appreciation + 3.0% rent growth), your $17k cash investment doubles in ~2 years — after that, you're playing with house money.
Negotiation context
- It's been on market 15 days — a 2% lower offer ($59k) is reasonable based on typical stale-listing flexibility.
Questions for the listing agent
- Is there a deadline driving the sale (1031 exchange, divorce, estate, relocation)? That informs how much negotiation room exists.
- Schools are B-rated — typically a magnet for longer-tenancy family renters. What's the average tenant stay here, and is there a school-zone premium baked into asking?
- What's the average days-on-market for RENTAL listings here right now (not sales)? A rising rental-DOM trend means longer vacancies and softer asking-rent achievability than the comps imply.
- What's the recent tenant-quality profile in this submarket — average credit score on applications, eviction rate, late-payment / NSF rate, and stable-employment percentage? A property-management company in the area should have these aggregated.
- How much new for-sale + rental construction is in the pipeline within 1–3 miles? Heavy new supply typically softens prices + rents 12–24 months out; constrained supply supports both.
Investment metrics
- 1% rule
- 3.50% ✓
- Cap rate
- 32.26%
- Cash-on-cash
- 92.75%
- DSCR
- 5.13
- GRM
- 2.4
CMA / ARV
No comps found within radius.
Projected returns pro-forma
-3.0% appreciation · 3.0% rent growth · sell at horizon
- IRR
- 93.5%
- Equity multiple
- 5.34×
- Total profit
- $72,979
- Equity at exit
- $8,946
- IRR
- 96.3%
- Equity multiple
- 11.12×
- Total profit
- $170,036
- Equity at exit
- $5,188
Cash invested: $16,800 (down + closing). Projections, not guarantees.
Landlord ↔ Tenant lean methodology
- Overall (STATE)
- 46 Balanced
- State Minnesota
- 46 Balanced · D+2
- County
- — inherits STATE
- City
- — inherits STATE
ZIP-level market 55308
- Home prices YoY
- -23.9%
- Active inventory
- 74
- Price-to-rent
- 2.4×
Monthly cashflow live
- Estimated rent
- $2,100 medium interval (Pro) →
- Mortgage (P&I)
- −$315
- Tax from tax record
- −$21 /mo · $250/yr
- Insurance
- −$25
- HOA
- −$0
- Vacancy / Maint / Mgmt
- −$441
- Net cashflow
- $1,299
Break-even live
UW: 25.0% down · 7.5% · 30yr · 1.5% tax · 5.0% vac · 8.0% maint · 8.0% mgmt
Financing live
Cash to close
- Down payment
- $15,000
- Closing costs
- $1,800
- Reserves months
- —
- Total cash needed
- —
Loan-product check · same deal, 3 products live
Conventional
25% down · 7.5% · 30yr
- Down + closing
- —
- Monthly P&I
- —
- Monthly cashflow
- —
- DSCR
- —
- Eligible?
- —
Personal DTI + credit; lowest rate.
DSCR
20% down · 8.5% · 30yr
- Down + closing
- —
- Monthly P&I
- —
- Monthly cashflow
- —
- DSCR
- —
- Eligible?
- —
No personal income docs; deal must DSCR.
Hard money
10% down · 12.0% · 12mo
- Down + closing
- —
- Monthly P&I
- —
- Monthly cashflow
- —
- DSCR
- —
- Eligible?
- —
Short-term bridge; refi at stabilization.
Rent comps 1 comps
| Address | Beds | Baths | Sqft | Rent | $/sqft | DOM | Units | Dist |
|---|---|---|---|---|---|---|---|---|
| 13896 Birdie Ln SE Becker, MN | 1.0–2.0 | 1.0–2.0 | 986 | $2,100 | $2.13 | 1d | 5 | 0.52mi |
Listing history 10 events
-
2026-06-18days on market $60,000 Active 15 DOM
-
2026-06-17days on market $60,000 Active 14 DOM
-
2026-06-16days on market $60,000 Active 13 DOM
-
2026-06-15days on market $60,000 Active 12 DOM
-
2026-06-13days on market $60,000 Active 10 DOM
-
2026-06-09days on market $60,000 Active 6 DOM
-
2026-06-08days on market $60,000 Active 5 DOM
-
2026-06-07days on market $60,000 Active 4 DOM
-
2026-06-04remarks 663-char remark
-
2026-06-04$60,000 Active 1 DOM
ⓘ Source: listings_history table (triggers on properties + properties_extension) + one-shot
backfill from property_details.listing_events for pre-trigger history.
Tax reassessment forecast MN · Partial reset (capped growth)
- Current annual tax
- $250 · $21/mo
- Projected year-2 tax
- $461 · $38/mo
- Expected delta
- +$211/yr (+$18/mo · 84.4%)
ⓘ Screening estimate from a state-policy table — verify with the county assessor before closing.
Climate risk First Street
- Flood 1/10 Low FEMA zone X (unshaded) · 0% chance over 30 yrs
- Wildfire 4/10 Moderate
- Heat 2/10 Low 7 d/yr ≥98°F today · 14 d/yr by 30 yrs out
- Wind 2/10 Low
- Air quality 2/10 Low 2 unhealthy d/yr today · 2 by 30 yrs out
Nearby sold comps map
Loading sold comps map…
Walkable amenities ~0.75 mi
Loading nearby amenities…
Taxation est. · year 1
- Rental income
- $25,200
- − Mortgage interest
- −$3,361
- − Property taxes
- −$250
- − Insurance
- −$300
- − Repairs & maintenance
- −$2,016
- − Management
- −$2,016
- − Depreciation
- −$1,745
- Taxable income
- $15,512
- Est. tax owed @ 24.0%
- −$3,723
- After-tax cash flow
- $11,859/yr
For passive investors: Depreciation is non-cash, so a rental often shows a tax loss while cash-flowing — sheltering income. Rental losses are passive: they offset passive income freely, and up to $25,000/yr can offset ordinary (W-2) income if you actively participate and your MAGI is under $100k (phasing out to $0 by $150k); unused losses carry forward. On sale, claimed depreciation is recaptured at up to 25%, and gains may owe capital-gains tax (a 1031 exchange can defer both). Figures are a year-1 estimate at your 24.0% rate — not tax advice; consult a CPA.
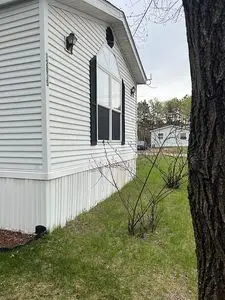
Condition & rehab AI · 1 photo
This single-family home in Becker MN is in good condition with a new roof and minimal maintenance needed. It's turn-key and ready for its next owner.
Value-add opportunities
- Both Landscaping — Enhances curb appeal and adds value
- Both Painting exterior — Fresh paint can improve curb appeal and value
- Both Landscaping and curb appeal — Improves overall appearance and value
Renovation cost estimate screening
Value-add ROI direction
- Both Landscaping — Enhances curb appeal and adds value ↑
- Both Painting exterior — Fresh paint can improve curb appeal and value ↑
- Both Landscaping and curb appeal — Improves overall appearance and value ↑
ⓘ Cost ranges are severity-bucket heuristics (US national rule-of-thumb). Get contractor quotes + a written scope before underwriting a rehab budget.
Schools (NCES district)
- District
- Becker Public School District
- NCES district ID
- 2703870
- Math proficiency
- 52% ▼ -14.00%
- Reading proficiency
- 56% ▼ -9.00%
- Median HH income
- $79,776
- Composite
- 48.94/100
- National rank
- #2076
- State rank
- #61 of 301 in MN
Livability — Becker
- Score
- 75/100
- State rank
- #181
- US rank
- #3909
Category grades
Schools grade is shown separately in the Schools card above.
Census & demographics
- Census place
- Becker, MN
- Population (ZIP)
- 9,788
Population outlook (Sherburne County) Hauer SSP2
- Today (2025)
- 97,402 people
- By 2030
- 99,341 · +2.0%
- By 2040
- 101,188 · +3.9%
- By 2050
- 99,214 · +1.9%
- By 2075
- 88,700 · -8.9%
- By 2100
- 72,241 · -25.8%
Race, ethnicity, and origin ACS 2023
- Neighborhood character
- Predominantly White (96%)
- Race & ethnicity
- White 96% Two or more races 3%
- Common ancestry
- Portuguese 12% Romanian 4% Lithuanian 4%
- Foreign-born
- 1% · Canada
- Languages at home
- 99% English-only · Russian/Polish/Slavic 1%
Political lean MEDSL · Sherburne
- 2024 margin
- Solid R (+34.9) · D 31.7% · R 66.6% · Other 1.7%
- 2008→2024 swing
- -16.7pp toward R · 2008: -18.2pp · 2024: -34.9pp
- All cycles
- 2024: R+34.9 2020: R+32.6 2016: R+37.0 2012: R+22.1 2008: R+18.2
Not yet ingested
- Civics
- —
Market trends
- HPI YoY
- ▼ -77.25%
- Current HPI
- 246.5549
- Rent YoY
- —
- Metro
- —
- State GDP YoY
- ▲ 2.41%
- F500 in state
- 34
Industry mix (Fortune 500 HQ in MN)
| Industry | F500 HQs | Revenue |
|---|---|---|
| Healthcare | 2 | $407B |
|
||
| Retail | 2 | $150B |
|
||
| Consumer Goods | 2 | $32B |
|
||
| Industrial Machinery | 2 | $6B |
|
||
| Agriculture | 1 | $40B |
|
||
| Healthcare / Medical Devices | 1 | $32B |
|
||
Price history
1 event — show timeline
- 2026-06-04 Listed $60,000 FSBO.com
Property tax history
-29.0%/yrLatest (2025): $250 · -0.8% YoY. Source: county tax records.
Cash-flow waterfall
monthlySold comps — $/sqft
last 12 mo · ≤1 miLoading sold comps…