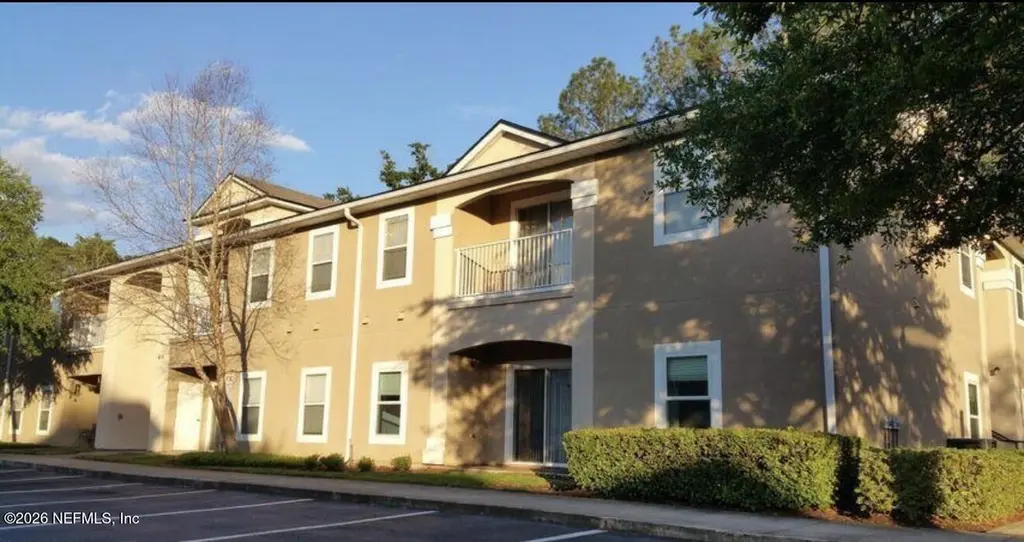
6111 Maggies Cir #107 · Jacksonville, FL
Flood risk 1/10 · Minimal
- FEMA flood zone
- X (unshaded)
- Chance of flooding over 30 yrs
- 0.0%
- Est. flood insurance / yr
- $507 – $1,088
Fire risk 4/10 · Minor
- Est. fire insurance / yr
- $947 – $1,759
Heat risk 8/10 · Major
- Hot days now (above 107°F)
- 7 days/yr
- Hot days in 30 yrs
- 19 days/yr
Wind risk 9/10 · Severe
- Chance of severe wind over 30 yrs
- 99.0%
Air-quality risk 3/10 · Minor
- Unhealthy air days now
- 3 days/yr
- Unhealthy air days in 30 yrs
- 3 days/yr
Risk factors via First Street. Map © Google.
Why this score? — see what drove the D grade
The composite is a weighted blend of 9 inputs, each scored 0–100. Each bar is that input's sub-score; the figure is the points it added to the 100-point composite (weight × sub-score).
- Cash flow +11.2/30.0
- ARV discount +7.5/15.0
- 1% rule +6.2/10.0
- Livability +4.2/5.0
- Schools +3.9/10.0
- DSCR +3.3/10.0
- Rent growth +3.1/5.0
- Condition / age +2.5/5.0
- Appreciation +0.0/10.0
$139,999
🖨 Deal sheet (PDF) 📄 Offer letter ✓ Due diligence
Listing remarks MLS
Welcome to this charming 3 bedroom 2 bath end unit condo with 10 ft. ceilings on ground level in Nature's hideaway. Community is conveniently located near downtown Jacksonville, Orange Park and NAS. Community is surrounded by nature, has a community pool and playground. Enjoy maintenance free living. Exterior is covered by the HOA!
Key facts
- Gated community
- Community pool
- Oversized kitchen
Tags
Property features AI
Finance
- HOA & community: Homeowners association with a $295 monthly fee; Not a senior community
Exterior
- Parking: Parking lot
- Utilities: Electricity connected; Sewer connected; Water connected
- Home design: Condominium (property attached); 2 total stories; Entry level: 1
- Exterior features: Condominium on a 0.01-acre lot; No private pool
Interior
- Kitchen: Dishwasher; Microwave; Refrigerator
- Bedrooms: 3 bedrooms
- Bathrooms: 2 full bathrooms
- Heating & cooling: Central heating; Central air conditioning
- Interior features: Ceiling fans; Primary bathroom with tub and shower; Split bedroom layout; Walk-in closet(s)
- Laundry & utility: Washer; Dryer
Neighborhood map
What this means for you Summary
Snapshot
- This is a 3-bed/2.0-bath condo listed at $140k.
Deal economics
- At list price, monthly cash flow is $-53 ($-640/yr) — negative.
- To cash-flow at today's rent, offer at most $131k (6.7% below list).
- Meets the 1% rule at list price ($2k rent vs $140k).
- Recommended offer: $131k (6.7% below list) — sets the bar for cash-flow.
- Cap rate 5.8% vs local median 3.9% in Jacksonville — top-decile yield for the area; either an underpriced asset or a hidden risk that comps aren't pricing in. Stress-test before assuming the spread holds.
Location & tenants
- Location reads 83/100 on livability (#50 in FL, #911 nationally) — a professional / high-income tenant draw. Strengths: amenities A+, commute A+, housing A+.
- Duval (urban): math 46% / reading 45% proficiency, ranked #48 of 73 in FL (top 66%) — families likely to look elsewhere, expect single-tenant / working-renter base with shorter leases.
- Zoned schools: Sadie T. Tillis Elementary School (math 27% / reading 20%, grade F, #2,061 of 2,144 statewide, top 96%, 483 students, 79% FRL); Joseph Stilwell Middle School (math 31% / reading 33%, grade F, #448 of 571 statewide, top 79%, 612 students, 68% FRL); Westside High School (math 26% / reading 19%, grade F, #539 of 667 statewide, top 81%, 1,583 students, 63% FRL) — zoned schools average 70% FRL vs 49% district-wide (21 pts higher); higher-poverty schools than district average — tighter screening recommended.
- Zoned-school proficiency averages 26% at this address vs 46% district-wide (-20 pts) — the specific schools serving this property underperform the Duval average; the district grade overstates school quality for this exact location.
- Market conditions: Rents rising (+2.2%/yr); 353 active listings in the ZIP; 40 comparable units currently listed for rent nearby; rentals at typical pace (median 19d on market — plan ~3-4 weeks tenant-placement turnaround); 6,503 units permitted in Duval County in 2024 (1,131 in 5+ unit buildings).
- This rent runs 30% of the median local income ($62k/yr) — at the standard rent-burdened threshold; future hikes will face affordability resistance.
Forward outlook
- Local home prices are declining (-3.0%/yr); year-one equity from $968 of loan paydown is wiped out by about $4k of value loss. Plan a longer hold.
- Duval County population projected at +19% by 2050 — long-run rental-demand tailwind backs the buy-and-hold thesis.
Negotiation context
- It's been on market 15 days — a 2% lower offer ($138k) is reasonable based on typical stale-listing flexibility.
- 2 sale attempts since 5y ago with the ask held roughly flat each time — persistent listings suggest the price (not the market) is what's stuck; bring a comps-based counter.
Risks & watch-outs
- Climate carrying-cost: severe wind risk, 99% chance of damaging wind over 30y; extreme-heat days projected 7→19/yr by 2055 (HVAC capex compounding) — expect insurance premiums to compound above CPI over the hold.
Questions for the listing agent
- What do current leases actually rent for vs. the listed asking? Can we see a recent rent roll and the last 12 months of T-12 income?
- What does the HOA fee cover, when was the last increase, and are there any pending special assessments or reserve-fund shortfalls?
- Any open or pending special assessments — roof, HVAC, plumbing, elevator, façade? What's the per-unit balance and payoff schedule, and is the seller paying it off at close or rolling it to the buyer?
- Is there a deadline driving the sale (1031 exchange, divorce, estate, relocation)? That informs how much negotiation room exists.
- Schools are B-rated — typically a magnet for longer-tenancy family renters. What's the average tenant stay here, and is there a school-zone premium baked into asking?
- The area grade is low — what's the realistic commute time and amenity access for the typical tenant pool here? Any planned neighborhood developments (good or bad) we should know about?
- What's the average days-on-market for RENTAL listings here right now (not sales)? A rising rental-DOM trend means longer vacancies and softer asking-rent achievability than the comps imply.
- What's the recent tenant-quality profile in this submarket — average credit score on applications, eviction rate, late-payment / NSF rate, and stable-employment percentage? A property-management company in the area should have these aggregated.
- How much new apartment / multifamily construction is in the pipeline within 1–3 miles? Heavy new supply (>2% of stock underway) typically softens rents 12–24 months out; light construction supports rent growth.
Investment metrics
- 1% rule
- 1.12% ✓
- Cap rate
- 5.84%
- Cash-on-cash
- -1.63%
- DSCR
- 0.93
- GRM
- 7.4
CMA / ARV
No comps found within radius.
Projected returns pro-forma
-3.0% appreciation · 2.25% rent growth · sell at horizon
- IRR
- -19.9%
- Equity multiple
- 0.31×
- Total profit
- $-27,035
- Equity at exit
- $20,874
- IRR
- -14.7%
- Equity multiple
- 0.19×
- Total profit
- $-31,757
- Equity at exit
- $12,105
Cash invested: $39,200 (down + closing). Projections, not guarantees.
Landlord ↔ Tenant lean methodology
- Overall (STATE)
- 87 Strongly Landlord-Friendly
- State Florida
- 87 Strongly Landlord-Friendly · R+3
- County
- — inherits STATE
- City
- — inherits STATE
ZIP-level market 32244
- Home prices YoY
- -17.8%
- Rents YoY
- 2.2%
- Active inventory
- 353
- Price-to-rent
- 7.4×
Monthly cashflow live
- Estimated rent
- $1,567 high interval (Pro) →
- Mortgage (P&I)
- −$734
- Tax from tax record
- −$204 /mo · $2,447/yr
- Insurance
- −$58
- HOA
- −$295
- Vacancy / Maint / Mgmt
- −$329
- Net cashflow
- $-53
Break-even live
Sensitivity live
| Price | -10% $26 | -5% $-14 | +0% $-53 | +5% $-93 | +10% $-133 |
|---|---|---|---|---|---|
| Rent | -10% $-177 | -5% $-115 | +0% $-53 | +5% $9 | +10% $70 |
| Rate | -1.0pp $17 | -0.5pp $-18 | base $-53 | +0.5pp $-90 | +1.0pp $-127 |
UW: 25.0% down · 7.5% · 30yr · 1.5% tax · 5.0% vac · 8.0% maint · 8.0% mgmt
Financing live
Cash to close
- Down payment
- $35,000
- Closing costs
- $4,200
- Reserves months
- —
- Total cash needed
- —
Loan-product check · same deal, 3 products live
Conventional
25% down · 7.5% · 30yr
- Down + closing
- —
- Monthly P&I
- —
- Monthly cashflow
- —
- DSCR
- —
- Eligible?
- —
Personal DTI + credit; lowest rate.
DSCR
20% down · 8.5% · 30yr
- Down + closing
- —
- Monthly P&I
- —
- Monthly cashflow
- —
- DSCR
- —
- Eligible?
- —
No personal income docs; deal must DSCR.
Hard money
10% down · 12.0% · 12mo
- Down + closing
- —
- Monthly P&I
- —
- Monthly cashflow
- —
- DSCR
- —
- Eligible?
- —
Short-term bridge; refi at stabilization.
Rent comps 40 comps
| Address | Beds | Baths | Sqft | Rent | $/sqft | DOM | Units | Dist |
|---|---|---|---|---|---|---|---|---|
| 6111 Maggies Cir #107 Jacksonville, FL | 3.0 | 2.0 | 1335 | $1,350 | $1.01 | 25d | 1 | 0.01mi |
| 6112 Maggies Cir #108 Jacksonville, FL | 3.0 | 2.0 | 1335 | $1,375 | $1.03 | 25d | 1 | 0.04mi |
| 6105 Maggies Cir Jacksonville, FL | 2.0–3.0 | 2.0 | 1121 | $1,445 | $1.29 | 19d | 2 | 0.04mi |
| 6105 Maggies Cir #115 Jacksonville, FL | 3.0 | 2.0 | 1335 | $1,425 | $1.07 | 3d | 1 | 0.04mi |
| 6051 Maggies Cir #107 Jacksonville, FL | 3.0 | 2.0 | 1335 | $1,400 | $1.05 | 23d | 1 | 0.06mi |
| 6100 Maggies Cir #103 Jacksonville, FL | 2.0 | 2.0 | 907 | $1,300 | $1.43 | 14d | 1 | 0.07mi |
| 6099 Maggies Cir #101 Jacksonville, FL | 3.0 | 2.0 | 1335 | $1,650 | $1.24 | 19d | 1 | 0.09mi |
| 6094 Maggies Cir #107 Jacksonville, FL | 3.0 | 2.0 | 1335 | $1,425 | $1.07 | 16d | 1 | 0.09mi |
| 6063 Maggies Cir Jacksonville, FL | 2.0–3.0 | 2.0 | 1121 | $1,350 | $1.20 | 18d | 2 | 0.10mi |
| 6063 Maggies Cir #110 Jacksonville, FL | 3.0 | 2.0 | 1335 | $1,350 | $1.01 | 6d | 1 | 0.10mi |
| 6087 Maggies Cir #104 Jacksonville, FL | 2.0 | 2.0 | 1099 | $1,275 | $1.16 | 25d | 1 | 0.13mi |
| 6433 Breezy Oaks Way Jacksonville, FL | 2.0 | 2.0 | 952 | $1,295 | $1.36 | 25d | 1 | 0.47mi |
| 6136 Blanding Blvd Jacksonville, FL | 1.0–3.0 | 1.0–2.0 | 1030 | $2,020 | $1.96 | 3d | 9 | 0.50mi |
| 5983 Ortega Lake Dr Unit 1 Jacksonville, FL | 3.0 | 2.5 | 1400 | $1,950 | $1.39 | 25d | 1 | 0.50mi |
| 6457 Breezy Oaks Way Jacksonville, FL | 2.0 | 2.0 | 952 | $1,275 | $1.34 | 12d | 1 | 0.52mi |
| 6463 Breezy Oaks Way Jacksonville, FL | 2.0 | 2.0 | 952 | $1,295 | $1.36 | 9d | 1 | 0.53mi |
| 6428 Hannah Stables Dr Jacksonville, FL | 3.0 | 2.0 | 1613 | $1,800 | $1.12 | 3d | 1 | 0.63mi |
| 6517 Breezy Oaks Way Jacksonville, FL | 2.0 | 2.0 | 952 | $1,295 | $1.36 | 25d | 1 | 0.63mi |
| 6523 Breezy Oaks Way Jacksonville, FL | 2.0 | 2.0 | 952 | $1,295 | $1.36 | 19d | 1 | 0.64mi |
| 6637 Gentle Oaks Dr E Jacksonville, FL | 3.0 | 2.0 | 1158 | $1,695 | $1.46 | 18d | 1 | 0.69mi |
| 6637 Gentle Oaks Dr E Jacksonville, FL | 3.0 | 2.0 | 1158 | $1,695 | $1.46 | 25d | 1 | 0.69mi |
| 6648 Gentle Oaks Dr E Jacksonville, FL | 3.0 | 2.0 | 1412 | $1,690 | $1.20 | 3d | 1 | 0.72mi |
| 5726 Ovella Rd Jacksonville, FL | 3.0 | 2.0 | 1579 | $1,650 | $1.04 | 25d | 1 | 0.73mi |
| 6915 Ortega Woods Dr Unit 11 Jacksonville, FL | 2.0 | 2.0 | 940 | $1,150 | $1.22 | 22d | 1 | 0.75mi |
| 6985 Ortega Woods Dr Unit 8 Jacksonville, FL | 3.0 | 2.0 | 1157 | $1,350 | $1.17 | 4d | 1 | 0.79mi |
| 5933 Jammes Rd Jacksonville, FL | 3.0 | 3.0 | 1071 | $1,900 | $1.77 | 25d | 1 | 0.81mi |
| 6880 Skaff Ave Jacksonville, FL | 2.0 | 2.0 | 940 | $1,285 | $1.37 | 25d | 1 | 0.81mi |
| 7052 Jammes Rd Jacksonville, FL | 3.0 | 2.0 | 990 | $1,910 | $1.93 | 25d | 1 | 0.87mi |
| 5747 Antoinette Ln Jacksonville, FL | 2.0 | 1.0 | 1200 | $1,195 | $1.00 | 25d | 1 | 0.91mi |
| 5745 Antoinette Ln Jacksonville, FL | 2.0 | 1.0 | 1200 | $1,150 | $0.96 | 4d | 1 | 0.92mi |
| 6478 Silk Leaf Ln Jacksonville, FL | 3.0 | 2.0 | 1682 | $1,985 | $1.18 | 25d | 1 | 0.92mi |
| 6869 Southern Oaks Dr W Jacksonville, FL | 3.0 | 2.0 | 1660 | $1,861 | $1.12 | 15d | 1 | 0.98mi |
| 6408 Sweetbay Ln Jacksonville, FL | 2.0 | 2.0 | 951 | $1,225 | $1.29 | 18d | 1 | 1.03mi |
| 5639 Bullseye Cir Jacksonville, FL | 3.0 | 2.0 | 1574 | $1,825 | $1.16 | 25d | 1 | 1.06mi |
| 6547 Sweetbay Ln Unit 102 Jacksonville, FL | 2.0 | 2.0 | 1040 | $1,195 | $1.15 | 6d | 1 | 1.06mi |
| 6534 Sweetbay Ln Jacksonville, FL | 2.0 | 2.0 | 951 | $1,225 | $1.29 | 25d | 1 | 1.07mi |
| 6461 Sweetbay Ln Jacksonville, FL | 2.0 | 2.0 | 995 | $1,295 | $1.30 | 18d | 4 | 1.07mi |
| 5900 Townsend Rd Jacksonville, FL | 1.0–3.0 | 1.0–2.0 | 1177 | $1,699 | $1.44 | 4d | 12 | 1.07mi |
| 6528 Sweetbay Ln Jacksonville, FL | 2.0 | 2.0 | 1040 | $1,150 | $1.11 | 25d | 1 | 1.08mi |
| 7178 Cypress Cove Rd #25 Jacksonville, FL | 3.0 | 2.0 | 1875 | $2,000 | $1.07 | 25d | 1 | 1.08mi |
HOA detail condo
- Monthly dues
- $295 · $3,540/yr
- Likely covers
- pool
- Assessments
- None detected in remarks — confirm with the listing agent.
Listing history 11 events
-
2026-06-21days on market $139,999 Active 15 DOM
-
2026-06-18days on market $139,999 Active 12 DOM
-
2026-06-17days on market $139,999 Active 11 DOM
-
2026-06-16days on market $139,999 Active 10 DOM
-
2026-06-15days on market $139,999 Active 9 DOM
-
2026-06-13days on market $139,999 Active 7 DOM
-
2026-06-13days on market $139,999 Active 6 DOM
-
2026-06-09days on market $139,999 Active 3 DOM
-
2026-06-08days on market $139,999 Active 2 DOM
-
2026-06-07remarks 695-char remark
-
2026-06-07$139,999 Active 1 DOM
ⓘ Source: listings_history table (triggers on properties + properties_extension) + one-shot
backfill from property_details.listing_events for pre-trigger history.
Tax reassessment forecast FL · Resets to sale price
- Current annual tax
- $2,447 · $204/mo
- Projected year-2 tax
- $2,447 · $204/mo
- Expected delta
- $0/yr ($0/mo · 0.0%)
ⓘ Screening estimate from a state-policy table — verify with the county assessor before closing.
Climate risk First Street
- Flood 1/10 Low FEMA zone X (unshaded) · 0% chance over 30 yrs
- Wildfire 4/10 Moderate
- Heat 8/10 Severe 7 d/yr ≥107°F today · 19 d/yr by 30 yrs out
- Wind 9/10 Extreme 99% chance of damaging wind over 30 yrs
- Air quality 3/10 Moderate 3 unhealthy d/yr today · 3 by 30 yrs out
Nearby sold comps map
Loading sold comps map…
Walkable amenities ~0.75 mi
Loading nearby amenities…
Taxation est. · year 1
- Rental income
- $18,806
- − Mortgage interest
- −$7,842
- − Property taxes
- −$2,447
- − Insurance
- −$700
- − Repairs & maintenance
- −$1,504
- − Management
- −$1,504
- − HOA
- −$3,540
- − Depreciation
- −$4,073
- Taxable loss
- −$2,805
- Est. tax savings @ 24.0%
- +$673
- After-tax cash flow
- $33/yr
For passive investors: Depreciation is non-cash, so a rental often shows a tax loss while cash-flowing — sheltering income. Rental losses are passive: they offset passive income freely, and up to $25,000/yr can offset ordinary (W-2) income if you actively participate and your MAGI is under $100k (phasing out to $0 by $150k); unused losses carry forward. On sale, claimed depreciation is recaptured at up to 25%, and gains may owe capital-gains tax (a 1031 exchange can defer both). Figures are a year-1 estimate at your 24.0% rate — not tax advice; consult a CPA.
Schools (NCES district)
- District
- Duval
- NCES district ID
- 1200480
- Math proficiency
- 46% ▼ -11.00%
- Reading proficiency
- 45% ▼ -4.00%
- Median HH income
- $48,987
- Composite
- 38.97/100
- National rank
- #4076
- State rank
- #48 of 73 in FL
Livability — Jacksonville
- Score
- 83/100
- State rank
- #50
- US rank
- #911
Category grades
Schools grade is shown separately in the Schools card above.
Census & demographics
- Census place
- Jacksonville, FL
- County
- Duval County · 1,015,274 people
- City population
- 979,034
- Metro
- Jacksonville, FL
- Population (ZIP)
- 63,592
- Household income
- $62,204
- Rent vs Own
- Severe rent burden
- 2799.0
Population outlook (Duval County) Hauer SSP2
- Today (2025)
- 1,013,010 people
- By 2030
- 1,059,228 · +4.6%
- By 2040
- 1,141,439 · +12.7%
- By 2050
- 1,205,258 · +19.0%
- By 2075
- 1,324,282 · +30.7%
- By 2100
- 1,319,620 · +30.3%
Race, ethnicity, and origin ACS 2023
- Neighborhood character
- Highly diverse neighborhood (Simpson 0.70)
- Race & ethnicity
- White 39% Black 35% Hispanic / Latino 15% Two or more races 10% Asian 6%
- Hispanic origin (detail)
- Mexican 3% Puerto Rican 6% Cuban 3%
- Common ancestry
- Hispanic 1% Lithuanian 1% Romanian 1%
- Foreign-born
- 12% · Canada, Vietnam, China
- Languages at home
- 83% English-only · Spanish 9% Tagalog/Filipino 3% French/Haitian/Cajun 2%
Political lean MEDSL · Duval
- 2024 margin
- Toss-up / Even · D 48.7% · R 50.1% · Other 1.2%
- 2008→2024 swing
- +0.4pp no change · 2008: -1.9pp · 2024: -1.5pp
- All cycles
- 2024: R+1.5 2020: D+3.8 2016: R+1.5 2012: R+3.6 2008: R+1.9
Not yet ingested
- Civics
- —
Market trends
- HPI YoY
- ▼ -64.22%
- Current HPI
- 296.5375
- Rent YoY
- ▲ 2.25%
- Metro
- Jacksonville, FL
- State GDP YoY
- ▲ 3.28%
- F500 in state
- 36
Industry mix (Fortune 500 HQ in FL)
| Industry | F500 HQs | Revenue |
|---|---|---|
| Industrial Technology | 2 | $29B |
|
||
| Insurance | 2 | $17B |
|
||
| Retail | 1 | $60B |
|
||
| Technology Distribution | 1 | $58B |
|
||
| Homebuilding | 1 | $35B |
|
||
| Technology Manufacturing | 1 | $35B |
|
||
Price history
+18.6% since first listed5 events — show timeline
- 2026-06-06 Listed $139,999 realMLS
- 2021-05-19 Sold (Public Records) $130,500 Public Records
- 2021-05-04 Sold (MLS) $130,500 realMLS
- 2021-04-02 Pending — realMLS
- 2021-03-26 Listed $118,000 realMLS
Property tax history
+23.5%/yrLatest (2025): $2,447 · -4.3% YoY. Source: county tax records.
Cash-flow waterfall
monthlySold comps — $/sqft
last 12 mo · ≤1 miLoading sold comps…