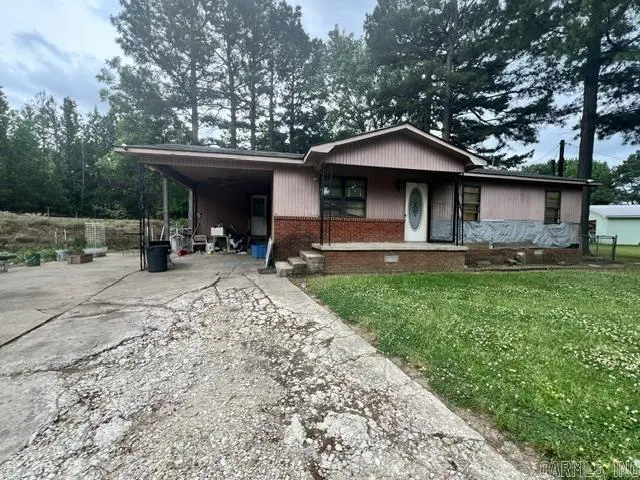
512 Vega Dr · Paragould, AR
Flood risk 9/10 · Severe
- FEMA flood zone
- AE
- Chance of flooding over 30 yrs
- 0.99%
- Est. flood insurance / yr
- $1,737 – $8,500
Fire risk 1/10 · Minimal
- Est. fire insurance / yr
- $1,499 – $2,785
Heat risk 6/10 · Moderate
- Hot days now (above 109°F)
- 7 days/yr
- Hot days in 30 yrs
- 20 days/yr
Wind risk 4/10 · Minor
- Chance of severe wind over 30 yrs
- 8.0%
Air-quality risk 1/10 · Minimal
- Unhealthy air days now
- 0 days/yr
- Unhealthy air days in 30 yrs
- 0 days/yr
Risk factors via First Street. Map © Google.
Why this score? — see what drove the B- grade
The composite is a weighted blend of 9 inputs, each scored 0–100. Each bar is that input's sub-score; the figure is the points it added to the 100-point composite (weight × sub-score).
- Cash flow +30.0/30.0
- 1% rule +10.0/10.0
- DSCR +10.0/10.0
- ARV discount +7.5/15.0
- Livability +3.2/5.0
- Schools +2.9/10.0
- Rent growth +2.5/5.0
- Condition / age +2.5/5.0
- Appreciation +0.0/10.0
$35,000
🖨 Deal sheet 📄 Offer letter ✓ Due diligence
Listing remarks MLS
Property is being sold as-is and includes the house, shop, and all remaining contents. Seller will not complete any clean out, repairs, or improvements prior to closing. All offers will be presented for review. Due to condition and contents, buyers should use caution whenviewing and complete all desired inspections. See associated documents and agent remarks for additional information.
Key facts
- 0.23 acre lot
- Parking
- Built 1970
Property features AI
Exterior
- Parking: Carport (1 car)
- Utilities: Public water; Public sewer
- Home design: Brick and Masonite exterior
- Construction: Composition roof; Crawl space foundation
- Exterior features: Shop on property; Paved road access; Level lot; Cul-de-sac lot; Inside city limits
Interior
- Flooring: Wood flooring
- Bathrooms: 2 full bathrooms
- Heating & cooling: No heating; No cooling
- Interior features: Sun room; Wood floors
Neighborhood map
What this means for you Summary
Snapshot
- This is a 3-bed/1.5-bath single-family listed at $35k.
Deal economics
- At list price, monthly cash flow is $103 ($1k/yr) — positive.
- The deal already cash-flows at list — no discount required.
- Meets the 1% rule at list price ($1k rent vs $35k).
- Cap rate 24.5% vs local median 4.5% in Paragould — top-decile yield for the area; either an underpriced asset or a hidden risk that comps aren't pricing in. Stress-test before assuming the spread holds.
Location & tenants
- Location reads 65/100 on livability (#159 in AR) — a middle-class / working-renter tenant base. Strengths: cost of living A+, housing A+, health & safety A+; Watch: schools D+, crime F, amenities F.
- Paragould School District (town): math 35% / reading 34% proficiency, ranked #124 of 238 in AR (top 52%) — families likely to look elsewhere, expect single-tenant / working-renter base with shorter leases.
- Market conditions: 187 active listings in the ZIP; 4 comparable units currently listed for rent nearby; rentals lingering (median 44d on market — plan ~5-8 weeks vacancy on turnover, expect pricing pressure); 100% of comp listings sitting > 30 days — soft ceiling on asking rent; 265 units permitted in Greene County in 2024 (135 in 5+ unit buildings).
Forward outlook
- Local home prices are declining (-3.0%/yr); year-one equity from $242 of loan paydown is wiped out by about $1k of value loss. Plan a longer hold.
- Greene County population projected at +20% by 2050 — long-run rental-demand tailwind backs the buy-and-hold thesis.
- At projected returns (-3.0% appreciation + 3.0% rent growth), your $10k cash investment doubles in ~9 years — after that, you're playing with house money.
Negotiation context
- Only 5 days on market — expect competitive offers; lowballing is unlikely to land.
- 2 sale attempts with the ask held roughly flat each time — persistent listings suggest the price (not the market) is what's stuck; bring a comps-based counter.
Risks & watch-outs
- Watch-outs: property tax is 2.5% of price; flood insurance adds $427/mo.
- Climate carrying-cost: in FEMA flood zone AE (mandatory federal flood insurance); extreme-heat days projected 7→20/yr by 2055 (HVAC capex compounding) — expect insurance premiums to compound above CPI over the hold.
Questions for the listing agent
- Built in 1970 — when were the roof, HVAC, electrical panel, plumbing, and water heater last replaced?
- Property tax is high relative to price — has the assessment been appealed recently, and will the sale trigger a re-assessment?
- What's the actual annual flood-insurance premium (NFIP or private), and is the property in a SFHA with mandatory coverage?
- Is there a deadline driving the sale (1031 exchange, divorce, estate, relocation)? That informs how much negotiation room exists.
- Schools are D-rated, which usually means shorter tenancies and higher turnover. Who's the typical renter profile here, and what's been the actual vacancy rate?
- Crime grade is F in this area — have there been break-ins, vandalism, or insurance claims at this property in the last 3 years? What carrier currently insures it and at what premium?
- What's the average days-on-market for RENTAL listings here right now (not sales)? A rising rental-DOM trend means longer vacancies and softer asking-rent achievability than the comps imply.
- What's the recent tenant-quality profile in this submarket — average credit score on applications, eviction rate, late-payment / NSF rate, and stable-employment percentage? A property-management company in the area should have these aggregated.
- How much new for-sale + rental construction is in the pipeline within 1–3 miles? Heavy new supply typically softens prices + rents 12–24 months out; constrained supply supports both.
Investment metrics
- 1% rule
- 2.90% ✓
- Cap rate
- 24.45%
- Cash-on-cash
- 64.85%
- DSCR
- 3.89
- GRM
- 2.9
CMA / ARV
- ARV (on-the-fly)
- $189,612
- Comps found
- 12
Show comp detail 12 sales within ~0.75 mi
| Address | Dist | Beds/Ba | Sqft | Sold | Price | $/sf | Match |
|---|---|---|---|---|---|---|---|
| 512 Vega Dr | 0.00mi | 3/2.0 | 1,374 (0%) | 0mo | $22,000 | $16 | 98 |
| 701 N 4 St | 0.70mi | 3/2.0 | 1,374 (0%) | 1mo | $180,000 | $131 | 64 |
| 309 W Light St | 0.68mi | 3/2.0 | 1,308 (-5%) | 2mo | $193,000 | $148 | 56 |
| 812 N 3rd St | 0.61mi | 3/2.0 | 1,266 (-8%) | 0mo | $176,400 | $139 | 56 |
| 1309 Charles St | 0.46mi | 3/2.0 | 1,214 (-12%) | 2mo | $140,000 | $115 | 56 |
| 804 N 3rd St | 0.62mi | 3/2.0 | 1,266 (-8%) | 1mo | $174,900 | $138 | 55 |
| 312 Light St | 0.68mi | 3/2.0 | 1,300 (-5%) | 3mo | $202,000 | $155 | 54 |
| 423 E Emerson St St | 0.73mi | 3/1.0 | 1,300 (-5%) | 7mo | $80,000 | $62 | 49 |
| 208 N 7th Ave | 0.58mi | 4/2.0 (+1) | 1,500 (+9%) | 4mo | $145,000 | $97 | 48 |
| 604 Meadow Ln | 0.68mi | 3/2.0 | 1,224 (-11%) | 1mo | $115,000 | $94 | 48 |
| 408 E Walnut St | 0.53mi | 3/2.0 | 1,200 (-13%) | 6mo | $167,000 | $139 | 47 |
| 802 N 3rd St | 0.63mi | 3/2.0 | 1,200 (-13%) | 2mo | $174,900 | $146 | 46 |
Match score weights: distance 35% · size 25% · config 20% · recency 20%. Top-matched comps best support the ARV.
Projected returns pro-forma
-3.0% appreciation · 3.0% rent growth · sell at horizon
- IRR
- 3.1%
- Equity multiple
- 1.12×
- Total profit
- $1,188
- Equity at exit
- $5,219
- IRR
- 13.3%
- Equity multiple
- 2.09×
- Total profit
- $10,690
- Equity at exit
- $3,026
Cash invested: $9,800 (down + closing). Projections, not guarantees.
Landlord ↔ Tenant lean methodology
- Overall (STATE)
- 92 Strongly Landlord-Friendly
- State Arkansas
- 92 Strongly Landlord-Friendly · R+14
- County
- — inherits STATE
- City
- — inherits STATE
ZIP-level market 72450
- Home prices YoY
- -8.9%
- Active inventory
- 187
- Price-to-rent
- 2.9×
Monthly cashflow live
- Estimated rent
- $1,015 medium interval (Pro) →
- Mortgage (P&I)
- −$184
- Tax from tax record
- −$74 /mo · $887/yr
- Insurance
- −$15
- Flood insurance flood zone
- −$427 /mo · $5,118/yr
- HOA
- −$0
- Vacancy / Maint / Mgmt
- −$213
- Net cashflow
- $103
Break-even live
UW: 25.0% down · 7.5% · 30yr · 1.5% tax · 5.0% vac · 8.0% maint · 8.0% mgmt
Financing live
Cash to close
- Down payment
- $8,750
- Closing costs
- $1,050
- Reserves months
- —
- Total cash needed
- —
Loan-product check · same deal, 3 products live
Conventional
25% down · 7.5% · 30yr
- Down + closing
- —
- Monthly P&I
- —
- Monthly cashflow
- —
- DSCR
- —
- Eligible?
- —
Personal DTI + credit; lowest rate.
DSCR
20% down · 8.5% · 30yr
- Down + closing
- —
- Monthly P&I
- —
- Monthly cashflow
- —
- DSCR
- —
- Eligible?
- —
No personal income docs; deal must DSCR.
Hard money
10% down · 12.0% · 12mo
- Down + closing
- —
- Monthly P&I
- —
- Monthly cashflow
- —
- DSCR
- —
- Eligible?
- —
Short-term bridge; refi at stabilization.
Rent comps 4 comps
| Address | Beds | Baths | Sqft | Rent | $/sqft | DOM | Units | Dist |
|---|---|---|---|---|---|---|---|---|
| 528 E Lake St Paragould, AR | 3.0 | 1.0 | 1088 | $695 | $0.64 | 43d | 1 | 0.53mi |
| 307 N 12th Ave Paragould, AR | 3.0 | 1.0 | 1240 | $1,195 | $0.96 | 43d | 1 | 0.69mi |
| 800 S 3rd Ave Paragould, AR | 2.0 | 1.0 | 875 | $900 | $1.03 | 43d | 1 | 1.21mi |
| 700 S 4th St Unit 1 Paragould, AR | 2.0 | 1.0 | 942 | $725 | $0.77 | 43d | 1 | 1.27mi |
Listing history 3 events
-
2026-05-22$35,000 New Listing
Show marketing remark (388 chars)
Property is being sold as-is and includes the house, shop, and all remaining contents. Seller will not complete any clean out, repairs, or improvements prior to closing. All offers will be presented for review. Due to condition and contents, buyers should use caution whenviewing and complete all desired inspections. See associated documents and agent remarks for additional information.
-
2026-05-22$35,000 Active 388-char remark
Show marketing remark (388 chars)
Property is being sold as-is and includes the house, shop, and all remaining contents. Seller will not complete any clean out, repairs, or improvements prior to closing. All offers will be presented for review. Due to condition and contents, buyers should use caution whenviewing and complete all desired inspections. See associated documents and agent remarks for additional information.
-
1992-06-17soldstatus $41,000
ⓘ Source: listings_history table (triggers on properties + properties_extension) + one-shot
backfill from property_details.listing_events for pre-trigger history.
Tax reassessment forecast AR · Resets to sale price
- Current annual tax
- $887 · $74/mo
- Projected year-2 tax
- $887 · $74/mo
- Expected delta
- $0/yr ($0/mo · 0.0%)
ⓘ Screening estimate from a state-policy table — verify with the county assessor before closing.
Climate risk First Street
- Flood 9/10 Extreme FEMA zone AE · 99% chance over 30 yrs
- Wildfire 1/10 Low
- Heat 6/10 Major 7 d/yr ≥109°F today · 20 d/yr by 30 yrs out
- Wind 4/10 Moderate 8% chance of damaging wind over 30 yrs
- Air quality 1/10 Low 0 unhealthy d/yr today · 0 by 30 yrs out
Nearby sold comps map
Loading sold comps map…
Walkable amenities ~0.75 mi
Loading nearby amenities…
Taxation est. · year 1
- Rental income
- $12,177
- − Mortgage interest
- −$1,961
- − Property taxes
- −$887
- − Insurance
- −$5,294
- − Repairs & maintenance
- −$974
- − Management
- −$974
- − Depreciation
- −$1,018
- Taxable income
- $1,069
- Est. tax owed @ 24.0%
- −$257
- After-tax cash flow
- $980/yr
For passive investors: Depreciation is non-cash, so a rental often shows a tax loss while cash-flowing — sheltering income. Rental losses are passive: they offset passive income freely, and up to $25,000/yr can offset ordinary (W-2) income if you actively participate and your MAGI is under $100k (phasing out to $0 by $150k); unused losses carry forward. On sale, claimed depreciation is recaptured at up to 25%, and gains may owe capital-gains tax (a 1031 exchange can defer both). Figures are a year-1 estimate at your 24.0% rate — not tax advice; consult a CPA.
Schools (NCES district)
- District
- Paragould School District
- NCES district ID
- 0500017
- Math proficiency
- 35% ▼ -15.00%
- Reading proficiency
- 34% ▼ -12.00%
- Median HH income
- $36,644
- Composite
- 28.67/100
- National rank
- #6696
- State rank
- #124 of 238 in AR
Livability — Paragould
- Score
- 65/100
- State rank
- #159
- US rank
- #13582
Category grades
Schools grade is shown separately in the Schools card above.
Census & demographics
- Census place
- Paragould, AR
- County
- Greene County · 40,807 people
- City population
- 40,807
- Metro
- Paragould, AR
- Population (ZIP)
- 40,807
- Household income
- $57,725
- Rent vs Own
- Severe rent burden
- 1297.0
Population outlook (Greene County) Hauer SSP2
- Today (2025)
- 48,533 people
- By 2030
- 50,640 · +4.3%
- By 2040
- 54,795 · +12.9%
- By 2050
- 58,486 · +20.5%
- By 2075
- 66,056 · +36.1%
- By 2100
- 67,684 · +39.5%
Race, ethnicity, and origin ACS 2023
- Neighborhood character
- Predominantly White (89%)
- Race & ethnicity
- White 89% Two or more races 6% Hispanic / Latino 4% Black 3%
- Common ancestry
- Italian 2% Slovak 1% Romanian 1%
- Foreign-born
- 1% · Canada
- Languages at home
- 98% English-only · Spanish 1%
Political lean MEDSL · Greene
- 2024 margin
- Solid R (+61.2) · D 18.6% · R 79.8% · Other 1.7%
- 2008→2024 swing
- -31.5pp toward R · 2008: -29.7pp · 2024: -61.2pp
- All cycles
- 2024: R+61.2 2020: R+59.7 2016: R+53.0 2012: R+36.9 2008: R+29.7
Not yet ingested
- Civics
- —
Market trends
- HPI YoY
- ▼ -23.15%
- Current HPI
- 236.1404
- Rent YoY
- —
- Metro
- Paragould, AR
- State GDP YoY
- ▲ 3.80%
- F500 in state
- 10
Industry mix (Fortune 500 HQ in AR)
| Industry | F500 HQs | Revenue |
|---|---|---|
| Retail | 1 | $681B |
|
||
| Food / Agriculture | 1 | $53B |
|
||
| Retail / Energy | 1 | $22B |
|
||
| Transportation / Logistics | 1 | $12B |
|
||
| Energy | 1 | $4B |
|
||
Price history
-14.6% since first listed3 events — show timeline
- 2026-05-22 Listed $35,000 NEABOR MLS
- 2026-05-22 Listed $35,000 CARMLS
- 1992-06-17 Sold (Public Records) $41,000 Public Records
Property tax history
+17.4%/yrLatest (2025): $887 · +1628.7% YoY. Source: county tax records.
Cash-flow waterfall
monthlySold comps — $/sqft
last 12 mo · ≤1 miLoading sold comps…