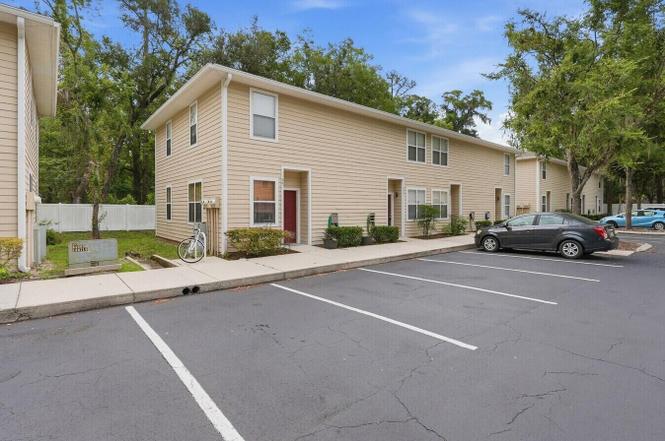
1710 NW 7th St #604 · Gainesville, FL
Flood risk 1/10 · Minimal
- FEMA flood zone
- X (unshaded)
- Chance of flooding over 30 yrs
- 0.0%
- Est. flood insurance / yr
- $507 – $1,088
Fire risk 1/10 · Minimal
- Est. fire insurance / yr
- $947 – $1,759
Heat risk 8/10 · Major
- Hot days now (above 107°F)
- 7 days/yr
- Hot days in 30 yrs
- 19 days/yr
Wind risk 9/10 · Severe
- Chance of severe wind over 30 yrs
- 99.0%
Air-quality risk 3/10 · Minor
- Unhealthy air days now
- 3 days/yr
- Unhealthy air days in 30 yrs
- 3 days/yr
Risk factors via First Street. Map © Google.
Why this score? — see what drove the D- grade
The composite is a weighted blend of 9 inputs, each scored 0–100. Each bar is that input's sub-score; the figure is the points it added to the 100-point composite (weight × sub-score).
- Cash flow +8.2/30.0
- ARV discount +7.5/15.0
- 1% rule +5.2/10.0
- Schools +4.3/10.0
- Livability +4.0/5.0
- Rent growth +3.5/5.0
- Condition / age +2.5/5.0
- DSCR +2.2/10.0
- Appreciation +0.0/10.0
$155,000
🖨 Deal sheet 📄 Offer letter ✓ Due diligence
Listing remarks MLS
-. 3-4 Units.
Key facts
- $268 HOA
- Parking
- Built 1998
Property features AI
Finance
- Other: Pets not allowed
- HOA & community: Monthly HOA fee of $268; HOA covers common area and grounds maintenance; Association provides other amenities
Exterior
- Parking: 1 parking space; No carport
- Utilities: Public water; Public sewer; No additional utilities listed
- Home design: Condominium; Two levels; Single-story building
- Construction: Wood siding and wood frame construction; Shingle roof; Built as resale property
- Exterior features: Not waterfront; South-facing
Interior
- Kitchen: Refrigerator
- Bedrooms: No main-level bedrooms
- Flooring: Tile
- Bathrooms: 2 full bathrooms; 1 half bathroom
- Heating & cooling: Central heating; Central air conditioning
- Interior features: Refrigerator; Tile floors
- Laundry & utility: In-unit laundry on the main level
Neighborhood map
What this means for you Summary
Snapshot
- This is a 2-bed/3.0-bath condo listed at $155k.
Deal economics
- At list price, monthly cash flow is $-145 ($-2k/yr) — negative.
- To cash-flow at today's rent, offer at most $129k (16.5% below list).
- Meets the 1% rule at list price ($2k rent vs $155k).
- Recommended offer: $129k (16.5% below list) — sets the bar for cash-flow.
Location & tenants
- Location reads 81/100 on livability (#97 in FL, #1,480 nationally) — a professional / high-income tenant draw. Strengths: amenities A+, commute A+, cost of living A+; Watch: employment D+, crime F.
- Alachua (urban): math 49% / reading 54% proficiency, ranked #30 of 73 in FL (top 41%) — acceptable for families but not a draw, mixed tenant base, ~2y average lease.
- Zoned schools: Stephen Foster Elementary School (math 46% / reading 52%, grade D, #1,134 of 2,144 statewide, top 54%, 458 students, 65% FRL) — zoned schools average 65% FRL vs 48% district-wide (17 pts higher); higher-poverty schools than district average — tighter screening recommended.
- Market conditions: Rents rising fast (+4.0%/yr); 108 active listings in the ZIP; 1,774 units permitted in Alachua County in 2024 (984 in 5+ unit buildings).
- This rent runs 39% of the median local income ($49k/yr) — at the standard rent-burdened threshold; future hikes will face affordability resistance.
Forward outlook
- Local home prices are declining (-3.0%/yr); year-one equity from $1k of loan paydown is wiped out by about $5k of value loss. Plan a longer hold.
- Alachua County population projected at +26% by 2050 — long-run rental-demand tailwind backs the buy-and-hold thesis.
Negotiation context
- Only 2 days on market — expect competitive offers; lowballing is unlikely to land.
- 5 sale attempts since 22y ago with the ask held roughly flat each time — persistent listings suggest the price (not the market) is what's stuck; bring a comps-based counter.
- Current owner paid $130k; 19% above their basis — modest negotiation headroom, anchor on the comps not their cost.
Risks & watch-outs
- Climate carrying-cost: severe wind risk, 99% chance of damaging wind over 30y; extreme-heat days projected 7→19/yr by 2055 (HVAC capex compounding) — expect insurance premiums to compound above CPI over the hold.
Questions for the listing agent
- What do current leases actually rent for vs. the listed asking? Can we see a recent rent roll and the last 12 months of T-12 income?
- What does the HOA fee cover, when was the last increase, and are there any pending special assessments or reserve-fund shortfalls?
- Any open or pending special assessments — roof, HVAC, plumbing, elevator, façade? What's the per-unit balance and payoff schedule, and is the seller paying it off at close or rolling it to the buyer?
- Is there a deadline driving the sale (1031 exchange, divorce, estate, relocation)? That informs how much negotiation room exists.
- Schools are B-rated — typically a magnet for longer-tenancy family renters. What's the average tenant stay here, and is there a school-zone premium baked into asking?
- Crime grade is F in this area — have there been break-ins, vandalism, or insurance claims at this property in the last 3 years? What carrier currently insures it and at what premium?
- The area grade is low — what's the realistic commute time and amenity access for the typical tenant pool here? Any planned neighborhood developments (good or bad) we should know about?
- What's the average days-on-market for RENTAL listings here right now (not sales)? A rising rental-DOM trend means longer vacancies and softer asking-rent achievability than the comps imply.
- What's the recent tenant-quality profile in this submarket — average credit score on applications, eviction rate, late-payment / NSF rate, and stable-employment percentage? A property-management company in the area should have these aggregated.
- How much new apartment / multifamily construction is in the pipeline within 1–3 miles? Heavy new supply (>2% of stock underway) typically softens rents 12–24 months out; light construction supports rent growth.
Investment metrics
- 1% rule
- 1.02% ✓
- Cap rate
- 5.17%
- Cash-on-cash
- -4.00%
- DSCR
- 0.82
- GRM
- 8.1
CMA / ARV
No comps found within radius.
Projected returns pro-forma
-3.0% appreciation · 4.04% rent growth · sell at horizon
- IRR
- -21.3%
- Equity multiple
- 0.25×
- Total profit
- $-32,422
- Equity at exit
- $23,111
- IRR
- -11.6%
- Equity multiple
- 0.26×
- Total profit
- $-32,141
- Equity at exit
- $13,402
Cash invested: $43,400 (down + closing). Projections, not guarantees.
Landlord ↔ Tenant lean methodology
- Overall (STATE)
- 87 Strongly Landlord-Friendly
- State Florida
- 87 Strongly Landlord-Friendly · R+3
- County
- — inherits STATE
- City
- — inherits STATE
ZIP-level market 32609
- Home prices YoY
- -23.5%
- Rents YoY
- 4.0%
- Active inventory
- 108
- Price-to-rent
- 8.1×
Monthly cashflow live
- Estimated rent
- $1,587 medium interval (Pro) →
- Mortgage (P&I)
- −$813
- Tax from tax record
- −$253 /mo · $3,037/yr
- Insurance
- −$65
- HOA
- −$268
- Vacancy / Maint / Mgmt
- −$333
- Net cashflow
- $-145
Break-even live
UW: 25.0% down · 7.5% · 30yr · 1.5% tax · 5.0% vac · 8.0% maint · 8.0% mgmt
Financing live
Cash to close
- Down payment
- $38,750
- Closing costs
- $4,650
- Reserves months
- —
- Total cash needed
- —
Loan-product check · same deal, 3 products live
Conventional
25% down · 7.5% · 30yr
- Down + closing
- —
- Monthly P&I
- —
- Monthly cashflow
- —
- DSCR
- —
- Eligible?
- —
Personal DTI + credit; lowest rate.
DSCR
20% down · 8.5% · 30yr
- Down + closing
- —
- Monthly P&I
- —
- Monthly cashflow
- —
- DSCR
- —
- Eligible?
- —
No personal income docs; deal must DSCR.
Hard money
10% down · 12.0% · 12mo
- Down + closing
- —
- Monthly P&I
- —
- Monthly cashflow
- —
- DSCR
- —
- Eligible?
- —
Short-term bridge; refi at stabilization.
HOA detail condo
- Monthly dues
- $268 · $3,216/yr
- Assessments
- None detected in remarks — confirm with the listing agent.
Listing history 3 events
-
2026-06-18days on market $155,000 Active 2 DOM
-
2026-06-17remarks 383-char remark
-
2026-06-17$155,000 Active 1 DOM
ⓘ Source: listings_history table (triggers on properties + properties_extension) + one-shot
backfill from property_details.listing_events for pre-trigger history.
Tax reassessment forecast FL · Resets to sale price
- Current annual tax
- $3,037 · $253/mo
- Projected year-2 tax
- $3,037 · $253/mo
- Expected delta
- $0/yr ($0/mo · 0.0%)
ⓘ Screening estimate from a state-policy table — verify with the county assessor before closing.
Climate risk First Street
- Flood 1/10 Low FEMA zone X (unshaded) · 0% chance over 30 yrs
- Wildfire 1/10 Low
- Heat 8/10 Severe 7 d/yr ≥107°F today · 19 d/yr by 30 yrs out
- Wind 9/10 Extreme 99% chance of damaging wind over 30 yrs
- Air quality 3/10 Moderate 3 unhealthy d/yr today · 3 by 30 yrs out
Nearby sold comps map
Loading sold comps map…
Walkable amenities ~0.75 mi
Loading nearby amenities…
Taxation est. · year 1
- Rental income
- $19,047
- − Mortgage interest
- −$8,682
- − Property taxes
- −$3,037
- − Insurance
- −$775
- − Repairs & maintenance
- −$1,524
- − Management
- −$1,524
- − HOA
- −$3,216
- − Depreciation
- −$4,509
- Taxable loss
- −$4,220
- Est. tax savings @ 24.0%
- +$1,013
- After-tax cash flow
- $-722/yr
For passive investors: Depreciation is non-cash, so a rental often shows a tax loss while cash-flowing — sheltering income. Rental losses are passive: they offset passive income freely, and up to $25,000/yr can offset ordinary (W-2) income if you actively participate and your MAGI is under $100k (phasing out to $0 by $150k); unused losses carry forward. On sale, claimed depreciation is recaptured at up to 25%, and gains may owe capital-gains tax (a 1031 exchange can defer both). Figures are a year-1 estimate at your 24.0% rate — not tax advice; consult a CPA.
Schools (NCES district)
- District
- Alachua
- NCES district ID
- 1200030
- Math proficiency
- 49% ▼ -9.00%
- Reading proficiency
- 54% ▼ -3.00%
- Median HH income
- $42,683
- Composite
- 43.31/100
- National rank
- #3038
- State rank
- #30 of 73 in FL
Livability — Gainesville
- Score
- 81/100
- State rank
- #97
- US rank
- #1480
Category grades
Schools grade is shown separately in the Schools card above.
Census & demographics
- Census place
- Gainesville, FL
- County
- Alachua County · 218,005 people
- City population
- 188,348
- Metro
- Gainesville, FL
- Population (ZIP)
- 19,752
- Household income
- $49,406
- Rent vs Own
- Severe rent burden
- 1037.0
Population outlook (Alachua County) Hauer SSP2
- Today (2025)
- 289,834 people
- By 2030
- 305,873 · +5.5%
- By 2040
- 335,246 · +15.7%
- By 2050
- 364,719 · +25.8%
- By 2075
- 436,665 · +50.7%
- By 2100
- 482,920 · +66.6%
Race, ethnicity, and origin ACS 2023
- Neighborhood character
- Diverse neighborhood (Simpson 0.60)
- Race & ethnicity
- White 54% Black 33% Hispanic / Latino 8% Two or more races 6% Asian 1%
- Hispanic origin (detail)
- Mexican 2% Puerto Rican 2%
- Common ancestry
- Romanian 2% Slovak 1% Lithuanian 1%
- Foreign-born
- 5% · Canada, Vietnam
- Languages at home
- 92% English-only · Spanish 5% Other Indo-European 1% French/Haitian/Cajun 1%
Political lean MEDSL · Alachua
- 2024 margin
- Strong D (+21.0) · D 59.7% · R 38.8% · Other 1.5%
- 2008→2024 swing
- -0.6pp no change · 2008: 21.6pp · 2024: 21.0pp
- All cycles
- 2024: D+21.0 2020: D+27.2 2016: D+22.5 2012: D+17.3 2008: D+21.6
Not yet ingested
- Civics
- —
Market trends
- HPI YoY
- ▼ -93.25%
- Current HPI
- 304.1951
- Rent YoY
- ▲ 4.04%
- Metro
- Gainesville, FL
- State GDP YoY
- ▲ 3.28%
- F500 in state
- 36
Industry mix (Fortune 500 HQ in FL)
| Industry | F500 HQs | Revenue |
|---|---|---|
| Industrial Technology | 2 | $29B |
|
||
| Insurance | 2 | $17B |
|
||
| Retail | 1 | $60B |
|
||
| Technology Distribution | 1 | $58B |
|
||
| Homebuilding | 1 | $35B |
|
||
| Technology Manufacturing | 1 | $35B |
|
||
Price history
+76.3% since first listed11 events — show timeline
- 2026-06-16 Listed $155,000 Beaches MLS
- 2025-06-30 Rental Removed $1,375 APPFOLIO
- 2025-06-26 Listed for Rent $1,375 APPFOLIO
- 2025-06-26 Rental Removed $1,375 STELLARMLS
- 2025-01-07 Listed for Rent $1,375 STELLARMLS
- 2025-01-07 Rental Removed $1,375 APPFOLIO
- 2025-01-05 Listed for Rent $1,375 APPFOLIO
- 2023-06-29 Sold (Public Records) $130,000 Public Records
- 2004-09-20 Sold (Public Records) $87,900 Public Records
- 2004-09-14 Sold (MLS) $87,900 Stellar MLS as Distributed by MLS Grid
- 2004-02-20 Listed $87,900 Stellar MLS as Distributed by MLS Grid
Property tax history
+7.0%/yrLatest (2025): $3,037 · +10.7% YoY. Source: county tax records.
Cash-flow waterfall
monthlySold comps — $/sqft
last 12 mo · ≤1 miLoading sold comps…