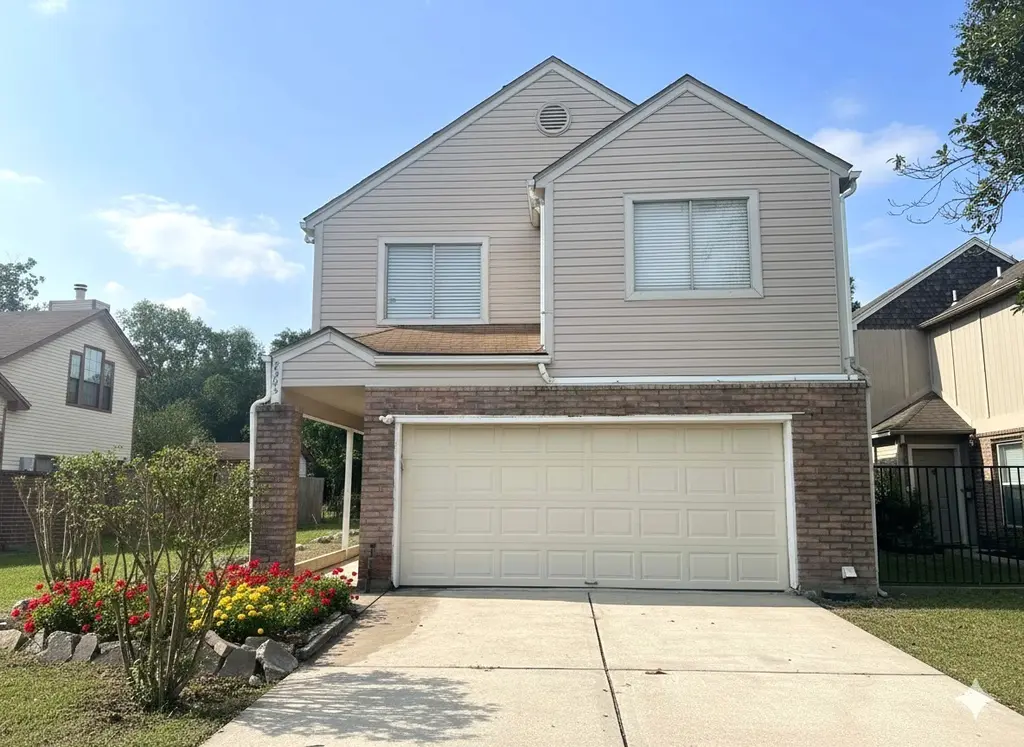
9303 Kingsflower Cir · Houston, TX
Flood risk 1/10 · Minimal
- FEMA flood zone
- X (shaded)
- Chance of flooding over 30 yrs
- 0.0%
- Est. flood insurance / yr
- $507 – $1,088
Fire risk 3/10 · Minor
- Est. fire insurance / yr
- $1,222 – $2,270
Heat risk 9/10 · Severe
- Hot days now (above 108°F)
- 7 days/yr
- Hot days in 30 yrs
- 24 days/yr
Wind risk 9/10 · Severe
- Chance of severe wind over 30 yrs
- 99.0%
Air-quality risk 2/10 · Minimal
- Unhealthy air days now
- 1 days/yr
- Unhealthy air days in 30 yrs
- 2 days/yr
Risk factors via First Street. Map © Google.
Why this score? — see what drove the C- grade
The composite is a weighted blend of 9 inputs, each scored 0–100. Each bar is that input's sub-score; the figure is the points it added to the 100-point composite (weight × sub-score).
- ARV discount +15.0/15.0
- Cash flow +14.8/30.0
- 1% rule +5.0/10.0
- DSCR +4.5/10.0
- Livability +3.7/5.0
- Rent growth +3.0/5.0
- Schools +2.6/10.0
- Condition / age +2.5/5.0
- Appreciation +0.0/10.0
$180,000
🖨 Deal sheet 📄 Offer letter ✓ Due diligence
Listing remarks MLS
NO HOA! Move-in ready! Located in a desirable school zone and just 3 minutes from Beltway 8, this 2-story home is priced to sell quickly!
Key facts
- Move-in ready
- No hoa
- 3,070 sq ft lot
Tags
Neighborhood map
What this means for you Summary
Snapshot
- This is a 3-bed/2.5-bath single-family listed at $180k.
Deal economics
- At list price, monthly cash flow is $50 ($606/yr) — positive.
- The deal already cash-flows at list — no discount required.
- Meets the 1% rule at list price ($2k rent vs $180k).
- Cap rate 6.6% vs local median 3.2% in Houston — top-decile yield for the area; either an underpriced asset or a hidden risk that comps aren't pricing in. Stress-test before assuming the spread holds.
Location & tenants
- Location reads 74/100 on livability (#184 in TX, #4,771 nationally) — a middle-class / working-renter tenant base. Strengths: amenities A+, cost of living A+, housing A+; Watch: schools D, crime F.
- Pasadena ISD (suburban): math 29% / reading 32% proficiency, ranked #612 of 826 in TX (top 74%) — families likely to look elsewhere, expect single-tenant / working-renter base with shorter leases; 71% free/reduced lunch — lower-income household profile, screen leases tightly.
- Market conditions: Rents rising (+2.2%/yr); 146 active listings in the ZIP; 20 comparable units currently listed for rent nearby; rentals at typical pace (median 21d on market — plan ~3-4 weeks tenant-placement turnaround); 29,883 units permitted in Harris County in 2024 (8,621 in 5+ unit buildings).
- This rent runs 31% of the median local income ($69k/yr) — at the standard rent-burdened threshold; future hikes will face affordability resistance.
Forward outlook
- Local home prices are declining (-3.0%/yr); year-one equity from $1k of loan paydown is wiped out by about $5k of value loss. Plan a longer hold.
- Harris County population projected at +47% by 2050 — long-run rental-demand tailwind backs the buy-and-hold thesis.
Negotiation context
- Only 13 days on market — expect competitive offers; lowballing is unlikely to land.
- 7 sale attempts since 2y ago with the ask held roughly flat each time — persistent listings suggest the price (not the market) is what's stuck; bring a comps-based counter.
- Current owner paid $78k; list at $180k implies a 132% gain — meaningful room to come down on a strong offer.
Risks & watch-outs
- Climate carrying-cost: severe wind risk, 99% chance of damaging wind over 30y; extreme-heat days projected 7→24/yr by 2055 (HVAC capex compounding) — expect insurance premiums to compound above CPI over the hold.
Questions for the listing agent
- Is there a deadline driving the sale (1031 exchange, divorce, estate, relocation)? That informs how much negotiation room exists.
- Schools are D-rated, which usually means shorter tenancies and higher turnover. Who's the typical renter profile here, and what's been the actual vacancy rate?
- Crime grade is F in this area — have there been break-ins, vandalism, or insurance claims at this property in the last 3 years? What carrier currently insures it and at what premium?
- What's the average days-on-market for RENTAL listings here right now (not sales)? A rising rental-DOM trend means longer vacancies and softer asking-rent achievability than the comps imply.
- What's the recent tenant-quality profile in this submarket — average credit score on applications, eviction rate, late-payment / NSF rate, and stable-employment percentage? A property-management company in the area should have these aggregated.
- How much new for-sale + rental construction is in the pipeline within 1–3 miles? Heavy new supply typically softens prices + rents 12–24 months out; constrained supply supports both.
Investment metrics
- 1% rule
- 1.00% ✓
- Cap rate
- 6.63%
- Cash-on-cash
- 1.20%
- DSCR
- 1.05
- GRM
- 8.3
CMA / ARV
- ARV (median comp)
- $228,667
- List price
- $180,000
- Delta
- -21.28%
- Verdict
- UNDERPRICED
- Comps
- 20 within 1.0 mi
Show comp detail 12 sales within ~0.75 mi
| Address | Dist | Beds/Ba | Sqft | Sold | Price | $/sf | Match |
|---|---|---|---|---|---|---|---|
| 9283 Kingsflower Cir | 0.04mi | 3/2.5 | 1,606 (+7%) | 3mo | $179,999 | $112 | 85 |
| 10918 Gulf Bridge Ct | 0.31mi | 3/2.0 | 1,500 (-0%) | 2mo | $265,000 | $177 | 81 |
| 9559 Carmalee St | 0.30mi | 3/2.5 | 1,591 (+6%) | 2mo | $265,000 | $167 | 75 |
| 9423 Garden Bridge St | 0.39mi | 3/2.0 | 1,580 (+5%) | 2mo | $240,000 | $152 | 70 |
| 9715 Santa Monica Blvd | 0.60mi | 3/2.0 | 1,522 (+1%) | 0mo | $240,000 | $158 | 68 |
| 9922 Glenkirk Dr | 0.37mi | 3/2.0 | 1,600 (+6%) | 3mo | $270,000 | $169 | 68 |
| 9527 Kingsvalley St | 0.28mi | 4/2.0 (+1) | 1,397 (-7%) | 0mo | $245,000 | $175 | 68 |
| 9706 Carmalee St | 0.42mi | 3/1.0 | 1,383 (-8%) | 2mo | $260,000 | $188 | 59 |
| 10103 Kirkwren Dr | 0.48mi | 3/2.0 | 1,316 (-13%) | 2mo | $208,000 | $158 | 53 |
| 10318 Sageberry Dr | 0.59mi | 3/2.0 | 1,318 (-12%) | 0mo | $259,900 | $197 | 49 |
| 9331 Garfield Park Ln | 0.72mi | 3/2.0 | 1,638 (+9%) | 1mo | $272,000 | $166 | 49 |
| 5 Ramey Cir | 0.63mi | 3/1.5 | 1,296 (-14%) | 2mo | $225,000 | $174 | 41 |
Match score weights: distance 35% · size 25% · config 20% · recency 20%. Top-matched comps best support the ARV.
Projected returns pro-forma
-3.0% appreciation · 2.17% rent growth · sell at horizon
- IRR
- -15.3%
- Equity multiple
- 0.46×
- Total profit
- $-27,340
- Equity at exit
- $26,839
- IRR
- -8.3%
- Equity multiple
- 0.50×
- Total profit
- $-25,263
- Equity at exit
- $15,563
Cash invested: $50,400 (down + closing). Projections, not guarantees.
Landlord ↔ Tenant lean methodology
- Overall (STATE)
- 87 Strongly Landlord-Friendly
- State Texas
- 87 Strongly Landlord-Friendly · R+5
- County
- — inherits STATE
- City
- — inherits STATE
ZIP-level market 77075
- Home prices YoY
- -25.3%
- Rents YoY
- 2.2%
- Active inventory
- 146
- Price-to-rent
- 8.3×
Monthly cashflow live
- Estimated rent
- $1,807 high interval (Pro) →
- Mortgage (P&I)
- −$944
- Tax from tax record
- −$358 /mo · $4,302/yr
- Insurance
- −$75
- HOA
- −$0
- Vacancy / Maint / Mgmt
- −$380
- Net cashflow
- $50
Break-even live
UW: 25.0% down · 7.5% · 30yr · 1.5% tax · 5.0% vac · 8.0% maint · 8.0% mgmt
Financing live
Cash to close
- Down payment
- $45,000
- Closing costs
- $5,400
- Reserves months
- —
- Total cash needed
- —
Loan-product check · same deal, 3 products live
Conventional
25% down · 7.5% · 30yr
- Down + closing
- —
- Monthly P&I
- —
- Monthly cashflow
- —
- DSCR
- —
- Eligible?
- —
Personal DTI + credit; lowest rate.
DSCR
20% down · 8.5% · 30yr
- Down + closing
- —
- Monthly P&I
- —
- Monthly cashflow
- —
- DSCR
- —
- Eligible?
- —
No personal income docs; deal must DSCR.
Hard money
10% down · 12.0% · 12mo
- Down + closing
- —
- Monthly P&I
- —
- Monthly cashflow
- —
- DSCR
- —
- Eligible?
- —
Short-term bridge; refi at stabilization.
Rent comps 20 comps
| Address | Beds | Baths | Sqft | Rent | $/sqft | DOM | Units | Dist |
|---|---|---|---|---|---|---|---|---|
| 9402 Carmalee St Houston, TX | 3.0 | 2.0 | 1564 | $1,850 | $1.18 | 21d | 1 | 0.16mi |
| 9462 Fuqua St Houston, TX | 3.0 | 2.0 | 1409 | $1,750 | $1.24 | 44d | 1 | 0.47mi |
| 10010 Sagecanyon Dr Houston, TX | 3.0 | 2.0 | 1380 | $2,000 | $1.45 | 44d | 1 | 0.48mi |
| 9122 Southbluff Blvd Houston, TX | 3.0 | 2.0 | 1900 | $2,000 | $1.05 | 44d | 1 | 0.54mi |
| 9610 Foredale St Houston, TX | 3.0 | 2.0 | 1836 | $1,625 | $0.89 | 3d | 1 | 0.59mi |
| 10418 Sagemeadow Ln Houston, TX | 4.0 | 2.0 | 1429 | $1,950 | $1.36 | 44d | 1 | 0.74mi |
| 10350 Stover St Houston, TX | 3.0 | 2.0 | 1386 | $1,625 | $1.17 | 44d | 1 | 0.87mi |
| 8911 Durham Manor Ln Houston, TX | 3.0 | 3.0 | 1848 | $2,201 | $1.19 | 5d | 1 | 0.95mi |
| 10606 Kirkwren Dr Houston, TX | 4.0 | 2.0 | 1618 | $8,750 | $5.41 | 22d | 1 | 1.04mi |
| 10606 Kirkwren Dr Unit 1029082P Houston, TX | 4.0 | 2.0 | 1614 | $15,665 | $9.71 | 24d | 1 | 1.04mi |
| 11575 Pearland Pkwy Houston, TX | 1.0–3.0 | 1.0–2.0 | 1070 | $1,948 | $1.82 | 1d | 22 | 1.13mi |
| 10121 Windmill Lakes Blvd Houston, TX | 1.0–2.0 | 1.0–2.0 | 814 | $1,491 | $1.83 | 20d | 17 | 1.15mi |
| 10819 Sagewind Dr Houston, TX | 4.0 | 2.0 | 1514 | $1,966 | $1.30 | 5d | 1 | 1.23mi |
| 9943 Pearland Pkwy Houston, TX | 2.0 | 2.0 | 1079 | $1,839 | $1.70 | 24d | 1 | 1.27mi |
| 9988 Windmill Lakes Blvd Houston, TX | 1.0–2.0 | 1.0–2.0 | 859 | $1,290 | $1.50 | 3d | 15 | 1.33mi |
| 11576 Pearland Pkwy Unit 11613 Houston, TX | 2.0 | 2.0 | 1079 | $1,847 | $1.71 | 12d | 1 | 1.41mi |
| 11576 Pearland Pkwy Unit 422 Houston, TX | 2.0 | 2.0 | 1079 | $1,812 | $1.68 | 8d | 1 | 1.41mi |
| 11576 Pearland Pkwy Unit 2174 Houston, TX | 2.0 | 2.0 | 1079 | $1,836 | $1.70 | 11d | 1 | 1.42mi |
| 11576 Pearland Pkwy Unit 2162 Houston, TX | 2.0 | 2.0 | 1079 | $1,812 | $1.68 | 5d | 1 | 1.48mi |
| 11576 Pearland Pkwy Unit 2165 Houston, TX | 2.0 | 2.0 | 1079 | $1,804 | $1.67 | 3d | 1 | 1.48mi |
Listing history 36 events
-
2026-06-18days on market $180,000 Active 13 DOM
-
2026-06-17days on market $180,000 Active 12 DOM
-
2026-06-16days on market $180,000 Active 11 DOM
-
2026-06-15days on market $180,000 Active 10 DOM
-
2026-06-13days on market $180,000 Active 8 DOM
-
2026-06-09days on market $180,000 Active 4 DOM
-
2026-06-08days on market $180,000 Active 3 DOM
-
2026-06-07days on market $180,000 Active 2 DOM
-
2026-06-03days on market $180,000 Active 82 DOM
-
2026-06-02days on market $180,000 Active 81 DOM
-
2026-06-01days on market $180,000 Active 80 DOM
-
2026-05-31days on market $180,000 Active 79 DOM
-
2026-03-13$180,000 Active 137-char remark
Show marketing remark (137 chars)
NO HOA! Move-in ready! Located in a desirable school zone and just 3 minutes from Beltway 8, this 2-story home is priced to sell quickly!
-
2026-03-13historical
Show marketing remark (137 chars)
NO HOA! Move-in ready! Located in a desirable school zone and just 3 minutes from Beltway 8, this 2-story home is priced to sell quickly!
-
2026-02-21price $180,000
-
2026-02-21price $18,000
-
2026-01-15$210,000 Active
-
2026-01-15historical
-
2026-01-05price $210,000
-
2025-10-03$220,000 Active
-
2025-08-21historical $1,850
-
2025-08-09price $1,850
-
2025-08-09price $1,900
-
2025-08-07price $1,850
-
2025-07-08$1,900
-
2025-06-30historical $1,900
-
2025-06-19$1,900
-
2024-09-15historical $1,900
-
2024-08-25$1,900
-
2024-07-24soldstatus
-
2024-07-23soldstatus Sold
-
2024-06-20status Pending
-
2024-06-14price $189,000
-
2024-06-02$199,000 Active
-
1997-12-08soldstatus $77,672
-
1997-12-01soldstatus $61,500
ⓘ Source: listings_history table (triggers on properties + properties_extension) + one-shot
backfill from property_details.listing_events for pre-trigger history.
Tax reassessment forecast TX · Resets to sale price
- Current annual tax
- $4,302 · $358/mo
- Projected year-2 tax
- $4,302 · $358/mo
- Expected delta
- $0/yr ($0/mo · 0.0%)
ⓘ Screening estimate from a state-policy table — verify with the county assessor before closing.
Climate risk First Street
- Flood 1/10 Low FEMA zone X (shaded) · 0% chance over 30 yrs
- Wildfire 3/10 Moderate
- Heat 9/10 Extreme 7 d/yr ≥108°F today · 24 d/yr by 30 yrs out
- Wind 9/10 Extreme 99% chance of damaging wind over 30 yrs
- Air quality 2/10 Low 1 unhealthy d/yr today · 2 by 30 yrs out
Nearby sold comps map
Loading sold comps map…
Walkable amenities ~0.75 mi
Loading nearby amenities…
Taxation est. · year 1
- Rental income
- $21,690
- − Mortgage interest
- −$10,083
- − Property taxes
- −$4,302
- − Insurance
- −$900
- − Repairs & maintenance
- −$1,735
- − Management
- −$1,735
- − Depreciation
- −$5,236
- Taxable loss
- −$2,301
- Est. tax savings @ 24.0%
- +$552
- After-tax cash flow
- $1,158/yr
For passive investors: Depreciation is non-cash, so a rental often shows a tax loss while cash-flowing — sheltering income. Rental losses are passive: they offset passive income freely, and up to $25,000/yr can offset ordinary (W-2) income if you actively participate and your MAGI is under $100k (phasing out to $0 by $150k); unused losses carry forward. On sale, claimed depreciation is recaptured at up to 25%, and gains may owe capital-gains tax (a 1031 exchange can defer both). Figures are a year-1 estimate at your 24.0% rate — not tax advice; consult a CPA.
Schools (NCES district)
- District
- Pasadena ISD
- NCES district ID
- 4834320
- Math proficiency
- 29% ▼ -17.00%
- Reading proficiency
- 32% ▼ -9.00%
- Median HH income
- $45,163
- Composite
- 26.15/100
- National rank
- #7275
- State rank
- #612 of 826 in TX
Livability — Houston
- Score
- 74/100
- State rank
- #184
- US rank
- #4771
Category grades
Schools grade is shown separately in the Schools card above.
Census & demographics
- Census place
- Houston, TX
- County
- Harris County · 4,702,590 people
- City population
- 3,226,434
- Metro
- Houston-The Woodlands-Sugar Land, TX
- Population (ZIP)
- 40,626
- Household income
- $69,191
- Rent vs Own
- Severe rent burden
- 1573.0
Population outlook (Harris County) Hauer SSP2
- Today (2025)
- 5,571,493 people
- By 2030
- 6,089,821 · +9.3%
- By 2040
- 7,142,806 · +28.2%
- By 2050
- 8,185,864 · +46.9%
- By 2075
- 10,574,329 · +89.8%
- By 2100
- 12,109,958 · +117.4%
Race, ethnicity, and origin ACS 2023
- Neighborhood character
- Predominantly Hispanic (71%)
- Race & ethnicity
- Hispanic / Latino 71% Two or more races 34% Black 14% White 7% Asian 6% Native American 1%
- Hispanic origin (detail)
- Mexican 53%
- Common ancestry
- Lithuanian 1%
- Foreign-born
- 30% · Canada, Vietnam, Jamaica
- Languages at home
- 34% English-only · Spanish 60% Vietnamese 6%
Political lean MEDSL · Harris
- 2024 margin
- Lean D (+5.5) · D 52.0% · R 46.4% · Other 1.6%
- 2008→2024 swing
- +3.9pp toward D · 2008: 1.6pp · 2024: 5.5pp
- All cycles
- 2024: D+5.5 2020: D+13.3 2016: D+12.4 2012: D+0.1 2008: D+1.6
Not yet ingested
- Civics
- —
Market trends
- HPI YoY
- ▼ -88.33%
- Current HPI
- 260.3733
- Rent YoY
- ▲ 2.17%
- Metro
- Houston-The Woodlands-Sugar Land, TX
- State GDP YoY
- ▲ 3.95%
- F500 in state
- 110
Industry mix (Fortune 500 HQ in TX)
| Industry | F500 HQs | Revenue |
|---|---|---|
| Energy | 16 | $1,198B |
|
||
| Technology | 5 | $198B |
|
||
| Engineering / Construction | 4 | $72B |
|
||
| Energy Services | 3 | $60B |
|
||
| Utilities | 3 | $41B |
|
||
| Healthcare | 2 | $330B |
|
||
Price history
+192.7% since first listed24 events — show timeline
- 2026-03-13 Listing Removed — HARMLS
- 2026-03-13 Listed $180,000 HARMLS
- 2026-02-21 Price Changed $180,000 HARMLS
- 2026-02-21 Price Changed $18,000 HARMLS
- 2026-01-15 Listing Removed — HARMLS
- 2026-01-15 Listed $210,000 HARMLS
- 2026-01-05 Price Changed $210,000 HARMLS
- 2025-10-03 Listed $220,000 HARMLS
- 2025-08-21 Rental Removed $1,850 HARMLS
- 2025-08-09 Price Changed $1,850 HARMLS
- 2025-08-09 Price Changed $1,900 HARMLS
- 2025-08-07 Price Changed $1,850 HARMLS
- 2025-07-08 Listed for Rent $1,900 HARMLS
- 2025-06-30 Rental Removed $1,900 HARMLS
- 2025-06-19 Listed for Rent $1,900 HARMLS
- 2024-09-15 Rental Removed $1,900 HARMLS
- 2024-08-25 Listed for Rent $1,900 HARMLS
- 2024-07-24 Sold (Public Records) — Public Records
- 2024-07-23 Sold (MLS) — HARMLS
- 2024-06-20 Pending — HARMLS
- 2024-06-14 Price Changed $189,000 HARMLS
- 2024-06-02 Listed $199,000 HARMLS
- 1997-12-08 Sold (Public Records) $77,672 Public Records
- 1997-12-01 Sold (Public Records) $61,500 Public Records
Property tax history
+2.5%/yrLatest (2025): $4,302 · +25.7% YoY. Source: county tax records.
Cash-flow waterfall
monthlySold comps — $/sqft
last 12 mo · ≤1 miLoading sold comps…