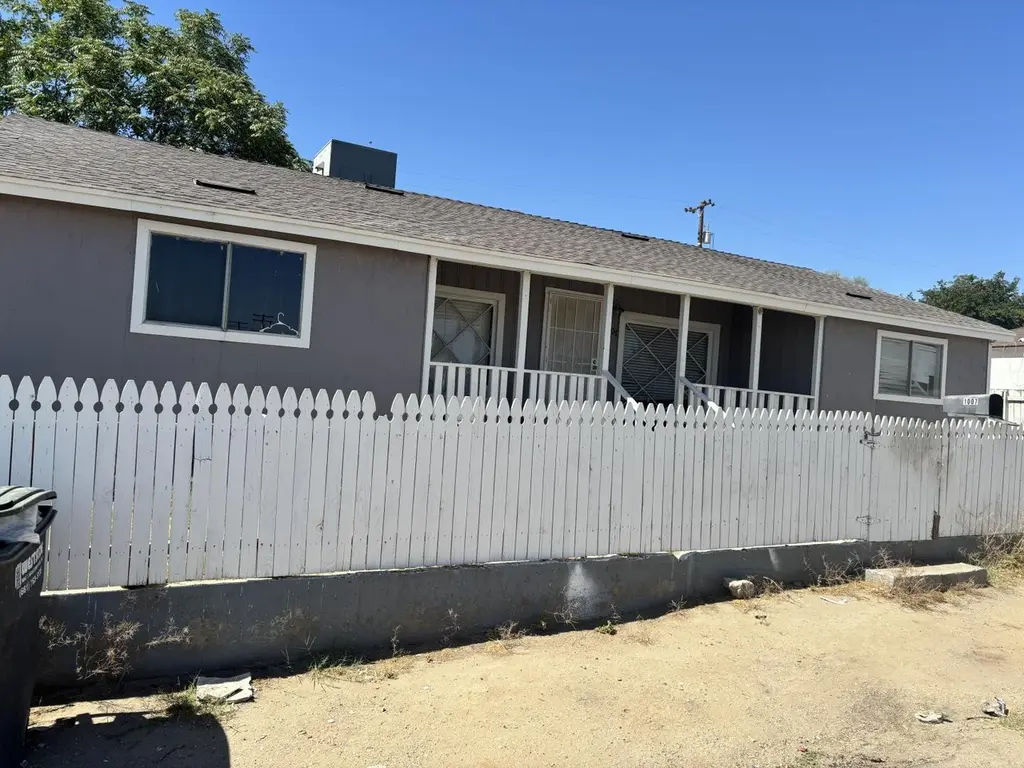
1007 Wood · South Taft, CA
Flood risk 1/10 · Minimal
- FEMA flood zone
- X (unshaded)
- Chance of flooding over 30 yrs
- 0.0%
- Est. flood insurance / yr
- $507 – $1,088
Fire risk 8/10 · Major
- Est. fire insurance / yr
- $659 – $1,223
Heat risk 8/10 · Major
- Hot days now (above 102°F)
- 4 days/yr
- Hot days in 30 yrs
- 10 days/yr
Wind risk 1/10 · Minimal
- Chance of severe wind over 30 yrs
- —
Air-quality risk 8/10 · Major
- Unhealthy air days now
- 18 days/yr
- Unhealthy air days in 30 yrs
- 22 days/yr
Risk factors via First Street. Map © Google.
Why this score? — see what drove the C- grade
The composite is a weighted blend of 9 inputs, each scored 0–100. Each bar is that input's sub-score; the figure is the points it added to the 100-point composite (weight × sub-score).
- Cash flow +15.2/30.0
- ARV discount +15.0/15.0
- Rent growth +5.0/5.0
- DSCR +4.7/10.0
- 1% rule +4.4/10.0
- Schools +3.1/10.0
- Condition / age +2.5/5.0
- Livability +2.3/5.0
- Appreciation +0.0/10.0
$185,000
🖨 Deal sheet (PDF) 📄 Offer letter ✓ Due diligence
Listing remarks MLS
Remodeled and spacious home located in the heart of Taft with 4 bedrooms and 2 full bathrooms. This property features a newer AC unit, roof, and flooring, along with an open-concept living and dining area designed for comfortable everyday living and entertaining. The kitchen offers generous counter space, and the bathrooms have modern fixtures and finishes. A good-sized backyard includes a storage shed and added flexibility for outdoor use. Alley access provides convenient additional parking from the rear, along with front parking options.
Key facts
- Newer ac unit
- Newer flooring
- Newer roof
Tags
Property features AI
Exterior
- Parking: Attached or detached 5-car garage; Parking area
- Utilities: Public water; Public sewer; Other utilities (see remarks)
- Home design: Detached single-story home; Raised foundation
- Construction: Raised foundation
- Exterior features: Composition roof; Property faces south; R-1 zoning
Interior
- Kitchen: Gas oven/range; Refrigerator
- Bedrooms: 4 bedrooms
- Flooring: Laminate flooring; Wood flooring
- Bathrooms: 2 full bathrooms
- Heating & cooling: Forced air heating; Central forced air cooling
- Interior features: Separate family room; Breakfast nook
- Laundry & utility: Laundry inside
Neighborhood map
What this means for you Summary
Snapshot
- This is a 4-bed/2.0-bath single-family listed at $185k.
Deal economics
- At list price, monthly cash flow is $66 ($791/yr) — positive.
- The deal already cash-flows at list — no discount required.
- To meet the 1% rule (rent ≥ 1% of price), the offer needs to be $174k (6.2% below list).
- Recommended offer: $174k (6.2% below list) — sets the bar for 1% rule.
Location & tenants
- Location reads 46/100 on livability (#1,271 in CA) — a working-class tenant base; expect higher turnover. Strengths: cost of living B; Watch: amenities F, commute F, employment F.
- Taft City (town): math 28% / reading 39% proficiency, ranked #946 of 1,400 in CA (top 68%) — families likely to look elsewhere, expect single-tenant / working-renter base with shorter leases; 67% free/reduced lunch — lower-income household profile, screen leases tightly.
- Zoned schools: Roosevelt Elementary (math 24% / reading 24%, grade F, #973 of 1,571 statewide, top 73%, 475 students, 89% FRL); Lincoln Junior High (math 75% / reading 75%, grade A, #25 of 498 statewide, top 6%, 795 students, 89% FRL); Taft Union High (math 8% / reading 47%, grade F, #785 of 1,170 statewide, top 67%, 1,102 students, 59% FRL).
- Market conditions: Rents rising fast (+13.6%/yr); 125 active listings in the ZIP; 2 comparable units currently listed for rent nearby; 3,244 units permitted in Kern County in 2024 (73 in 5+ unit buildings).
- This rent runs 36% of the median local income ($58k/yr) — at the standard rent-burdened threshold; future hikes will face affordability resistance.
Forward outlook
- Local home prices are declining (-3.0%/yr); year-one equity from $1k of loan paydown is wiped out by about $6k of value loss. Plan a longer hold.
- Kern County population projected at +17% by 2050 — long-run rental-demand tailwind backs the buy-and-hold thesis.
Negotiation context
- Only 9 days on market — expect competitive offers; lowballing is unlikely to land.
- 4 sale attempts since 3y ago; this cycle's ask has dropped $10k (5%) from the opening price — seller is motivated, your offer sets the floor, not the list.
Risks & watch-outs
- Watch-outs: built in 1925 — expect roof / HVAC / electrical / plumbing capex.
- Climate carrying-cost: severe wildfire risk; extreme-heat days projected 4→10/yr by 2055 (HVAC capex compounding) — expect insurance premiums to compound above CPI over the hold.
Questions for the listing agent
- Built in 1925 — when were the roof, HVAC, electrical panel, plumbing, and water heater last replaced?
- Is there a deadline driving the sale (1031 exchange, divorce, estate, relocation)? That informs how much negotiation room exists.
- Schools are F-rated, which usually means shorter tenancies and higher turnover. Who's the typical renter profile here, and what's been the actual vacancy rate?
- What's the average days-on-market for RENTAL listings here right now (not sales)? A rising rental-DOM trend means longer vacancies and softer asking-rent achievability than the comps imply.
- What's the recent tenant-quality profile in this submarket — average credit score on applications, eviction rate, late-payment / NSF rate, and stable-employment percentage? A property-management company in the area should have these aggregated.
- How much new for-sale + rental construction is in the pipeline within 1–3 miles? Heavy new supply typically softens prices + rents 12–24 months out; constrained supply supports both.
Investment metrics
- 1% rule
- 0.94% ✗
- Cap rate
- 6.72%
- Cash-on-cash
- 1.53%
- DSCR
- 1.07
- GRM
- 8.9
CMA / ARV
- ARV (on-the-fly)
- $263,445
- Comps found
- 12
Show comp detail 12 sales within ~0.75 mi
| Address | Dist | Beds/Ba | Sqft | Sold | Price | $/sf | Match |
|---|---|---|---|---|---|---|---|
| 809 Buena Vista St | 0.15mi | 3/2.0 (-1) | 1,248 (-8%) | 6mo | $249,000 | $200 | 70 |
| 122 E Kern St | 0.57mi | 3/1.0 (-1) | 1,359 (+1%) | 0mo | $270,000 | $199 | 63 |
| 314 Lierly | 0.56mi | 3/2.0 (-1) | 1,296 (-4%) | 14mo | $205,000 | $158 | 50 |
| 1020 Stevens St | 0.05mi | 3/1.0 (-1) | 1,185 (-12%) | 22mo | $184,700 | $156 | 50 |
| 113 Q St | 0.66mi | 4/1.0 | 1,464 (+8%) | 4mo | $104,900 | $72 | 47 |
| 104 E Kern St | 0.55mi | 3/1.0 (-1) | 1,246 (-8%) | 8mo | $185,000 | $148 | 46 |
| 615 2nd St | 0.74mi | 3/2.0 (-1) | 1,224 (-9%) | 3mo | $260,000 | $212 | 42 |
| 206 E Lucard St | 0.64mi | 3/2.0 (-1) | 1,292 (-4%) | 19mo | $275,000 | $213 | 42 |
| 104 Center St | 0.42mi | 3/1.8 (-1) | 1,192 (-12%) | 17mo | $187,000 | $157 | 41 |
| 104 Pico St | 0.75mi | 3/2.0 (-1) | 1,204 (-11%) | 4mo | $199,900 | $166 | 39 |
| 406 S 8th | 0.75mi | 3/2.0 (-1) | 1,320 (-2%) | 21mo | $320,000 | $242 | 38 |
| 123 E San Emidio St | 0.66mi | 3/1.8 (-1) | 1,486 (+10%) | 19mo | $290,000 | $195 | 31 |
Match score weights: distance 35% · size 25% · config 20% · recency 20%. Top-matched comps best support the ARV.
Projected returns pro-forma
-3.0% appreciation · 8.0% rent growth · sell at horizon
- IRR
- -8.3%
- Equity multiple
- 0.68×
- Total profit
- $-16,567
- Equity at exit
- $27,584
- IRR
- 6.9%
- Equity multiple
- 1.63×
- Total profit
- $32,888
- Equity at exit
- $15,995
Cash invested: $51,800 (down + closing). Projections, not guarantees.
Landlord ↔ Tenant lean methodology
- Overall (STATE)
- 18 Strongly Tenant-Friendly
- State California
- 18 Strongly Tenant-Friendly · D+13
- County
- — inherits STATE
- City
- — inherits STATE
ZIP-level market 93268
- Home prices YoY
- -29.6%
- Rents YoY
- 13.6%
- Active inventory
- 125
- Price-to-rent
- 8.9×
Monthly cashflow live
- Estimated rent
- $1,735 medium interval (Pro) →
- Mortgage (P&I)
- −$970
- Tax from tax record
- −$258 /mo · $3,091/yr
- Insurance
- −$77
- HOA
- −$0
- Vacancy / Maint / Mgmt
- −$364
- Net cashflow
- $66
Break-even live
Sensitivity live
| Price | -10% $171 | -5% $118 | +0% $66 | +5% $14 | +10% $-39 |
|---|---|---|---|---|---|
| Rent | -10% $-71 | -5% $-3 | +0% $66 | +5% $134 | +10% $203 |
| Rate | -1.0pp $159 | -0.5pp $113 | base $66 | +0.5pp $18 | +1.0pp $-31 |
UW: 25.0% down · 7.5% · 30yr · 1.5% tax · 5.0% vac · 8.0% maint · 8.0% mgmt
Financing live
Cash to close
- Down payment
- $46,250
- Closing costs
- $5,550
- Reserves months
- —
- Total cash needed
- —
Loan-product check · same deal, 3 products live
Conventional
25% down · 7.5% · 30yr
- Down + closing
- —
- Monthly P&I
- —
- Monthly cashflow
- —
- DSCR
- —
- Eligible?
- —
Personal DTI + credit; lowest rate.
DSCR
20% down · 8.5% · 30yr
- Down + closing
- —
- Monthly P&I
- —
- Monthly cashflow
- —
- DSCR
- —
- Eligible?
- —
No personal income docs; deal must DSCR.
Hard money
10% down · 12.0% · 12mo
- Down + closing
- —
- Monthly P&I
- —
- Monthly cashflow
- —
- DSCR
- —
- Eligible?
- —
Short-term bridge; refi at stabilization.
Rent comps 2 comps
| Address | Beds | Baths | Sqft | Rent | $/sqft | DOM | Units | Dist |
|---|---|---|---|---|---|---|---|---|
| 522 Center St Unit D Taft, CA | 3.0 | 1.0 | 1047 | $1,325 | $1.27 | 23d | 1 | 0.73mi |
| 620 Graydon Ave Taft, CA | 3.0 | 2.0 | 1223 | $2,475 | $2.02 | 4d | 1 | 1.47mi |
Listing history 8 events
-
2026-06-21days on market $185,000 Active 9 DOM
-
2026-06-18days on market $185,000 Active 6 DOM
-
2026-06-17price $185,000 Active 5 DOM
-
2026-06-17days on market $195,000 Active 5 DOM
-
2026-06-16days on market $195,000 Active 4 DOM
-
2026-06-15days on market $195,000 Active 3 DOM
-
2026-06-13remarks 545-char remark
-
2026-06-13$195,000 Active 1 DOM
ⓘ Source: listings_history table (triggers on properties + properties_extension) + one-shot
backfill from property_details.listing_events for pre-trigger history.
Tax reassessment forecast CA · Resets to sale price
- Current annual tax
- $3,091 · $258/mo
- Projected year-2 tax
- $3,091 · $258/mo
- Expected delta
- $0/yr ($0/mo · 0.0%)
ⓘ Screening estimate from a state-policy table — verify with the county assessor before closing.
Climate risk First Street
- Flood 1/10 Low FEMA zone X (unshaded) · 0% chance over 30 yrs
- Wildfire 8/10 Severe
- Heat 8/10 Severe 4 d/yr ≥102°F today · 10 d/yr by 30 yrs out
- Wind 1/10 Low
- Air quality 8/10 Severe 18 unhealthy d/yr today · 22 by 30 yrs out
Nearby sold comps map
Loading sold comps map…
Walkable amenities ~0.75 mi
Loading nearby amenities…
Taxation est. · year 1
- Rental income
- $20,822
- − Mortgage interest
- −$10,363
- − Property taxes
- −$3,091
- − Insurance
- −$925
- − Repairs & maintenance
- −$1,666
- − Management
- −$1,666
- − Depreciation
- −$5,382
- Taxable loss
- −$2,271
- Est. tax savings @ 24.0%
- +$545
- After-tax cash flow
- $1,336/yr
For passive investors: Depreciation is non-cash, so a rental often shows a tax loss while cash-flowing — sheltering income. Rental losses are passive: they offset passive income freely, and up to $25,000/yr can offset ordinary (W-2) income if you actively participate and your MAGI is under $100k (phasing out to $0 by $150k); unused losses carry forward. On sale, claimed depreciation is recaptured at up to 25%, and gains may owe capital-gains tax (a 1031 exchange can defer both). Figures are a year-1 estimate at your 24.0% rate — not tax advice; consult a CPA.
Schools (NCES district)
- District
- Taft City
- NCES district ID
- 0638700
- Math proficiency
- 28% ▲ 2.00%
- Reading proficiency
- 39% ▲ 2.00%
- Median HH income
- $42,498
- Composite
- 31.06/100
- National rank
- #11302
- State rank
- #946 of 1400 in CA
Livability — South Taft
- Score
- 46/100
- State rank
- #1271
- US rank
- #26438
Category grades
Schools grade is shown separately in the Schools card above.
Census & demographics
- Census place
- South Taft, CA
- County
- Kern County · 710,371 people
- Metro
- Bakersfield, CA
- Population (ZIP)
- 16,963
- Household income
- $57,778
- Rent vs Own
- Severe rent burden
- 819.0
Population outlook (Kern County) Hauer SSP2
- Today (2025)
- 947,286 people
- By 2030
- 978,984 · +3.3%
- By 2040
- 1,045,018 · +10.3%
- By 2050
- 1,105,232 · +16.7%
- By 2075
- 1,229,538 · +29.8%
- By 2100
- 1,238,059 · +30.7%
Race, ethnicity, and origin ACS 2023
- Neighborhood character
- Majority White (51%)
- Race & ethnicity
- White 51% Hispanic / Latino 44% Two or more races 14%
- Hispanic origin (detail)
- Mexican 42%
- Common ancestry
- Slovak 2% Italian 1% Portuguese 1%
- Foreign-born
- 16% · Canada
- Languages at home
- 65% English-only · Spanish 34%
Political lean MEDSL · Kern
- 2024 margin
- Strong R (+21.1) · D 38.2% · R 59.3% · Other 2.5%
- 2008→2024 swing
- -3.3pp toward R · 2008: -17.8pp · 2024: -21.1pp
- All cycles
- 2024: R+21.1 2020: R+10.2 2016: R+15.0 2012: R+20.9 2008: R+17.8
Not yet ingested
- Civics
- —
Market trends
- HPI YoY
- ▼ -124.10%
- Current HPI
- 295.2655
- Rent YoY
- ▲ 13.62%
- Metro
- Bakersfield, CA
- State GDP YoY
- ▲ 3.21%
- F500 in state
- 116
Industry mix (Fortune 500 HQ in CA)
| Industry | F500 HQs | Revenue |
|---|---|---|
| Technology | 27 | $1,492B |
|
||
| Financial Services | 3 | $174B |
|
||
| Retail | 3 | $44B |
|
||
| Insurance | 3 | $26B |
|
||
| Media / Entertainment | 2 | $115B |
|
||
| Pharmaceuticals / Biotech | 2 | $62B |
|
||
Price history
+95.0% since first listed9 events — show timeline
- 2026-06-12 Listed $195,000 MLSListings
- 2026-06-12 Listed $195,000 bridgeMLS, Bay East AOR, or Contra Costa AOR
- 2023-07-25 Sold (Public Records) $190,000 Public Records
- 2023-07-25 Sold (MLS) $190,000 GEMLS
- 2023-06-20 Pending — GEMLS
- 2023-06-13 Relisted — GEMLS
- 2023-06-07 Pending — GEMLS
- 2023-05-08 Listed $198,000 GEMLS
- 2022-03-28 Sold (Public Records) $100,000 Public Records
Property tax history
+10.5%/yrLatest (2025): $3,091 · +3.7% YoY. Source: county tax records.
Cash-flow waterfall
monthlySold comps — $/sqft
last 12 mo · ≤1 miLoading sold comps…