7467 S Telegraph Rd · Toledo, OH
Flood risk 4/10 · Minor
- FEMA flood zone
- X (unshaded)
- Chance of flooding over 30 yrs
- 0.21%
- Est. flood insurance / yr
- $507 – $1,088
Fire risk 1/10 · Minimal
- Est. fire insurance / yr
- $784 – $1,456
Heat risk 3/10 · Minor
- Hot days now (above 101°F)
- 7 days/yr
- Hot days in 30 yrs
- 16 days/yr
Wind risk 2/10 · Minimal
- Chance of severe wind over 30 yrs
- —
Air-quality risk 2/10 · Minimal
- Unhealthy air days now
- 1 days/yr
- Unhealthy air days in 30 yrs
- 2 days/yr
Risk factors via First Street. Map © Google.
Why this score? — see what drove the B- grade
The composite is a weighted blend of 9 inputs, each scored 0–100. Each bar is that input's sub-score; the figure is the points it added to the 100-point composite (weight × sub-score).
- Cash flow +30.0/30.0
- 1% rule +10.0/10.0
- DSCR +10.0/10.0
- ARV discount +7.5/15.0
- Schools +3.8/10.0
- Livability +3.3/5.0
- Rent growth +2.5/5.0
- Condition / age +2.5/5.0
- Appreciation +0.0/10.0
$79,900
🖨 Deal sheet 📄 Offer letter ✓ Due diligence
Listing remarks MLS
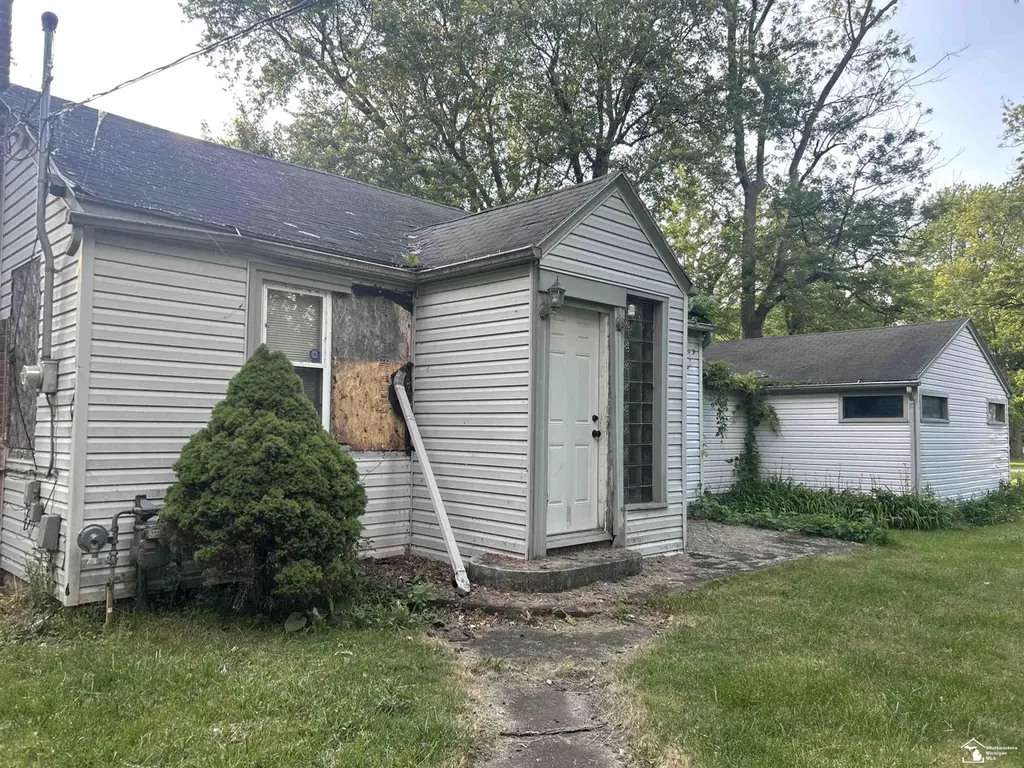
Opportunity awaits! Bring your imagination and renovation skills to this fixer-upper situated on over 1.3 acres across three lots. This property features 2 bedrooms, 1 full bath, and an attached 2-car garage. Both bedrooms are non-conforming and do not include closets. Whether you're looking for your next investment project, a renovation opportunity, or a place to create your dream home, the possibilities are endless. Enjoy the extra space, privacy, and potential that come with this generously sized property. Property is being sold AS-IS. Don't miss your chance to unlock the value and make this property your own!
Key facts
- Three lots
- Over 1.3 acres
- 1.31 acre lot
Tags
Property features AI
Exterior
- Parking: Attached 2-car garage
- Utilities: Private well water; Septic sewer; Electric service (standard)
- Home design: Residential property; One-story structure; Built in 1937
- Construction: Crawl foundation
- Exterior features: Aluminum, vinyl and metal siding; Frontage on a road; Lot acreage approximately 1.31 acres; Frontage approximately 207 feet
Interior
- Kitchen: 16 x 9 kitchen on main level; Laminate flooring in kitchen; Range/Oven; Refrigerator
- Bedrooms: Main-level bedroom (14 x 11) with carpet; Main-level bedroom (9 x 10) with carpet; First-floor bedroom
- Flooring: Carpet in bedrooms and living room; Laminate in dining room and kitchen
- Bathrooms: 1 full bathroom (main level)
- Heating & cooling: Forced air heating; No cooling system listed; Natural gas fuel
- Interior features: Total of 5 rooms; Main floor full bathroom; Basement: none
- Laundry & utility: No basement
Neighborhood map
What this means for you Summary
Snapshot
- This is a 2-bed/1.0-bath single-family listed at $80k.
Deal economics
- At list price, monthly cash flow is $738 ($9k/yr) — positive.
- The deal already cash-flows at list — no discount required.
- Meets the 1% rule at list price ($2k rent vs $80k).
- Cap rate 17.4% vs local median 7.6% in Toledo — top-decile yield for the area; either an underpriced asset or a hidden risk that comps aren't pricing in. Stress-test before assuming the spread holds.
Location & tenants
- Location reads 66/100 on livability (#645 in OH) — a middle-class / working-renter tenant base. Strengths: cost of living A+, housing A+, health & safety A+; Watch: amenities C-, schools D-, crime F.
- Bedford Public Schools (suburban): math 33% / reading 53% proficiency, ranked #150 of 540 in MI (top 28%) — families likely to look elsewhere, expect single-tenant / working-renter base with shorter leases; only 18% free/reduced lunch — higher-income household profile.
- Market conditions: Solid renter incomes; 264 units permitted in Monroe County in 2024 (40 in 5+ unit buildings).
Forward outlook
- Local home prices are declining (-3.0%/yr); year-one equity from $552 of loan paydown is wiped out by about $2k of value loss. Plan a longer hold.
- Monroe County population projected at -20% by 2050 — secular population decline; favor cash flow + early exit over multi-decade hold.
- At projected returns (-3.0% appreciation + 3.0% rent growth), your $22k cash investment doubles in ~3 years — after that, you're playing with house money.
Negotiation context
- Only 11 days on market — expect competitive offers; lowballing is unlikely to land.
- 6 sale attempts since 19y ago with the ask held roughly flat each time — persistent listings suggest the price (not the market) is what's stuck; bring a comps-based counter.
- Current owner paid $40k; list at $80k implies a 98% gain — meaningful room to come down on a strong offer.
Risks & watch-outs
- Watch-outs: built in 1937 — expect roof / HVAC / electrical / plumbing capex.
Questions for the listing agent
- Built in 1937 — when were the roof, HVAC, electrical panel, plumbing, and water heater last replaced?
- Is there a deadline driving the sale (1031 exchange, divorce, estate, relocation)? That informs how much negotiation room exists.
- Schools are D-rated, which usually means shorter tenancies and higher turnover. Who's the typical renter profile here, and what's been the actual vacancy rate?
- Crime grade is F in this area — have there been break-ins, vandalism, or insurance claims at this property in the last 3 years? What carrier currently insures it and at what premium?
- What's the average days-on-market for RENTAL listings here right now (not sales)? A rising rental-DOM trend means longer vacancies and softer asking-rent achievability than the comps imply.
- What's the recent tenant-quality profile in this submarket — average credit score on applications, eviction rate, late-payment / NSF rate, and stable-employment percentage? A property-management company in the area should have these aggregated.
- How much new for-sale + rental construction is in the pipeline within 1–3 miles? Heavy new supply typically softens prices + rents 12–24 months out; constrained supply supports both.
Investment metrics
- 1% rule
- 1.98% ✓
- Cap rate
- 17.38%
- Cash-on-cash
- 39.61%
- DSCR
- 2.76
- GRM
- 4.2
CMA / ARV
No comps found within radius.
Projected returns pro-forma
-3.0% appreciation · 3.0% rent growth · sell at horizon
- IRR
- 35.9%
- Equity multiple
- 2.52×
- Total profit
- $34,087
- Equity at exit
- $11,913
- IRR
- 42.6%
- Equity multiple
- 5.03×
- Total profit
- $90,247
- Equity at exit
- $6,908
Cash invested: $22,372 (down + closing). Projections, not guarantees.
Monthly cashflow live
- Estimated rent
- $1,585 medium interval (Pro) →
- Mortgage (P&I)
- −$419
- Tax from tax record
- −$61 /mo · $733/yr
- Insurance
- −$33
- HOA
- −$0
- Vacancy / Maint / Mgmt
- −$333
- Net cashflow
- $738
Break-even live
UW: 25.0% down · 7.5% · 30yr · 1.5% tax · 5.0% vac · 8.0% maint · 8.0% mgmt
Financing live
Cash to close
- Down payment
- $19,975
- Closing costs
- $2,397
- Reserves months
- —
- Total cash needed
- —
Loan-product check · same deal, 3 products live
Conventional
25% down · 7.5% · 30yr
- Down + closing
- —
- Monthly P&I
- —
- Monthly cashflow
- —
- DSCR
- —
- Eligible?
- —
Personal DTI + credit; lowest rate.
DSCR
20% down · 8.5% · 30yr
- Down + closing
- —
- Monthly P&I
- —
- Monthly cashflow
- —
- DSCR
- —
- Eligible?
- —
No personal income docs; deal must DSCR.
Hard money
10% down · 12.0% · 12mo
- Down + closing
- —
- Monthly P&I
- —
- Monthly cashflow
- —
- DSCR
- —
- Eligible?
- —
Short-term bridge; refi at stabilization.
Listing history 10 events
-
2026-06-18days on market $79,900 Active 11 DOM
-
2026-06-17days on market $79,900 Active 10 DOM
-
2026-06-16days on market $79,900 Active 9 DOM
-
2026-06-15days on market $79,900 Active 8 DOM
-
2026-06-14days on market $79,900 Active 6 DOM
-
2026-06-10days on market $79,900 Active 3 DOM
-
2026-06-09days on market $79,900 Active 2 DOM
-
2026-06-08$79,900 Active 1 DOM
-
2026-06-07remarks 620-char remark
Show marketing remark (620 chars)
Opportunity awaits! Bring your imagination and renovation skills to this fixer-upper situated on over 1.3 acres across three lots. This property features 2 bedrooms, 1 full bath, and an attached 2-car garage. Both bedrooms are non-conforming and do not include closets. Whether you're looking for your next investment project, a renovation opportunity, or a place to create your dream home, the possibilities are endless. Enjoy the extra space, privacy, and potential that come with this generously sized property. Property is being sold AS-IS. Don't miss your chance to unlock the value and make this property your own!
-
2026-06-07$79,900 Active 1 DOM
Show marketing remark (620 chars)
Opportunity awaits! Bring your imagination and renovation skills to this fixer-upper situated on over 1.3 acres across three lots. This property features 2 bedrooms, 1 full bath, and an attached 2-car garage. Both bedrooms are non-conforming and do not include closets. Whether you're looking for your next investment project, a renovation opportunity, or a place to create your dream home, the possibilities are endless. Enjoy the extra space, privacy, and potential that come with this generously sized property. Property is being sold AS-IS. Don't miss your chance to unlock the value and make this property your own!
ⓘ Source: listings_history table (triggers on properties + properties_extension) + one-shot
backfill from property_details.listing_events for pre-trigger history.
Tax reassessment forecast OH · Partial reset (capped growth)
- Current annual tax
- $733 · $61/mo
- Projected year-2 tax
- $990 · $82/mo
- Expected delta
- +$257/yr (+$21/mo · 35.0%)
ⓘ Screening estimate from a state-policy table — verify with the county assessor before closing.
Climate risk First Street
- Flood 4/10 Moderate FEMA zone X (unshaded) · 21% chance over 30 yrs
- Wildfire 1/10 Low
- Heat 3/10 Moderate 7 d/yr ≥101°F today · 16 d/yr by 30 yrs out
- Wind 2/10 Low
- Air quality 2/10 Low 1 unhealthy d/yr today · 2 by 30 yrs out
Nearby sold comps map
Loading sold comps map…
Walkable amenities ~0.75 mi
Loading nearby amenities…
Taxation est. · year 1
- Rental income
- $19,015
- − Mortgage interest
- −$4,476
- − Property taxes
- −$733
- − Insurance
- −$400
- − Repairs & maintenance
- −$1,521
- − Management
- −$1,521
- − Depreciation
- −$2,324
- Taxable income
- $8,041
- Est. tax owed @ 24.0%
- −$1,930
- After-tax cash flow
- $6,932/yr
For passive investors: Depreciation is non-cash, so a rental often shows a tax loss while cash-flowing — sheltering income. Rental losses are passive: they offset passive income freely, and up to $25,000/yr can offset ordinary (W-2) income if you actively participate and your MAGI is under $100k (phasing out to $0 by $150k); unused losses carry forward. On sale, claimed depreciation is recaptured at up to 25%, and gains may owe capital-gains tax (a 1031 exchange can defer both). Figures are a year-1 estimate at your 24.0% rate — not tax advice; consult a CPA.
Schools (NCES district)
- District
- Bedford Public Schools
- NCES district ID
- 2604470
- Math proficiency
- 33% ▼ -14.00%
- Reading proficiency
- 53% ▼ -3.00%
- Median HH income
- $63,784
- Composite
- 38.22/100
- National rank
- #4252
- State rank
- #150 of 540 in MI
Livability — Toledo
- Score
- 66/100
- State rank
- #645
- US rank
- #11442
Category grades
Schools grade is shown separately in the Schools card above.
Census & demographics
- County
- Monroe · 13,010 people
- City population
- 280,811
- Metro
- Monroe, MI
- Population (ZIP)
- 20,705
- Household income
- $83,155
- Rent vs Own
- Severe rent burden
- 12.7
Population outlook (Monroe County) Hauer SSP2
- Today (2025)
- 144,439 people
- By 2030
- 140,033 · -3.1%
- By 2040
- 128,408 · -11.1%
- By 2050
- 115,024 · -20.4%
- By 2075
- 87,273 · -39.6%
- By 2100
- 63,110 · -56.3%
Race, ethnicity, and origin ACS 2023
- Neighborhood character
- Predominantly White (90%)
- Race & ethnicity
- White 90% Hispanic / Latino 6% Two or more races 5% Black 1%
- Hispanic origin (detail)
- Mexican 4%
- Common ancestry
- Romanian 14% Lithuanian 4% Italian 3%
- Foreign-born
- 2% · Canada
- Languages at home
- 97% English-only · Spanish 2% Other Indo-European 1%
Political lean MEDSL · Monroe
- 2024 margin
- Strong R (+27.1) · D 35.7% · R 62.9% · Other 1.4%
- 2008→2024 swing
- -31.5pp toward R · 2008: 4.3pp · 2024: -27.1pp
- All cycles
- 2024: R+27.1 2020: R+22.6 2016: R+22.1 2012: D+1.0 2008: D+4.3
Not yet ingested
- Civics
- —
Market trends
- HPI YoY
- ▼ -140.99%
- Current HPI
- 158.2484
- Rent YoY
- —
- Metro
- —
- State GDP YoY
- ▲ 1.98%
- F500 in state
- 48
Industry mix (Fortune 500 HQ in OH)
| Industry | F500 HQs | Revenue |
|---|---|---|
| Insurance | 3 | $145B |
|
||
| Industrial Machinery | 3 | $49B |
|
||
| Financial Services | 3 | $24B |
|
||
| Consumer Goods | 2 | $93B |
|
||
| Aerospace / Defense | 2 | $47B |
|
||
| Utilities | 2 | $33B |
|
||
Price history
+100.3% since first listed13 events — show timeline
- 2026-06-07 Listed $79,900 REALCOMP
- 2026-06-07 Listed $79,900 MiRealSource-MiMLS
- 2008-06-25 Sold (Public Records) $40,400 Public Records
- 2008-06-20 Sold (MLS) $40,400 MiRealSource-MiMLS
- 2008-06-20 Sold (MLS) $40,400 REALCOMP
- 2008-06-11 Listing Removed — MiRealSource-MiMLS
- 2008-05-13 Sold (MLS) $27,000 MiRealSource-MiMLS
- 2008-05-09 Sold (MLS) $27,000 REALCOMP
- 2008-05-09 Listing Removed — MiRealSource-MiMLS
- 2008-04-07 Listed $39,900 MiRealSource-MiMLS
- 2008-04-07 Listed $39,900 REALCOMP
- 2007-07-25 Listed $39,900 REALCOMP
- 2007-07-25 Listed $39,900 MiRealSource-MiMLS
Property tax history
-4.5%/yrLatest (2025): $733 · -57.4% YoY. Source: county tax records.
Cash-flow waterfall
monthlySold comps — $/sqft
last 12 mo · ≤1 miLoading sold comps…