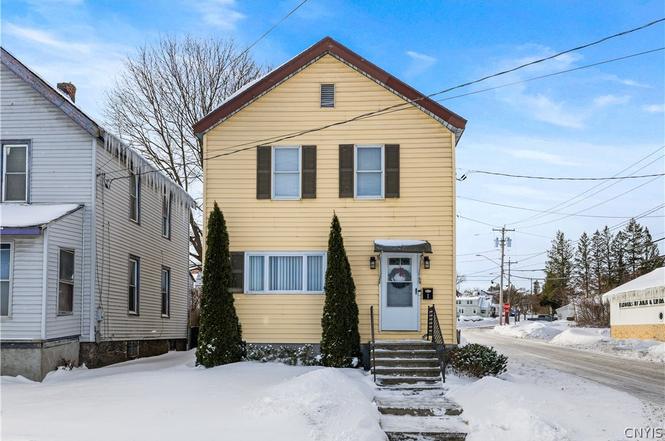
1 Lamott Ave · Yorkville, NY
Flood risk 1/10 · Minimal
- FEMA flood zone
- X (unshaded)
- Chance of flooding over 30 yrs
- 0.0%
- Est. flood insurance / yr
- $473 – $860
Fire risk 3/10 · Minor
- Est. fire insurance / yr
- $691 – $1,283
Heat risk 3/10 · Minor
- Hot days now (above 96°F)
- 7 days/yr
- Hot days in 30 yrs
- 16 days/yr
Wind risk 1/10 · Minimal
- Chance of severe wind over 30 yrs
- 1.0%
Air-quality risk 2/10 · Minimal
- Unhealthy air days now
- 0 days/yr
- Unhealthy air days in 30 yrs
- 2 days/yr
Risk factors via First Street. Map © Google.
Why this score? — see what drove the C+ grade
The composite is a weighted blend of 9 inputs, each scored 0–100. Each bar is that input's sub-score; the figure is the points it added to the 100-point composite (weight × sub-score).
- Cash flow +25.3/30.0
- DSCR +8.3/10.0
- 1% rule +6.6/10.0
- Appreciation +5.9/10.0
- Schools +5.2/10.0
- ARV discount +4.7/15.0
- Livability +3.6/5.0
- Rent growth +2.5/5.0
- Condition / age +2.5/5.0
$169,900
🖨 Deal sheet 📄 Offer letter ✓ Due diligence
Listing remarks MLS
Move in condition! Remodeled 3 bedroom 1 bath 2-Story home with beautiful living room, first floor laundry, new bath, carpets, tile, freshly painted, nice deck, updated kitchen with new appliances and more! New York Mills Schools.
Key facts
- Tall ceilings
- Backyard
- Large living room
Tags
Property features AI
Exterior
- Parking: No garage
- Utilities: High-speed internet available; Public water (connected); Sewer connected
- Home design: 2-story residence; Existing structure
- Construction: Vinyl siding; Asphalt roof; Stone foundation
- Exterior features: Blacktop driveway; Rectangular residential lot; City street frontage; Lot dimensions approximately 30 x 93
Interior
- Kitchen: Dishwasher; Electric oven; Electric range; Microwave; Refrigerator
- Bedrooms: Total of 7 rooms (includes bedrooms and other living spaces)
- Flooring: Carpet; Laminate; Tile; Varied flooring types
- Bathrooms: 1 full bathroom
- Heating & cooling: Forced air heating; Electric heating; Gas heating
- Interior features: Galley kitchen; Combined living and dining area; Full basement
- Laundry & utility: Main-level laundry; Washer; Dryer; Gas water heater
Neighborhood map
What this means for you Summary
Snapshot
- This is a 3-bed/1.0-bath single-family listed at $170k.
Deal economics
- At list price, monthly cash flow is $385 ($5k/yr) — positive.
- The deal already cash-flows at list — no discount required.
- Meets the 1% rule at list price ($2k rent vs $170k).
- Recommended offer: $160k (6.0% below list) — sets the bar for market timing.
Location & tenants
- Location reads 72/100 on livability (#359 in NY) — a middle-class / working-renter tenant base. Strengths: cost of living A+, housing A+, health & safety A+; Watch: employment D, schools D-, amenities F.
- New York Mills Union Free School District (suburban): math 60% / reading 65% proficiency, ranked #224 of 590 in NY (top 38%) — acceptable for families but not a draw, mixed tenant base, ~2y average lease.
- Market conditions: 12 active listings in the ZIP; 3 comparable units currently listed for rent nearby; rentals lingering (median 44d on market — plan ~5-8 weeks vacancy on turnover, expect pricing pressure); 100% of comp listings sitting > 30 days — soft ceiling on asking rent; 204 units permitted in Oneida County in 2024 (68 in 5+ unit buildings).
Forward outlook
- In year one you build about $4k of equity ($1k loan paydown + $3k appreciation (1.9% local appreciation)).
- Oneida County population projected at -12% by 2050 — secular population decline; favor cash flow + early exit over multi-decade hold.
- At projected returns (1.9% appreciation + 3.0% rent growth), your $48k cash investment doubles in ~5 years — after that, you're playing with house money.
- By year 8, paydown + projected appreciation supports a ~$33k cash-out refi (75% LTV) — recoverable capital for the next deal without selling this one.
Negotiation context
- It's been on market 74 days — a 6% lower offer ($160k) is reasonable based on typical stale-listing flexibility.
- 4 sale attempts since 12y ago with the ask held roughly flat each time — persistent listings suggest the price (not the market) is what's stuck; bring a comps-based counter.
- Current owner paid $80k; list at $170k implies a 114% gain — meaningful room to come down on a strong offer.
Risks & watch-outs
- Watch-outs: built in 1920 — expect roof / HVAC / electrical / plumbing capex.
Questions for the listing agent
- It's been on market 74 days. Have you received any prior offers? Is the seller open to a 6% concession, seller financing, or rate buy-down credit?
- Built in 1920 — when were the roof, HVAC, electrical panel, plumbing, and water heater last replaced?
- Why hasn't it sold? Are there any deal-killer items the seller is aware of (foundation, flood, title, zoning, code violations)?
- Is there a deadline driving the sale (1031 exchange, divorce, estate, relocation)? That informs how much negotiation room exists.
- Schools are D-rated, which usually means shorter tenancies and higher turnover. Who's the typical renter profile here, and what's been the actual vacancy rate?
- What's the average days-on-market for RENTAL listings here right now (not sales)? A rising rental-DOM trend means longer vacancies and softer asking-rent achievability than the comps imply.
- What's the recent tenant-quality profile in this submarket — average credit score on applications, eviction rate, late-payment / NSF rate, and stable-employment percentage? A property-management company in the area should have these aggregated.
- How much new for-sale + rental construction is in the pipeline within 1–3 miles? Heavy new supply typically softens prices + rents 12–24 months out; constrained supply supports both.
Investment metrics
- 1% rule
- 1.16% ✓
- Cap rate
- 9.01%
- Cash-on-cash
- 9.71%
- DSCR
- 1.43
- GRM
- 7.2
CMA / ARV
- ARV (on-the-fly)
- $159,894
- Comps found
- 12
Show comp detail 12 sales within ~0.75 mi
| Address | Dist | Beds/Ba | Sqft | Sold | Price | $/sf | Match |
|---|---|---|---|---|---|---|---|
| 94 Campbell Ave | 0.37mi | 3/1.0 | 1,120 (-1%) | 5mo | $252,350 | $225 | 77 |
| 19 Whitesboro St | 0.12mi | 2/1.0 (-1) | 1,183 (+4%) | 9mo | $166,500 | $141 | 75 |
| 7 6th St | 0.42mi | 3/1.0 | 1,144 (+1%) | 8mo | $220,000 | $192 | 72 |
| 125 Campbell Ave | 0.22mi | 2/1.0 (-1) | 1,174 (+4%) | 8mo | $183,200 | $156 | 72 |
| 10 Russell Ave | 0.35mi | 3/1.5 | 1,110 (-2%) | 10mo | $119,500 | $108 | 70 |
| 2206 Caroline St | 0.35mi | 4/1.0 (+1) | 1,155 (+2%) | 7mo | $212,000 | $184 | 70 |
| 18 Trinity Ave | 0.25mi | 2/2.0 (-1) | 1,122 (-1%) | 11mo | $103,000 | $92 | 68 |
| 305 Calder Ave | 0.23mi | 4/1.0 (+1) | 1,050 (-7%) | 6mo | $100,000 | $95 | 67 |
| 2133 Mcbride Ave | 0.42mi | 3/1.0 | 1,200 (+6%) | 8mo | $154,500 | $129 | 64 |
| 913 Champlin Ave | 0.27mi | 3/1.5 | 1,252 (+10%) | 7mo | $135,000 | $108 | 62 |
| 1405 Kellogg Ave | 0.71mi | 3/1.0 | 1,140 (+0%) | 7mo | $172,000 | $151 | 60 |
| 1209 Ney Ave | 0.58mi | 3/1.0 | 1,250 (+10%) | 1mo | $162,500 | $130 | 55 |
Match score weights: distance 35% · size 25% · config 20% · recency 20%. Top-matched comps best support the ARV.
Projected returns pro-forma
1.9% appreciation · 3.0% rent growth · sell at horizon
- IRR
- 13.8%
- Equity multiple
- 1.74×
- Total profit
- $35,297
- Equity at exit
- $66,066
- IRR
- 16.6%
- Equity multiple
- 3.19×
- Total profit
- $104,016
- Equity at exit
- $94,415
Cash invested: $47,572 (down + closing). Projections, not guarantees.
Landlord ↔ Tenant lean methodology
- Overall (STATE)
- 15 Strongly Tenant-Friendly
- State New York
- 15 Strongly Tenant-Friendly · D+10
- County
- — inherits STATE
- City
- — inherits STATE
ZIP-level market 13495
- Home prices YoY
- 0.7%
- Active inventory
- 12
- Price-to-rent
- 7.2×
Monthly cashflow live
- Estimated rent
- $1,973 medium interval (Pro) →
- Mortgage (P&I)
- −$891
- Tax est. 1.5%
- −$212 /mo · $2,548/yr
- Insurance
- −$71
- HOA
- −$0
- Vacancy / Maint / Mgmt
- −$414
- Net cashflow
- $385
Break-even live
UW: 25.0% down · 7.5% · 30yr · 1.5% tax · 5.0% vac · 8.0% maint · 8.0% mgmt
Financing live
Cash to close
- Down payment
- $42,475
- Closing costs
- $5,097
- Reserves months
- —
- Total cash needed
- —
Loan-product check · same deal, 3 products live
Conventional
25% down · 7.5% · 30yr
- Down + closing
- —
- Monthly P&I
- —
- Monthly cashflow
- —
- DSCR
- —
- Eligible?
- —
Personal DTI + credit; lowest rate.
DSCR
20% down · 8.5% · 30yr
- Down + closing
- —
- Monthly P&I
- —
- Monthly cashflow
- —
- DSCR
- —
- Eligible?
- —
No personal income docs; deal must DSCR.
Hard money
10% down · 12.0% · 12mo
- Down + closing
- —
- Monthly P&I
- —
- Monthly cashflow
- —
- DSCR
- —
- Eligible?
- —
Short-term bridge; refi at stabilization.
Rent comps 3 comps
| Address | Beds | Baths | Sqft | Rent | $/sqft | DOM | Units | Dist |
|---|---|---|---|---|---|---|---|---|
| 4 1st St Yorkville, NY | 3.0 | 1.0 | 888 | $2,100 | $2.36 | 43d | 1 | 0.13mi |
| 1224 Whitesboro St Unit 1 Utica, NY | 3.0 | 1.0 | 1100 | $1,125 | $1.02 | 43d | 1 | 1.04mi |
| 1503 Fox Pl Utica, NY | 3.0 | 1.0 | 1119 | $2,000 | $1.79 | 43d | 1 | 1.26mi |
Listing history 8 events
-
2026-05-02status Pending
-
2026-04-01status Active
-
2026-03-10historical Active Under Contract
-
2026-03-02status Active
-
2026-02-27historical Active Under Contract
-
2026-02-16$169,900 Active
-
2015-02-12soldstatus $79,500 230-char remark
Show marketing remark (230 chars)
Move in condition! Remodeled 3 bedroom 1 bath 2-Story home with beautiful living room, first floor laundry, new bath, carpets, tile, freshly painted, nice deck, updated kitchen with new appliances and more! New York Mills Schools.
-
2014-10-16$79,900 230-char remark
Show marketing remark (230 chars)
Move in condition! Remodeled 3 bedroom 1 bath 2-Story home with beautiful living room, first floor laundry, new bath, carpets, tile, freshly painted, nice deck, updated kitchen with new appliances and more! New York Mills Schools.
ⓘ Source: listings_history table (triggers on properties + properties_extension) + one-shot
backfill from property_details.listing_events for pre-trigger history.
Climate risk First Street
- Flood 1/10 Low FEMA zone X (unshaded) · 0% chance over 30 yrs
- Wildfire 3/10 Moderate
- Heat 3/10 Moderate 7 d/yr ≥96°F today · 16 d/yr by 30 yrs out
- Wind 1/10 Low 100% chance of damaging wind over 30 yrs
- Air quality 2/10 Low 0 unhealthy d/yr today · 2 by 30 yrs out
Nearby sold comps map
Loading sold comps map…
Walkable amenities ~0.75 mi
Loading nearby amenities…
Taxation est. · year 1
- Rental income
- $23,680
- − Mortgage interest
- −$9,517
- − Property taxes
- −$2,548
- − Insurance
- −$850
- − Repairs & maintenance
- −$1,894
- − Management
- −$1,894
- − Depreciation
- −$4,943
- Taxable income
- $2,034
- Est. tax owed @ 24.0%
- −$488
- After-tax cash flow
- $4,130/yr
For passive investors: Depreciation is non-cash, so a rental often shows a tax loss while cash-flowing — sheltering income. Rental losses are passive: they offset passive income freely, and up to $25,000/yr can offset ordinary (W-2) income if you actively participate and your MAGI is under $100k (phasing out to $0 by $150k); unused losses carry forward. On sale, claimed depreciation is recaptured at up to 25%, and gains may owe capital-gains tax (a 1031 exchange can defer both). Figures are a year-1 estimate at your 24.0% rate — not tax advice; consult a CPA.
Schools (NCES district)
- District
- New York Mills Union Free School District
- NCES district ID
- 3620610
- Math proficiency
- 60% ▲ 5.00%
- Reading proficiency
- 65% ▲ 13.00%
- Median HH income
- $40,329
- Composite
- 52.21/100
- National rank
- #1605
- State rank
- #224 of 590 in NY
Livability — Yorkville
- Score
- 72/100
- State rank
- #359
- US rank
- #6063
Category grades
Schools grade is shown separately in the Schools card above.
Census & demographics
- Census place
- Yorkville, NY
- City population
- 1,889
- Population (ZIP)
- 1,889
Population outlook (Oneida County) Hauer SSP2
- Today (2025)
- 225,223 people
- By 2030
- 220,384 · -2.1%
- By 2040
- 209,071 · -7.2%
- By 2050
- 197,920 · -12.1%
- By 2075
- 175,541 · -22.1%
- By 2100
- 148,491 · -34.1%
Race, ethnicity, and origin ACS 2023
- Neighborhood character
- Predominantly White (93%)
- Race & ethnicity
- White 93% Two or more races 5% Asian 1%
- Common ancestry
- Romanian 28% Lithuanian 5% American 3%
- Foreign-born
- 4% · China
- Languages at home
- 96% English-only · Russian/Polish/Slavic 4%
Political lean MEDSL · Oneida
- 2024 margin
- Strong R (+21.3) · D 39.4% · R 60.6%
- 2008→2024 swing
- -15.2pp toward R · 2008: -6.1pp · 2024: -21.3pp
- All cycles
- 2024: R+21.3 2020: R+15.5 2016: R+21.1 2012: R+5.3 2008: R+6.1
Not yet ingested
- Civics
- —
Market trends
- HPI YoY
- ▲ 1.90%
- Current HPI
- 286.6347
- Rent YoY
- —
- Metro
- —
- State GDP YoY
- ▲ 2.60%
- F500 in state
- 92
Industry mix (Fortune 500 HQ in NY)
| Industry | F500 HQs | Revenue |
|---|---|---|
| Financial Services | 10 | $950B |
|
||
| Consumer Goods | 9 | $162B |
|
||
| Insurance | 4 | $225B |
|
||
| Telecommunications | 2 | $144B |
|
||
| Pharmaceuticals | 2 | $112B |
|
||
| Media / Entertainment | 2 | $69B |
|
||
Price history
+112.6% since first listed8 events — show timeline
- 2026-05-02 Pending — CNYIS
- 2026-04-01 Relisted — CNYIS
- 2026-03-10 Contingent — CNYIS
- 2026-03-02 Relisted — CNYIS
- 2026-02-27 Contingent — CNYIS
- 2026-02-16 Listed $169,900 CNYIS
- 2015-02-12 Sold (MLS) $79,500 CNYIS
- 2014-10-16 Listed $79,900 CNYIS
Cash-flow waterfall
monthlySold comps — $/sqft
last 12 mo · ≤1 miLoading sold comps…