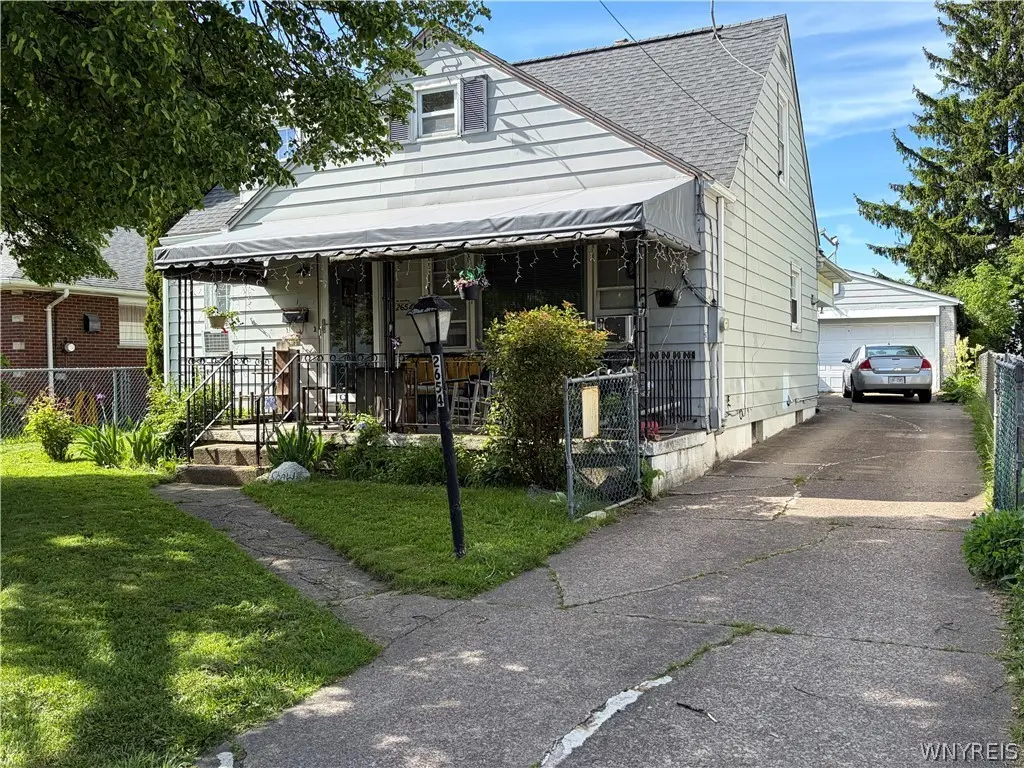
2654 North Ave · Niagara Falls, NY
Flood risk 1/10 · Minimal
- FEMA flood zone
- X (unshaded)
- Chance of flooding over 30 yrs
- 0.0%
- Est. flood insurance / yr
- $473 – $860
Fire risk 1/10 · Minimal
- Est. fire insurance / yr
- $691 – $1,283
Heat risk 3/10 · Minor
- Hot days now (above 95°F)
- 7 days/yr
- Hot days in 30 yrs
- 15 days/yr
Wind risk 1/10 · Minimal
- Chance of severe wind over 30 yrs
- —
Air-quality risk 3/10 · Minor
- Unhealthy air days now
- 2 days/yr
- Unhealthy air days in 30 yrs
- 3 days/yr
Risk factors via First Street. Map © Google.
Why this score? — see what drove the B- grade
The composite is a weighted blend of 9 inputs, each scored 0–100. Each bar is that input's sub-score; the figure is the points it added to the 100-point composite (weight × sub-score).
- Cash flow +26.2/30.0
- ARV discount +13.7/15.0
- DSCR +8.9/10.0
- 1% rule +7.7/10.0
- Livability +3.0/5.0
- Rent growth +2.5/5.0
- Schools +2.5/10.0
- Condition / age +2.5/5.0
- Appreciation +0.0/10.0
$134,500
🖨 Deal sheet 📄 Offer letter ✓ Due diligence
Listing remarks
East of Hyde park , Cape Cod full front porch, 4 bedrooms, rear addition with Family Room and Dining Room combination, wood stove, Furnace 3 months old, Roof approx. .3 years old , concrete Drive Way , detached 2 Car garage with remote opener.
Key facts
- Wood stove
- Furnace 3 months old
- 5,214 sq ft lot
Tags
Property features AI
Exterior
- Parking: Detached 2-car garage with garage door opener
- Utilities: Public water (connected); Sewer connected; Circuit breaker electric
- Home design: One story; Existing/resale property
- Construction: Aluminum siding; Copper plumbing; Asphalt architectural shingle roof; Poured foundation
- Exterior features: Concrete driveway; Open porch; Pet fence
Interior
- Kitchen: Dishwasher; Eat-in kitchen
- Bedrooms: Bedroom on main level; First-floor bedroom (Bedroom 1, approx. 12 x 11); Second-floor bedroom (Bedroom 2); Second-floor bedroom (Bedroom 3, approx. 16 x 12); Second-floor bedroom (Bedroom 4, approx. 14 x 11)
- Flooring: Carpet; Hardwood; Vinyl; Varies
- Bathrooms: One full bathroom (main level)
- Heating & cooling: Gas forced-air heating; Heating noted as 'See Remarks'
- Interior features: Ceiling fan(s); Separate/formal dining room; Entrance foyer; Eat-in kitchen; Separate/formal living room
- Laundry & utility: Laundry in basement; Gas water heater
Neighborhood map
What this means for you Summary
Snapshot
- This is a 4-bed/1.0-bath single-family listed at $134k.
Deal economics
- At list price, monthly cash flow is $344 ($4k/yr) — positive.
- The deal already cash-flows at list — no discount required.
- Meets the 1% rule at list price ($2k rent vs $134k).
- Cap rate 9.4% vs local median 7.7% in Niagara Falls — meaningfully above typical; check what's discounted (condition, days-on-market, listing class) to confirm the premium yield is real.
Location & tenants
- Location reads 60/100 on livability (#956 in NY) — a middle-class / working-renter tenant base. Strengths: cost of living A+, housing A+; Watch: schools F, crime F, amenities F.
- Niagara Falls City School District (urban): math 26% / reading 34% proficiency, ranked #578 of 590 in NY (top 98%) — families likely to look elsewhere, expect single-tenant / working-renter base with shorter leases; 66% free/reduced lunch — lower-income household profile, screen leases tightly.
- Market conditions: 142 active listings in the ZIP; 6 comparable units currently listed for rent nearby; rentals at typical pace (median 24d on market — plan ~3-4 weeks tenant-placement turnaround); 167 units permitted in Niagara County in 2024 (0 in 5+ unit buildings).
- This rent runs 40% of the median local income ($51k/yr) — at the standard rent-burdened threshold; future hikes will face affordability resistance.
Forward outlook
- Local home prices are declining (-3.0%/yr); year-one equity from $930 of loan paydown is wiped out by about $4k of value loss. Plan a longer hold.
- Niagara County population projected at -19% by 2050 — secular population decline; favor cash flow + early exit over multi-decade hold.
- At projected returns (-3.0% appreciation + 3.0% rent growth), your $38k cash investment doubles in ~10 years — after that, you're playing with house money.
Negotiation context
- Only 2 days on market — expect competitive offers; lowballing is unlikely to land.
Risks & watch-outs
- Watch-outs: built in 1952 — expect roof / HVAC / electrical / plumbing capex.
Questions for the listing agent
- Built in 1952 — when were the roof, HVAC, electrical panel, plumbing, and water heater last replaced?
- Is there a deadline driving the sale (1031 exchange, divorce, estate, relocation)? That informs how much negotiation room exists.
- Schools are F-rated, which usually means shorter tenancies and higher turnover. Who's the typical renter profile here, and what's been the actual vacancy rate?
- Crime grade is F in this area — have there been break-ins, vandalism, or insurance claims at this property in the last 3 years? What carrier currently insures it and at what premium?
- What's the average days-on-market for RENTAL listings here right now (not sales)? A rising rental-DOM trend means longer vacancies and softer asking-rent achievability than the comps imply.
- What's the recent tenant-quality profile in this submarket — average credit score on applications, eviction rate, late-payment / NSF rate, and stable-employment percentage? A property-management company in the area should have these aggregated.
- How much new for-sale + rental construction is in the pipeline within 1–3 miles? Heavy new supply typically softens prices + rents 12–24 months out; constrained supply supports both.
Investment metrics
- 1% rule
- 1.27% ✓
- Cap rate
- 9.36%
- Cash-on-cash
- 10.95%
- DSCR
- 1.49
- GRM
- 6.6
CMA / ARV
- ARV (on-the-fly)
- $156,000
- Comps found
- 12
Show comp detail 12 sales within ~0.75 mi
| Address | Dist | Beds/Ba | Sqft | Sold | Price | $/sf | Match |
|---|---|---|---|---|---|---|---|
| 2915 Porter Rd | 0.21mi | 4/1.5 | 1,484 (-5%) | 1mo | $171,720 | $116 | 80 |
| 3210 Niagara Ave | 0.26mi | 3/1.5 (-1) | 1,521 (-2%) | 7mo | $214,500 | $141 | 71 |
| 1857 Ontario Ave | 0.46mi | 5/1.5 (+1) | 1,546 (-1%) | 1mo | $85,000 | $55 | 69 |
| 2233 South Ave | 0.40mi | 3/2.5 (-1) | 1,553 (-0%) | 3mo | $155,000 | $100 | 67 |
| 2415 Linwood Ave | 0.48mi | 3/1.5 (-1) | 1,584 (+2%) | 6mo | $145,000 | $92 | 63 |
| 2456 South Ave | 0.27mi | 3/1.0 (-1) | 1,380 (-12%) | 2mo | $120,000 | $87 | 62 |
| 2434 Weston Ave | 0.34mi | 3/1.0 (-1) | 1,400 (-10%) | 4mo | $170,000 | $121 | 59 |
| 1868 Niagara Ave | 0.44mi | 4/1.0 | 1,360 (-13%) | 5mo | $68,000 | $50 | 54 |
| 2902 Linwood Ave | 0.42mi | 3/1.0 (-1) | 1,376 (-12%) | 4mo | $180,000 | $131 | 52 |
| 2722 Willow Ave | 0.47mi | 3/1.5 (-1) | 1,412 (-10%) | 8mo | $190,000 | $135 | 49 |
| 2962 Weston Ave | 0.36mi | 3/2.5 (-1) | 1,760 (+13%) | 4mo | $155,000 | $88 | 47 |
| 1849 Niagara Ave | 0.48mi | 3/1.0 (-1) | 1,336 (-14%) | 5mo | $65,000 | $49 | 44 |
Match score weights: distance 35% · size 25% · config 20% · recency 20%. Top-matched comps best support the ARV.
Projected returns pro-forma
-3.0% appreciation · 3.0% rent growth · sell at horizon
- IRR
- 0.1%
- Equity multiple
- 1.00×
- Total profit
- $166
- Equity at exit
- $20,054
- IRR
- 9.8%
- Equity multiple
- 1.76×
- Total profit
- $28,622
- Equity at exit
- $11,629
Cash invested: $37,660 (down + closing). Projections, not guarantees.
Landlord ↔ Tenant lean methodology
- Overall (STATE)
- 15 Strongly Tenant-Friendly
- State New York
- 15 Strongly Tenant-Friendly · D+10
- County
- — inherits STATE
- City
- — inherits STATE
ZIP-level market 14305
- Home prices YoY
- -10.9%
- Active inventory
- 142
- Price-to-rent
- 6.6×
Monthly cashflow live
- Estimated rent
- $1,706 high interval (Pro) →
- Mortgage (P&I)
- −$705
- Tax from tax record
- −$243 /mo · $2,913/yr
- Insurance
- −$56
- HOA
- −$0
- Vacancy / Maint / Mgmt
- −$358
- Net cashflow
- $344
Break-even live
UW: 25.0% down · 7.5% · 30yr · 1.5% tax · 5.0% vac · 8.0% maint · 8.0% mgmt
Financing live
Cash to close
- Down payment
- $33,625
- Closing costs
- $4,035
- Reserves months
- —
- Total cash needed
- —
Loan-product check · same deal, 3 products live
Conventional
25% down · 7.5% · 30yr
- Down + closing
- —
- Monthly P&I
- —
- Monthly cashflow
- —
- DSCR
- —
- Eligible?
- —
Personal DTI + credit; lowest rate.
DSCR
20% down · 8.5% · 30yr
- Down + closing
- —
- Monthly P&I
- —
- Monthly cashflow
- —
- DSCR
- —
- Eligible?
- —
No personal income docs; deal must DSCR.
Hard money
10% down · 12.0% · 12mo
- Down + closing
- —
- Monthly P&I
- —
- Monthly cashflow
- —
- DSCR
- —
- Eligible?
- —
Short-term bridge; refi at stabilization.
Rent comps 6 comps
| Address | Beds | Baths | Sqft | Rent | $/sqft | DOM | Units | Dist |
|---|---|---|---|---|---|---|---|---|
| 2020 Forest Ave Niagara Falls, NY | 4.0 | 2.0 | 1600 | $1,500 | $0.94 | 16d | 1 | 0.91mi |
| 1001 17th St Niagara Falls, NY | 3.0 | 1.0 | 1152 | $1,800 | $1.56 | 23d | 1 | 1.01mi |
| 784 15th St Niagara Falls, NY | 3.0 | 1.5 | 1380 | $1,350 | $0.98 | 3d | 1 | 1.14mi |
| 3025 Macklem Ave Niagara Falls, NY | 4.0 | 1.5 | 1750 | $2,200 | $1.26 | 43d | 1 | 1.33mi |
| 420 25th St Niagara Falls, NY | 3.0 | 1.0 | 1101 | $1,500 | $1.36 | 43d | 1 | 1.45mi |
| 3225 Belden Pl Niagara Falls, NY | 5.0 | 1.5 | 1344 | $1,750 | $1.30 | 1d | 1 | 1.49mi |
Listing history 1 events
-
2026-05-26$134,500 Active
ⓘ Source: listings_history table (triggers on properties + properties_extension) + one-shot
backfill from property_details.listing_events for pre-trigger history.
Tax reassessment forecast NY · Partial reset (capped growth)
- Current annual tax
- $2,913 · $243/mo
- Projected year-2 tax
- $2,913 · $243/mo
- Expected delta
- $0/yr ($0/mo · 0.0%)
ⓘ Screening estimate from a state-policy table — verify with the county assessor before closing.
Climate risk First Street
- Flood 1/10 Low FEMA zone X (unshaded) · 0% chance over 30 yrs
- Wildfire 1/10 Low
- Heat 3/10 Moderate 7 d/yr ≥95°F today · 15 d/yr by 30 yrs out
- Wind 1/10 Low
- Air quality 3/10 Moderate 2 unhealthy d/yr today · 3 by 30 yrs out
Nearby sold comps map
Loading sold comps map…
Walkable amenities ~0.75 mi
Loading nearby amenities…
Taxation est. · year 1
- Rental income
- $20,473
- − Mortgage interest
- −$7,534
- − Property taxes
- −$2,913
- − Insurance
- −$672
- − Repairs & maintenance
- −$1,638
- − Management
- −$1,638
- − Depreciation
- −$3,913
- Taxable income
- $2,165
- Est. tax owed @ 24.0%
- −$520
- After-tax cash flow
- $3,605/yr
For passive investors: Depreciation is non-cash, so a rental often shows a tax loss while cash-flowing — sheltering income. Rental losses are passive: they offset passive income freely, and up to $25,000/yr can offset ordinary (W-2) income if you actively participate and your MAGI is under $100k (phasing out to $0 by $150k); unused losses carry forward. On sale, claimed depreciation is recaptured at up to 25%, and gains may owe capital-gains tax (a 1031 exchange can defer both). Figures are a year-1 estimate at your 24.0% rate — not tax advice; consult a CPA.
Schools (NCES district)
- District
- Niagara Falls City School District
- NCES district ID
- 3620820
- Math proficiency
- 26% ▼ -10.00%
- Reading proficiency
- 34% ▲ 3.00%
- Median HH income
- $32,488
- Composite
- 24.5/100
- National rank
- #7655
- State rank
- #578 of 590 in NY
Livability — Niagara Falls
- Score
- 60/100
- State rank
- #956
- US rank
- #18749
Category grades
Schools grade is shown separately in the Schools card above.
Census & demographics
- Census place
- Niagara Falls, NY
- County
- Niagara County · 157,377 people
- City population
- 62,983
- Metro
- Buffalo-Cheektowaga, NY
- Population (ZIP)
- 16,696
- Household income
- $51,004
- Rent vs Own
- Severe rent burden
- 1095.0
Population outlook (Niagara County) Hauer SSP2
- Today (2025)
- 204,149 people
- By 2030
- 197,900 · -3.1%
- By 2040
- 182,239 · -10.7%
- By 2050
- 165,198 · -19.1%
- By 2075
- 129,416 · -36.6%
- By 2100
- 96,222 · -52.9%
Race, ethnicity, and origin ACS 2023
- Neighborhood character
- Diverse neighborhood (Simpson 0.63)
- Race & ethnicity
- White 55% Black 24% Two or more races 13% Hispanic / Latino 8% Asian 1% Native American 1%
- Hispanic origin (detail)
- Puerto Rican 4%
- Common ancestry
- Romanian 6% Slovak 2% Lithuanian 2%
- Foreign-born
- 6% · Canada, Jamaica
- Languages at home
- 93% English-only · Spanish 4% Other Indo-European 1%
Political lean MEDSL · Niagara
- 2024 margin
- R (+14.9) · D 42.5% · R 57.5%
- 2008→2024 swing
- -15.9pp toward R · 2008: 1.0pp · 2024: -14.9pp
- All cycles
- 2024: R+14.9 2020: R+9.7 2016: R+19.0 2012: D+0.6 2008: D+1.0
Not yet ingested
- Civics
- —
Market trends
- HPI YoY
- ▼ -43.08%
- Current HPI
- 350.8741
- Rent YoY
- —
- Metro
- Buffalo-Cheektowaga, NY
- State GDP YoY
- ▲ 2.60%
- F500 in state
- 92
Industry mix (Fortune 500 HQ in NY)
| Industry | F500 HQs | Revenue |
|---|---|---|
| Financial Services | 10 | $950B |
|
||
| Consumer Goods | 9 | $162B |
|
||
| Insurance | 4 | $225B |
|
||
| Telecommunications | 2 | $144B |
|
||
| Pharmaceuticals | 2 | $112B |
|
||
| Media / Entertainment | 2 | $69B |
|
||
Price history
1 event — show timeline
- 2026-05-26 Listed $134,500 WNYREIS
Property tax history
+10.5%/yrLatest (2025): $2,913 · +28.9% YoY. Source: county tax records.
Cash-flow waterfall
monthlySold comps — $/sqft
last 12 mo · ≤1 miLoading sold comps…