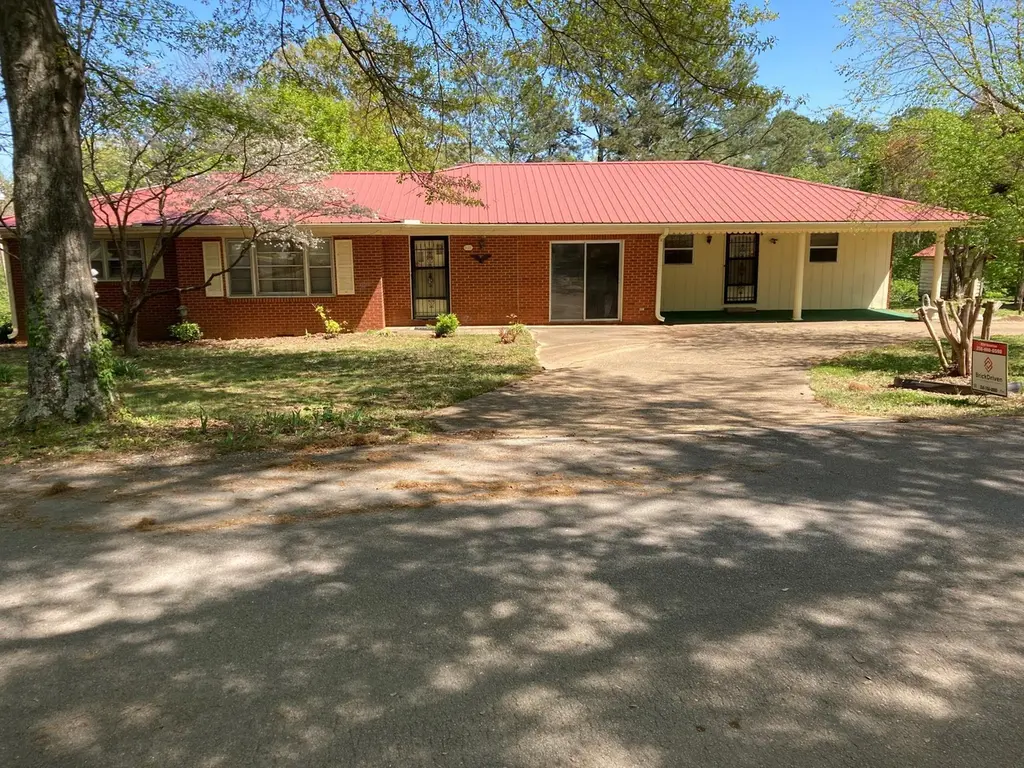
221 8th St · Red Bay, AL
Flood risk No data
- FEMA flood zone
- —
- Chance of flooding over 30 yrs
- —
- Est. flood insurance / yr
- —
Fire risk No data
- Est. fire insurance / yr
- —
Heat risk No data
- Hot days now (above threshold)
- —
- Hot days in 30 yrs
- —
Wind risk No data
- Chance of severe wind over 30 yrs
- —
Air-quality risk No data
- Unhealthy air days now
- —
- Unhealthy air days in 30 yrs
- —
Risk factors via First Street. Map © Google.
Why this score? — see what drove the C grade
The composite is a weighted blend of 9 inputs, each scored 0–100. Each bar is that input's sub-score; the figure is the points it added to the 100-point composite (weight × sub-score).
- Cash flow +16.9/30.0
- ARV discount +15.0/15.0
- DSCR +5.3/10.0
- Appreciation +5.0/10.0
- 1% rule +4.6/10.0
- Livability +3.2/5.0
- Rent growth +2.5/5.0
- Schools +2.2/10.0
- Condition / age +2.2/5.0
$120,000
🖨 Deal sheet 📄 Offer letter ✓ Due diligence
Listing remarks
Located on the East Side of Red Bay's Downtown this spacious 3 bedroom 2bath home is close to many restaurants, grocery store and Dollar General. This home sits on a large lot with room for a garden and has large shade trees in the front with a overlooking the back yard.
Key facts
- Garden
- Large shade trees
- Large lot
Tags
Property features AI
Exterior
- Parking: Detached carport; 1 carport space
- Utilities: Public water; Public sewer; Natural gas available and connected; Cable available; Water connected; Sewer connected; Power connected
- Home design: Single-family residential property; R1 zoning
- Construction: Brick construction; Metal roof
- Exterior features: City lot; 210 ft frontage; Chip-and-seal road access; Publicly maintained road; City street frontage
Interior
- Kitchen: Electric oven
- Bedrooms: 3 main-level bedrooms
- Flooring: Carpet
- Bathrooms: 2 full bathrooms
- Heating & cooling: Natural gas heating; Ductless heating; Ceiling fans; Window air conditioning units
- Interior features: Wood window frames; Storage; Deck; Crawl space
- Laundry & utility: Dedicated laundry room
Neighborhood map
What this means for you Summary
Snapshot
- This is a 3-bed/2.0-bath single-family listed at $120k. Condition is rated fair.
Deal economics
- At list price, monthly cash flow is $79 ($947/yr) — positive.
- The deal already cash-flows at list — no discount required.
- To meet the 1% rule (rent ≥ 1% of price), the offer needs to be $115k (4.2% below list).
- Recommended offer: $106k (12.0% below list) — sets the bar for market timing.
Location & tenants
- Location reads 63/100 on livability (#194 in AL) — a middle-class / working-renter tenant base. Strengths: cost of living A+, health & safety A+, crime B; Watch: amenities F, commute F, employment F.
- Franklin County (rural): math 17% / reading 36% proficiency, ranked #84 of 129 in AL (top 65%) — low school quality limits family demand, transient renter base, plan for 1-2y turnover.
- Zoned schools: Red Bay Elementary (math 22% / reading 45%, grade F, #318 of 627 statewide, top 51%, 421 students, 51% FRL); Red Bay High School (math 12% / reading 37%, grade F, #118 of 305 statewide, top 45%, 351 students, 51% FRL) — zoned schools at 51% FRL track the district average.
- Market conditions: 24 active listings in the ZIP; 15 units permitted in Franklin County in 2024 (0 in 5+ unit buildings).
Forward outlook
- In year one you build about $820 of equity ($830 loan paydown + $-10 appreciation (-0.0% local appreciation)).
- At projected returns (-0.0% appreciation + 3.0% rent growth), your $34k cash investment doubles in ~10 years — after that, you're playing with house money.
Negotiation context
- It's been on market 467 days — a 12% lower offer ($106k) is reasonable based on typical stale-listing flexibility.
- 3 sale attempts since 2y ago; this cycle's ask has dropped $35k (23%) from the opening price — seller is motivated, your offer sets the floor, not the list.
Questions for the listing agent
- It's been on market 467 days. Have you received any prior offers? Is the seller open to a 12% concession, seller financing, or rate buy-down credit?
- Have any recent inspections been done? Can we get a copy of the seller's disclosures and any deferred-maintenance estimates?
- Built in 1968 — when were the roof, HVAC, electrical panel, plumbing, and water heater last replaced?
- Why hasn't it sold? Are there any deal-killer items the seller is aware of (foundation, flood, title, zoning, code violations)?
- Is there a deadline driving the sale (1031 exchange, divorce, estate, relocation)? That informs how much negotiation room exists.
- Schools are D-rated, which usually means shorter tenancies and higher turnover. Who's the typical renter profile here, and what's been the actual vacancy rate?
- What's the average days-on-market for RENTAL listings here right now (not sales)? A rising rental-DOM trend means longer vacancies and softer asking-rent achievability than the comps imply.
- What's the recent tenant-quality profile in this submarket — average credit score on applications, eviction rate, late-payment / NSF rate, and stable-employment percentage? A property-management company in the area should have these aggregated.
- How much new for-sale + rental construction is in the pipeline within 1–3 miles? Heavy new supply typically softens prices + rents 12–24 months out; constrained supply supports both.
Investment metrics
- 1% rule
- 0.96% ✗
- Cap rate
- 7.08%
- Cash-on-cash
- 2.82%
- DSCR
- 1.13
- GRM
- 8.7
CMA / ARV
- ARV (on-the-fly)
- $176,661
- Comps found
- 2
Show comp detail 2 sales within ~0.75 mi
| Address | Dist | Beds/Ba | Sqft | Sold | Price | $/sf | Match |
|---|---|---|---|---|---|---|---|
| 508 7th Ave | 0.35mi | 4/1.5 (+1) | 2,237 (+3%) | 20mo | $155,000 | $69 | 56 |
| 111 Truman St | 0.61mi | 3/3.0 | 1,910 (-12%) | 18mo | $155,000 | $81 | 32 |
Match score weights: distance 35% · size 25% · config 20% · recency 20%. Top-matched comps best support the ARV.
Projected returns pro-forma
-0.01% appreciation · 3.0% rent growth · sell at horizon
- IRR
- 0.9%
- Equity multiple
- 1.04×
- Total profit
- $1,485
- Equity at exit
- $34,792
- IRR
- 6.5%
- Equity multiple
- 1.70×
- Total profit
- $23,523
- Equity at exit
- $41,780
Cash invested: $33,600 (down + closing). Projections, not guarantees.
Landlord ↔ Tenant lean methodology
- Overall (STATE)
- 90 Strongly Landlord-Friendly
- State Alabama
- 90 Strongly Landlord-Friendly · R+15
- County
- — inherits STATE
- City
- — inherits STATE
ZIP-level market 35582
- Home prices YoY
- -0.0%
- Active inventory
- 24
- Price-to-rent
- 8.7×
Monthly cashflow live
- Estimated rent
- $1,150 medium interval (Pro) →
- Mortgage (P&I)
- −$629
- Tax est. 1.5%
- −$150 /mo · $1,800/yr
- Insurance
- −$50
- HOA
- −$0
- Vacancy / Maint / Mgmt
- −$241
- Net cashflow
- $79
Break-even live
UW: 25.0% down · 7.5% · 30yr · 1.5% tax · 5.0% vac · 8.0% maint · 8.0% mgmt
Financing live
Cash to close
- Down payment
- $30,000
- Closing costs
- $3,600
- Reserves months
- —
- Total cash needed
- —
Loan-product check · same deal, 3 products live
Conventional
25% down · 7.5% · 30yr
- Down + closing
- —
- Monthly P&I
- —
- Monthly cashflow
- —
- DSCR
- —
- Eligible?
- —
Personal DTI + credit; lowest rate.
DSCR
20% down · 8.5% · 30yr
- Down + closing
- —
- Monthly P&I
- —
- Monthly cashflow
- —
- DSCR
- —
- Eligible?
- —
No personal income docs; deal must DSCR.
Hard money
10% down · 12.0% · 12mo
- Down + closing
- —
- Monthly P&I
- —
- Monthly cashflow
- —
- DSCR
- —
- Eligible?
- —
Short-term bridge; refi at stabilization.
Listing history 27 events
-
2026-06-19days on market $120,000 Active 467 DOM
-
2026-06-18days on market $120,000 Active 466 DOM
-
2026-06-17days on market $120,000 Active 465 DOM
-
2026-06-16days on market $120,000 Active 464 DOM
-
2026-06-15days on market $120,000 Active 463 DOM
-
2026-06-14days on market $120,000 Active 461 DOM
-
2026-06-13days on market $120,000 Active 460 DOM
-
2026-06-10days on market $120,000 Active 458 DOM
-
2026-06-09days on market $120,000 Active 457 DOM
-
2026-06-08days on market $120,000 Active 456 DOM
-
2026-06-07days on market $120,000 Active 455 DOM
-
2026-06-05days on market $120,000 Active 452 DOM
-
2026-06-03days on market $120,000 Active 451 DOM
-
2026-06-02days on market $120,000 Active 450 DOM
-
2026-06-01days on market $120,000 Active 449 DOM
-
2026-05-31days on market $120,000 Active 448 DOM
-
2026-05-30days on market $120,000 Active 447 DOM
-
2026-05-16status Active
-
2026-04-30status Pending
-
2026-03-27price $120,000
-
2025-10-18price $135,000
-
2025-08-21price $139,900
-
2025-06-04price $149,900
-
2025-02-21$154,900 Active
-
2024-07-10price $159,900
-
2024-06-15price $165,000
-
2024-02-04$169,500 Active
ⓘ Source: listings_history table (triggers on properties + properties_extension) + one-shot
backfill from property_details.listing_events for pre-trigger history.
Nearby sold comps map
Loading sold comps map…
Walkable amenities ~0.75 mi
Loading nearby amenities…
Taxation est. · year 1
- Rental income
- $13,796
- − Mortgage interest
- −$6,722
- − Property taxes
- −$1,800
- − Insurance
- −$600
- − Repairs & maintenance
- −$1,104
- − Management
- −$1,104
- − Depreciation
- −$3,491
- Taxable loss
- −$1,024
- Est. tax savings @ 24.0%
- +$246
- After-tax cash flow
- $1,193/yr
For passive investors: Depreciation is non-cash, so a rental often shows a tax loss while cash-flowing — sheltering income. Rental losses are passive: they offset passive income freely, and up to $25,000/yr can offset ordinary (W-2) income if you actively participate and your MAGI is under $100k (phasing out to $0 by $150k); unused losses carry forward. On sale, claimed depreciation is recaptured at up to 25%, and gains may owe capital-gains tax (a 1031 exchange can defer both). Figures are a year-1 estimate at your 24.0% rate — not tax advice; consult a CPA.
Condition & rehab AI · 12 photos
This home requires moderate renovations to update the kitchen and bathroom, paint interior walls, and replace carpet. It has a good roof and solid foundation, but the dated interior and exterior need attention.
Repairs flagged
- Major kitchen — outdated and in poor condition
- Major bath — outdated and in poor condition
- Major flooring — dated and in poor condition
- Major interior walls/paint — dated and peeling
- Minor exterior/siding — brick siding
- Minor windows — standard windows
- Minor HVAC/mechanicals — standard ceiling fan
Value-add opportunities
- Both paint interior walls — enhances curb appeal and interior aesthetics
- Both replace carpet — improves comfort and appearance
- Both update kitchen and bath — modernizes and increases value
Renovation cost estimate screening
| Repair item | Severity | Est. cost |
|---|---|---|
| kitchen · outdated and in poor condition | Major | $15,000–50,000 |
| bath · outdated and in poor condition | Major | $15,000–50,000 |
| flooring · dated and in poor condition | Major | $15,000–50,000 |
| interior walls/paint · dated and peeling | Major | $15,000–50,000 |
| exterior/siding · brick siding | Minor | $500–3,000 |
| windows · standard windows | Minor | $500–3,000 |
| HVAC/mechanicals · standard ceiling fan | Minor | $500–3,000 |
| Total estimated repair cost · 7 items | $61,500–209,000 |
Value-add ROI direction
- Both paint interior walls — enhances curb appeal and interior aesthetics ↑
- Both replace carpet — improves comfort and appearance ↑
- Both update kitchen and bath — modernizes and increases value ↑
ⓘ Cost ranges are severity-bucket heuristics (US national rule-of-thumb). Get contractor quotes + a written scope before underwriting a rehab budget.
Schools (NCES district)
- District
- Franklin County
- NCES district ID
- 0101590
- Math proficiency
- 17% ▼ -21.00%
- Reading proficiency
- 36% ▼ -1.00%
- Median HH income
- $37,979
- Composite
- 22.08/100
- National rank
- #8187
- State rank
- #84 of 129 in AL
Livability — Red Bay
- Score
- 63/100
- State rank
- #194
- US rank
- #15693
Category grades
Schools grade is shown separately in the Schools card above.
Census & demographics
- Census place
- Red Bay, AL
- Population (ZIP)
- 4,507
Population outlook (Franklin County) Hauer SSP2
- Today (2025)
- 31,545 people
- By 2030
- 31,335 · -0.7%
- By 2040
- 30,983 · -1.8%
- By 2050
- 30,744 · -2.5%
- By 2075
- 30,173 · -4.3%
- By 2100
- 29,478 · -6.6%
Race, ethnicity, and origin ACS 2023
- Neighborhood character
- Predominantly White (92%)
- Race & ethnicity
- White 92% Hispanic / Latino 7% Two or more races 2%
- Hispanic origin (detail)
- Common ancestry
- Slovak 4% Italian 1% Lithuanian 1%
- Foreign-born
- 1% · Canada
- Languages at home
- 95% English-only · Spanish 5%
Political lean MEDSL · Franklin
- 2024 margin
- Solid R (+73.3) · D 13.0% · R 86.2%
- 2008→2024 swing
- -34.1pp toward R · 2008: -39.2pp · 2024: -73.3pp
- All cycles
- 2024: R+73.3 2020: R+65.9 2016: R+60.8 2012: R+40.5 2008: R+39.2
Not yet ingested
- Civics
- —
Market trends
- HPI YoY
- ▬ -0.01%
- Current HPI
- 172.2008
- Rent YoY
- —
- Metro
- —
- State GDP YoY
- ▲ 2.94%
- F500 in state
- 4
Industry mix (Fortune 500 HQ in AL)
| Industry | F500 HQs | Revenue |
|---|---|---|
| Financial Services | 1 | $8B |
|
||
| Healthcare | 1 | $5B |
|
||
Price history
-29.2% since first listed10 events — show timeline
- 2026-05-16 Relisted — SAARMLS
- 2026-04-30 Pending — SAARMLS
- 2026-03-27 Price Changed $120,000 SAARMLS
- 2025-10-18 Price Changed $135,000 SAARMLS
- 2025-08-21 Price Changed $139,900 SAARMLS
- 2025-06-04 Price Changed $149,900 SAARMLS
- 2025-02-21 Listed $154,900 SAARMLS
- 2024-07-10 Price Changed $159,900 SAARMLS
- 2024-06-15 Price Changed $165,000 SAARMLS
- 2024-02-04 Listed $169,500 SAARMLS
Cash-flow waterfall
monthlySold comps — $/sqft
last 12 mo · ≤1 miLoading sold comps…