585 S Royal Crest Cir #13 · Paradise, NV
Flood risk 1/10 · Minimal
- FEMA flood zone
- X (unshaded)
- Chance of flooding over 30 yrs
- 0.0%
- Est. flood insurance / yr
- $507 – $1,088
Fire risk 1/10 · Minimal
- Est. fire insurance / yr
- $490 – $910
Heat risk 8/10 · Major
- Hot days now (above 106°F)
- 7 days/yr
- Hot days in 30 yrs
- 17 days/yr
Wind risk 1/10 · Minimal
- Chance of severe wind over 30 yrs
- —
Air-quality risk 3/10 · Minor
- Unhealthy air days now
- 3 days/yr
- Unhealthy air days in 30 yrs
- 4 days/yr
Risk factors via First Street. Map © Google.
Why this score? — see what drove the C+ grade
The composite is a weighted blend of 9 inputs, each scored 0–100. Each bar is that input's sub-score; the figure is the points it added to the 100-point composite (weight × sub-score).
- Cash flow +26.6/30.0
- DSCR +9.1/10.0
- 1% rule +7.8/10.0
- ARV discount +7.5/15.0
- Livability +3.8/5.0
- Schools +2.6/10.0
- Condition / age +2.5/5.0
- Rent growth +1.4/5.0
- Appreciation +0.0/10.0
$149,000
🖨 Deal sheet 📄 Offer letter ✓ Due diligence
Listing remarks MLS
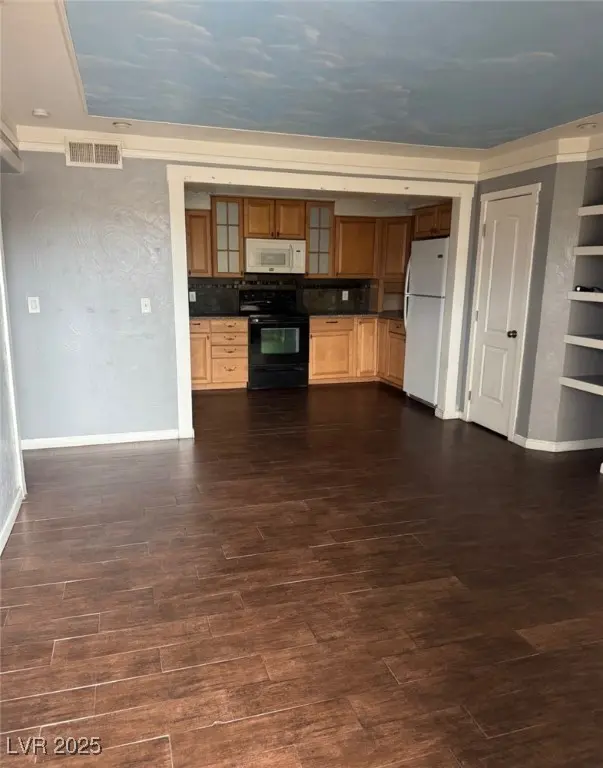
OWNER FINANCE AVAILABLE !Up to 5 year with 20% down and 8% interest rate ! Totally remodeled 2 Bed 1 Bath in 1st floor Corner Unit. Granite Counter . All appliances included. Man made Wooden floor . Walking closets & Plenty of storage. Laundry in unit. Best location near the community pool, Las Vegas Strip & UNLV.
Key facts
- Walking closets
- Plenty of storage
- Granite counter
Tags
Neighborhood map
What this means for you Summary
Snapshot
- This is a 2-bed/1.0-bath condo listed at $149k.
Deal economics
- At list price, monthly cash flow is $399 ($5k/yr) — positive.
- The deal already cash-flows at list — no discount required.
- Meets the 1% rule at list price ($2k rent vs $149k).
- Recommended offer: $131k (12.0% below list) — sets the bar for market timing.
Location & tenants
- Location reads 76/100 on livability (#10 in NV, #3,494 nationally) — a middle-class / working-renter tenant base. Strengths: commute A+, housing A-, cost of living B; Watch: employment D+, schools F, crime D-.
- Clark County School District (urban): math 21% / reading 39% proficiency, ranked #11 of 17 in NV (top 65%) — families likely to look elsewhere, expect single-tenant / working-renter base with shorter leases.
- Market conditions: Rents falling (-4.4%/yr); 178 active listings in the ZIP; 36 comparable units currently listed for rent nearby; rentals lingering (median 44d on market — plan ~5-8 weeks vacancy on turnover, expect pricing pressure); 56% of comp listings sitting > 30 days — soft ceiling on asking rent; lower-income renter base — watch delinquency; 14,754 units permitted in Clark County in 2024 (2,301 in 5+ unit buildings).
- At $1,912/mo this rent would consume 56% of the median local household income ($41k/yr) (locally 2744% of renters already pay >50% of income on rent) — very limited rent-growth headroom before tenants either downsize or default.
Forward outlook
- Local home prices are declining (-3.0%/yr); year-one equity from $1k of loan paydown is wiped out by about $4k of value loss. Plan a longer hold.
- Clark County population projected at +36% by 2050 — long-run rental-demand tailwind backs the buy-and-hold thesis.
Negotiation context
- It's been on market 253 days — a 12% lower offer ($131k) is reasonable based on typical stale-listing flexibility.
- 6 sale attempts since 19y ago; this cycle's ask has dropped $1.65M (92%) from the opening price — seller is motivated, your offer sets the floor, not the list.
- Current owner paid $55k; list at $149k implies a 171% gain — meaningful room to come down on a strong offer.
Risks & watch-outs
- Climate carrying-cost: extreme-heat days projected 7→17/yr by 2055 (HVAC capex compounding) — expect insurance premiums to compound above CPI over the hold.
Questions for the listing agent
- It's been on market 253 days. Have you received any prior offers? Is the seller open to a 12% concession, seller financing, or rate buy-down credit?
- Built in 1963 — when were the roof, HVAC, electrical panel, plumbing, and water heater last replaced?
- What does the HOA fee cover, when was the last increase, and are there any pending special assessments or reserve-fund shortfalls?
- Any open or pending special assessments — roof, HVAC, plumbing, elevator, façade? What's the per-unit balance and payoff schedule, and is the seller paying it off at close or rolling it to the buyer?
- Why hasn't it sold? Are there any deal-killer items the seller is aware of (foundation, flood, title, zoning, code violations)?
- Is there a deadline driving the sale (1031 exchange, divorce, estate, relocation)? That informs how much negotiation room exists.
- Schools are F-rated, which usually means shorter tenancies and higher turnover. Who's the typical renter profile here, and what's been the actual vacancy rate?
- Crime grade is D in this area — have there been break-ins, vandalism, or insurance claims at this property in the last 3 years? What carrier currently insures it and at what premium?
- What's the average days-on-market for RENTAL listings here right now (not sales)? A rising rental-DOM trend means longer vacancies and softer asking-rent achievability than the comps imply.
- What's the recent tenant-quality profile in this submarket — average credit score on applications, eviction rate, late-payment / NSF rate, and stable-employment percentage? A property-management company in the area should have these aggregated.
- How much new apartment / multifamily construction is in the pipeline within 1–3 miles? Heavy new supply (>2% of stock underway) typically softens rents 12–24 months out; light construction supports rent growth.
Investment metrics
- 1% rule
- 1.28% ✓
- Cap rate
- 9.50%
- Cash-on-cash
- 11.46%
- DSCR
- 1.51
- GRM
- 6.5
CMA / ARV
No comps found within radius.
Projected returns pro-forma
-3.0% appreciation · 0.0% rent growth · sell at horizon
- IRR
- -2.8%
- Equity multiple
- 0.90×
- Total profit
- $-4,282
- Equity at exit
- $22,216
- IRR
- 3.0%
- Equity multiple
- 1.18×
- Total profit
- $7,631
- Equity at exit
- $12,883
Cash invested: $41,720 (down + closing). Projections, not guarantees.
Landlord ↔ Tenant lean methodology
- Overall (STATE)
- 71 Landlord-Friendly
- State Nevada
- 71 Landlord-Friendly · R+1
- County
- — inherits STATE
- City
- — inherits STATE
ZIP-level market 89169
- Home prices YoY
- -33.4%
- Rents YoY
- -4.4%
- Active inventory
- 178
- Price-to-rent
- 6.5×
Monthly cashflow live
- Estimated rent
- $1,912 high interval (Pro) →
- Mortgage (P&I)
- −$781
- Tax from tax record
- −$28 /mo · $338/yr
- Insurance
- −$62
- HOA
- −$240
- Vacancy / Maint / Mgmt
- −$401
- Net cashflow
- $399
Break-even live
UW: 25.0% down · 7.5% · 30yr · 1.5% tax · 5.0% vac · 8.0% maint · 8.0% mgmt
Financing live
Cash to close
- Down payment
- $37,250
- Closing costs
- $4,470
- Reserves months
- —
- Total cash needed
- —
Loan-product check · same deal, 3 products live
Conventional
25% down · 7.5% · 30yr
- Down + closing
- —
- Monthly P&I
- —
- Monthly cashflow
- —
- DSCR
- —
- Eligible?
- —
Personal DTI + credit; lowest rate.
DSCR
20% down · 8.5% · 30yr
- Down + closing
- —
- Monthly P&I
- —
- Monthly cashflow
- —
- DSCR
- —
- Eligible?
- —
No personal income docs; deal must DSCR.
Hard money
10% down · 12.0% · 12mo
- Down + closing
- —
- Monthly P&I
- —
- Monthly cashflow
- —
- DSCR
- —
- Eligible?
- —
Short-term bridge; refi at stabilization.
Rent comps 36 comps
| Address | Beds | Baths | Sqft | Rent | $/sqft | DOM | Units | Dist |
|---|---|---|---|---|---|---|---|---|
| 595 S Royal Crest Cir #18 Las Vegas, NV | 2.0 | 1.0 | 816 | $1,575 | $1.93 | 43d | 1 | 0.04mi |
| 3550 Paradise Rd Las Vegas, NV | 3.0 | 1.0–2.0 | 947 | $1,425 | $1.50 | 43d | 20 | 0.24mi |
| 3930 Paradise Rd Las Vegas, NV | 3.0 | 1.0–2.0 | 999 | $2,805 | $2.81 | 2d | 87 | 0.36mi |
| 3776 Howard Hughes Pkwy Las Vegas, NV | 3.0 | 1.0–2.5 | 1548 | $3,028 | $1.96 | 2d | 9 | 0.42mi |
| 3930 University Center Dr Las Vegas, NV | 2.0 | 2.0–3.0 | 1200 | $1,725 | $1.44 | 43d | 2 | 0.44mi |
| 818 E Flamingo Rd Las Vegas, NV | 1.0–2.0 | 1.0–2.5 | 1158 | $2,895 | $2.50 | 2d | 34 | 0.51mi |
| 900 E Desert Inn Rd Las Vegas, NV | 1.0–2.0 | 1.0–2.0 | 1077 | $1,800 | $1.67 | 43d | 5 | 0.57mi |
| 1061 E Flamingo Rd Las Vegas, NV | 1.0–2.0 | 1.0–2.0 | 967 | $2,203 | $2.28 | 15d | 35 | 0.79mi |
| 350 E Desert Inn Rd Unit H203 Las Vegas, NV | 2.0 | 1.5 | 849 | $1,725 | $2.03 | 43d | 1 | 0.83mi |
| 260 E Flamingo Rd Las Vegas, NV | 1.0–2.0 | 1.0–2.0 | 881 | $2,295 | $2.60 | 43d | 4 | 0.84mi |
| 260 E Flamingo Rd Las Vegas, NV | 2.0 | 2.0 | 1018 | $2,475 | $2.43 | 2d | 1 | 0.84mi |
| 260 E Flamingo Rd Las Vegas, NV | 2.0 | 2.0 | 1018 | $2,372 | $2.33 | 23d | 2 | 0.84mi |
| 270 E Flamingo Rd Las Vegas, NV | 1.0–2.0 | 1.0–2.0 | 877 | $2,100 | $2.39 | 43d | 7 | 0.86mi |
| 230 E Flamingo Rd #335 Las Vegas, NV | 1.0 | 1.0 | 727 | $1,600 | $2.20 | 43d | 1 | 0.86mi |
| 210 E Flamingo Rd Las Vegas, NV | 1.0–2.0 | 1.0–2.0 | 833 | $2,100 | $2.52 | 43d | 6 | 0.91mi |
| 220 E Flamingo Rd #229 Las Vegas, NV | 1.0 | 1.0 | 692 | $2,195 | $3.17 | 23d | 1 | 0.92mi |
| 220 E Flamingo Rd #229 Las Vegas, NV | 1.0 | 1.0 | 692 | $2,195 | $3.17 | 22d | 1 | 0.92mi |
| 220 E Flamingo Rd Las Vegas, NV | 1.0–2.0 | 1.0–2.0 | 863 | $2,195 | $2.54 | 43d | 7 | 0.94mi |
| 1601 E Katie Ave Las Vegas, NV | 1.0–2.0 | 1.0–2.0 | 809 | $1,852 | $2.29 | 43d | 13 | 1.00mi |
| 2831 Geary Pl #2909 Las Vegas, NV | 2.0 | 1.0 | 1112 | $1,899 | $1.71 | 43d | 1 | 1.00mi |
| 1700 E Viking Rd Las Vegas, NV | 2.0 | 2.0 | 1085 | $1,662 | $1.53 | 43d | 3 | 1.09mi |
| 322 Karen Ave Las Vegas, NV | 1.0–2.0 | 1.5–2.0 | 1109 | $3,500 | $3.15 | 3d | 3 | 1.25mi |
| 322 Karen Ave Las Vegas, NV | 1.0–2.0 | 1.0–2.0 | 1109 | $3,500 | $3.15 | 4d | 3 | 1.25mi |
| 222 Karen Ave #1004 Las Vegas, NV | 1.0 | 1.5 | 814 | $2,300 | $2.83 | 23d | 1 | 1.27mi |
| 222 Karen Ave #3005 Las Vegas, NV | 1.0 | 1.5 | 814 | $2,400 | $2.95 | 23d | 1 | 1.27mi |
| 222 Karen Ave #3203 Las Vegas, NV | 1.0 | 2.0 | 814 | $2,500 | $3.07 | 43d | 1 | 1.27mi |
| 222 Karen Ave #306 Las Vegas, NV | 1.0 | 2.0 | 814 | $2,300 | $2.83 | 43d | 1 | 1.27mi |
| 222 Karen Ave #1105 Las Vegas, NV | 1.0 | 1.5 | 814 | $1,990 | $2.44 | 43d | 1 | 1.27mi |
| 222 Karen Ave #2904 Las Vegas, NV | 1.0 | 1.5 | 814 | $2,200 | $2.70 | 2d | 1 | 1.27mi |
| 205 E Harmon Ave Las Vegas, NV | 1.0–2.0 | 1.5–2.0 | 1182 | $1,950 | $1.65 | 43d | 5 | 1.31mi |
| 2700 Las Vegas Blvd S Las Vegas, NV | 2.0 | 2.0–2.5 | 1283 | $2,792 | $2.18 | 12d | 4 | 1.34mi |
| 2700 Las Vegas Blvd S Las Vegas, NV | 1.0–2.0 | 1.0–2.5 | 1226 | $2,950 | $2.41 | 17d | 4 | 1.34mi |
| 4674 Monterey Cir #1 Las Vegas, NV | 2.0 | 1.0 | 1000 | $1,750 | $1.75 | 43d | 1 | 1.36mi |
| 2000 Fashion Show Dr Unit 1501424P Las Vegas, NV | 1.0 | 1.0 | 592 | $5,942 | $10.04 | 2d | 1 | 1.38mi |
| 511 E Sahara Ave Las Vegas, NV | 1.0–2.0 | 1.0 | 900 | $1,600 | $1.78 | 43d | 3 | 1.41mi |
| 4700 S Maryland Pkwy Las Vegas, NV | 1.0 | 1.0 | 409 | $1,382 | $3.37 | 43d | 48 | 1.50mi |
HOA detail condo
- Monthly dues
- $240 · $2,880/yr
- Likely covers
- gaspool
- Assessments
- None detected in remarks — confirm with the listing agent.
Listing history 40 events
-
2026-06-18days on market $149,000 Active 253 DOM
-
2026-06-17days on market $149,000 Active 252 DOM
-
2026-06-16days on market $149,000 Active 251 DOM
-
2026-06-15days on market $149,000 Active 250 DOM
-
2026-06-13days on market $149,000 Active 248 DOM
-
2026-06-09days on market $149,000 Active 244 DOM
-
2026-06-08days on market $149,000 Active 243 DOM
-
2026-06-08days on market $149,000 Active 242 DOM
-
2026-06-03days on market $149,000 Active 238 DOM
-
2026-06-02days on market $149,000 Active 237 DOM
-
2026-06-01days on market $149,000 Active 236 DOM
-
2026-05-31days on market $149,000 Active 235 DOM
-
2025-12-02price $149,000 329-char remark
Show marketing remark (329 chars)
OWNER FINANCE AVAILABLE !Up to 5 year with 20% down and 8% interest rate ! Totally remodeled 2 Bed 1 Bath in 1st floor Corner Unit. Granite Counter . All appliances included. Man made Wooden floor . Walking closets & Plenty of storage. Laundry in unit. Best location near the community pool, Las Vegas Strip & UNLV.
-
2025-11-20price $159,000 329-char remark
Show marketing remark (329 chars)
OWNER FINANCE AVAILABLE !Up to 5 year with 20% down and 8% interest rate ! Totally remodeled 2 Bed 1 Bath in 1st floor Corner Unit. Granite Counter . All appliances included. Man made Wooden floor . Walking closets & Plenty of storage. Laundry in unit. Best location near the community pool, Las Vegas Strip & UNLV.
-
2025-11-11price $169,000 329-char remark
Show marketing remark (329 chars)
OWNER FINANCE AVAILABLE !Up to 5 year with 20% down and 8% interest rate ! Totally remodeled 2 Bed 1 Bath in 1st floor Corner Unit. Granite Counter . All appliances included. Man made Wooden floor . Walking closets & Plenty of storage. Laundry in unit. Best location near the community pool, Las Vegas Strip & UNLV.
-
2025-10-20price $175,000 329-char remark
Show marketing remark (329 chars)
OWNER FINANCE AVAILABLE !Up to 5 year with 20% down and 8% interest rate ! Totally remodeled 2 Bed 1 Bath in 1st floor Corner Unit. Granite Counter . All appliances included. Man made Wooden floor . Walking closets & Plenty of storage. Laundry in unit. Best location near the community pool, Las Vegas Strip & UNLV.
-
2025-10-08price $180,000 329-char remark
Show marketing remark (329 chars)
OWNER FINANCE AVAILABLE !Up to 5 year with 20% down and 8% interest rate ! Totally remodeled 2 Bed 1 Bath in 1st floor Corner Unit. Granite Counter . All appliances included. Man made Wooden floor . Walking closets & Plenty of storage. Laundry in unit. Best location near the community pool, Las Vegas Strip & UNLV.
-
2025-10-08$1,800,000 Active 329-char remark
Show marketing remark (329 chars)
OWNER FINANCE AVAILABLE !Up to 5 year with 20% down and 8% interest rate ! Totally remodeled 2 Bed 1 Bath in 1st floor Corner Unit. Granite Counter . All appliances included. Man made Wooden floor . Walking closets & Plenty of storage. Laundry in unit. Best location near the community pool, Las Vegas Strip & UNLV.
-
2016-06-21historical 296-char remark
Show marketing remark (296 chars)
Totally remodeled (with permits) 2 Bed 1 Bath in 1st floor Corner Unit. Granite Counter Top & 2011 appliances included. Man made Wooden floor & New Carpet. Walking closets & Plenty of storage. Laundry in unit. Best location near the community pool, Las Vegas Strip & UNLV.
-
2016-06-20soldstatus $55,000 Sold 296-char remark
Show marketing remark (296 chars)
Totally remodeled (with permits) 2 Bed 1 Bath in 1st floor Corner Unit. Granite Counter Top & 2011 appliances included. Man made Wooden floor & New Carpet. Walking closets & Plenty of storage. Laundry in unit. Best location near the community pool, Las Vegas Strip & UNLV.
-
2016-06-20soldstatus $55,000
Show marketing remark (296 chars)
Totally remodeled (with permits) 2 Bed 1 Bath in 1st floor Corner Unit. Granite Counter Top & 2011 appliances included. Man made Wooden floor & New Carpet. Walking closets & Plenty of storage. Laundry in unit. Best location near the community pool, Las Vegas Strip & UNLV.
-
2016-06-04historical Contingent Offer 296-char remark
Show marketing remark (296 chars)
Totally remodeled (with permits) 2 Bed 1 Bath in 1st floor Corner Unit. Granite Counter Top & 2011 appliances included. Man made Wooden floor & New Carpet. Walking closets & Plenty of storage. Laundry in unit. Best location near the community pool, Las Vegas Strip & UNLV.
-
2016-05-22price $55,000 296-char remark
Show marketing remark (296 chars)
Totally remodeled (with permits) 2 Bed 1 Bath in 1st floor Corner Unit. Granite Counter Top & 2011 appliances included. Man made Wooden floor & New Carpet. Walking closets & Plenty of storage. Laundry in unit. Best location near the community pool, Las Vegas Strip & UNLV.
-
2016-04-30$60,000 Exclusive Right 296-char remark
Show marketing remark (296 chars)
Totally remodeled (with permits) 2 Bed 1 Bath in 1st floor Corner Unit. Granite Counter Top & 2011 appliances included. Man made Wooden floor & New Carpet. Walking closets & Plenty of storage. Laundry in unit. Best location near the community pool, Las Vegas Strip & UNLV.
-
2015-01-24historical
-
2014-07-23price $69,500
-
2014-07-08price $74,900
-
2014-06-12$78,900 Exclusive Right
-
2010-09-29soldstatus $24,500
-
2010-09-29historical
-
2010-06-04historical
-
2010-06-04$31,200
-
2010-04-06$33,000
-
2008-01-17soldstatus $92,000
-
2008-01-17historical
-
2007-11-13$103,900
-
2006-06-27soldstatus $110,000
-
1997-09-25soldstatus $58,000
-
1990-07-30soldstatus $49,000
-
1983-07-07soldstatus $49,000
ⓘ Source: listings_history table (triggers on properties + properties_extension) + one-shot
backfill from property_details.listing_events for pre-trigger history.
Tax reassessment forecast NV · Resets to sale price
- Current annual tax
- $338 · $28/mo
- Projected year-2 tax
- $879 · $73/mo
- Expected delta
- +$541/yr (+$45/mo · 159.7%)
ⓘ Screening estimate from a state-policy table — verify with the county assessor before closing.
Climate risk First Street
- Flood 1/10 Low FEMA zone X (unshaded) · 0% chance over 30 yrs
- Wildfire 1/10 Low
- Heat 8/10 Severe 7 d/yr ≥106°F today · 17 d/yr by 30 yrs out
- Wind 1/10 Low
- Air quality 3/10 Moderate 3 unhealthy d/yr today · 4 by 30 yrs out
Nearby sold comps map
Loading sold comps map…
Walkable amenities ~0.75 mi
Loading nearby amenities…
Taxation est. · year 1
- Rental income
- $22,940
- − Mortgage interest
- −$8,346
- − Property taxes
- −$338
- − Insurance
- −$745
- − Repairs & maintenance
- −$1,835
- − Management
- −$1,835
- − HOA
- −$2,880
- − Depreciation
- −$4,335
- Taxable income
- $2,626
- Est. tax owed @ 24.0%
- −$630
- After-tax cash flow
- $4,153/yr
For passive investors: Depreciation is non-cash, so a rental often shows a tax loss while cash-flowing — sheltering income. Rental losses are passive: they offset passive income freely, and up to $25,000/yr can offset ordinary (W-2) income if you actively participate and your MAGI is under $100k (phasing out to $0 by $150k); unused losses carry forward. On sale, claimed depreciation is recaptured at up to 25%, and gains may owe capital-gains tax (a 1031 exchange can defer both). Figures are a year-1 estimate at your 24.0% rate — not tax advice; consult a CPA.
Schools (NCES district)
- District
- Clark County School District
- NCES district ID
- 3200060
- Math proficiency
- 21% ▼ -13.00%
- Reading proficiency
- 39% ▼ -8.00%
- Median HH income
- $53,611
- Composite
- 26.48/100
- National rank
- #7211
- State rank
- #11 of 17 in NV
Livability — Paradise
- Score
- 76/100
- State rank
- #10
- US rank
- #3494
Category grades
Schools grade is shown separately in the Schools card above.
Census & demographics
- Census place
- Paradise, NV
- County
- Clark County · 2,306,105 people
- City population
- 227,885
- Metro
- Las Vegas-Henderson-Paradise, NV
- Population (ZIP)
- 22,171
- Household income
- $40,904
- Rent vs Own
- Severe rent burden
- 2744.0
Population outlook (Clark County) Hauer SSP2
- Today (2025)
- 2,504,101 people
- By 2030
- 2,693,770 · +7.6%
- By 2040
- 3,061,208 · +22.2%
- By 2050
- 3,400,072 · +35.8%
- By 2075
- 4,139,522 · +65.3%
- By 2100
- 4,596,916 · +83.6%
Race, ethnicity, and origin ACS 2023
- Neighborhood character
- Highly diverse neighborhood (Simpson 0.74)
- Race & ethnicity
- Hispanic / Latino 33% White 30% Black 23% Two or more races 13% Asian 9% Native American 2%
- Hispanic origin (detail)
- Mexican 21% Cuban 5%
- Common ancestry
- Iranian 1% Italian 1% Slovak 1%
- Foreign-born
- 30% · Canada, China
- Languages at home
- 59% English-only · Spanish 27% Tagalog/Filipino 4% Other Asian/Pacific 3%
Political lean MEDSL · Clark
- 2024 margin
- Toss-up / Even · D 50.4% · R 47.8% · Other 1.7%
- 2008→2024 swing
- -16.5pp toward R · 2008: 19.1pp · 2024: 2.6pp
- All cycles
- 2024: D+2.6 2020: D+9.3 2016: D+10.7 2012: D+14.5 2008: D+19.1
Not yet ingested
- Civics
- —
Market trends
- HPI YoY
- ▼ -136.91%
- Current HPI
- 272.6449
- Rent YoY
- ▼ -4.43%
- Metro
- Las Vegas-Henderson-Paradise, NV
- State GDP YoY
- ▲ 3.08%
- F500 in state
- 6
Industry mix (Fortune 500 HQ in NV)
| Industry | F500 HQs | Revenue |
|---|---|---|
| Hotels / Casinos | 3 | $36B |
|
||
Price history
+204.1% since first listed28 events — show timeline
- 2025-12-02 Price Changed $149,000 GLVAR
- 2025-11-20 Price Changed $159,000 GLVAR
- 2025-11-11 Price Changed $169,000 GLVAR
- 2025-10-20 Price Changed $175,000 GLVAR
- 2025-10-08 Price Changed $180,000 GLVAR
- 2025-10-08 Listed $1,800,000 GLVAR
- 2016-06-21 Listing Removed — GLVAR
- 2016-06-20 Sold (Public Records) $55,000 Public Records
- 2016-06-20 Sold (MLS) $55,000 GLVAR
- 2016-06-04 Contingent — GLVAR
- 2016-05-22 Price Changed $55,000 GLVAR
- 2016-04-30 Listed $60,000 GLVAR
- 2015-01-24 Listing Removed — GLVAR
- 2014-07-23 Price Changed $69,500 GLVAR
- 2014-07-08 Price Changed $74,900 GLVAR
- 2014-06-12 Listed $78,900 GLVAR
- 2010-09-29 Listing Removed — GLVAR
- 2010-09-29 Sold (MLS) $24,500 GLVAR
- 2010-06-04 Listed $31,200 GLVAR
- 2010-06-04 Listing Removed — GLVAR
- 2010-04-06 Listed $33,000 GLVAR
- 2008-01-17 Listing Removed — GLVAR
- 2008-01-17 Sold (MLS) $92,000 GLVAR
- 2007-11-13 Listed $103,900 GLVAR
- 2006-06-27 Sold (Public Records) $110,000 Public Records
- 1997-09-25 Sold (Public Records) $58,000 Public Records
- 1990-07-30 Sold (Public Records) $49,000 Public Records
- 1983-07-07 Sold (Public Records) $49,000 Public Records
Property tax history
-0.3%/yrLatest (2025): $338 · +7.1% YoY. Source: county tax records.
Cash-flow waterfall
monthlySold comps — $/sqft
last 12 mo · ≤1 miLoading sold comps…