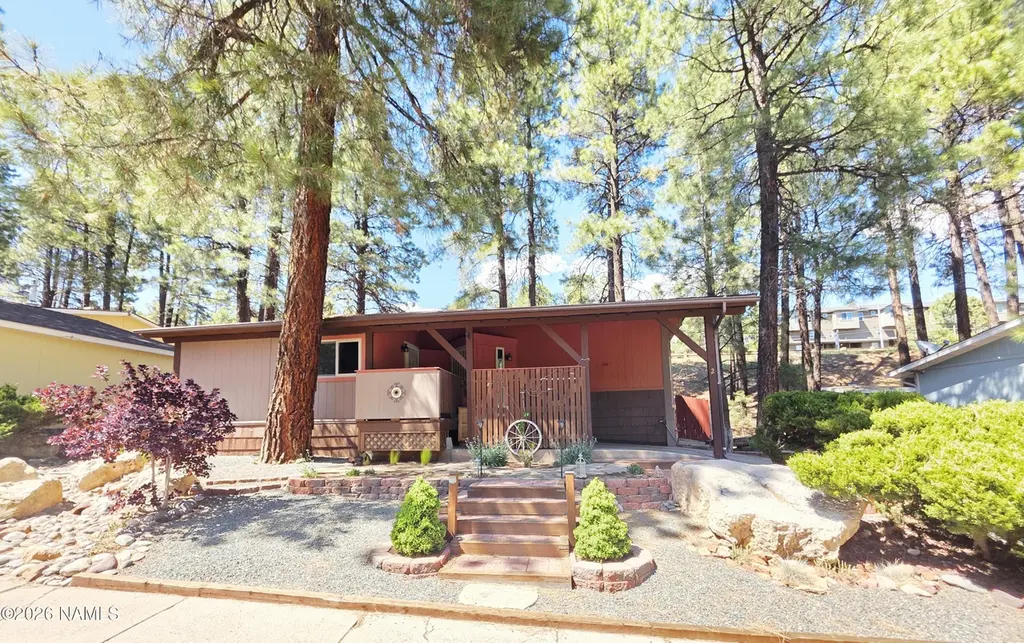
2401 W Route 66 #2 · Flagstaff, AZ
Flood risk 8/10 · Major
- FEMA flood zone
- X (unshaded)
- Chance of flooding over 30 yrs
- 0.99%
- Est. flood insurance / yr
- $507 – $1,088
Fire risk 8/10 · Major
- Est. fire insurance / yr
- $610 – $1,132
Heat risk 2/10 · Minimal
- Hot days now (above 86°F)
- 7 days/yr
- Hot days in 30 yrs
- 18 days/yr
Wind risk 1/10 · Minimal
- Chance of severe wind over 30 yrs
- —
Air-quality risk 1/10 · Minimal
- Unhealthy air days now
- 0 days/yr
- Unhealthy air days in 30 yrs
- 0 days/yr
Risk factors via First Street. Map © Google.
Why this score? — see what drove the B- grade
The composite is a weighted blend of 9 inputs, each scored 0–100. Each bar is that input's sub-score; the figure is the points it added to the 100-point composite (weight × sub-score).
- Cash flow +30.0/30.0
- 1% rule +10.0/10.0
- DSCR +10.0/10.0
- ARV discount +5.3/15.0
- Livability +3.1/5.0
- Rent growth +2.6/5.0
- Condition / age +2.2/5.0
- Schools +2.1/10.0
- Appreciation +0.0/10.0
$79,000
🖨 Deal sheet 📄 Offer letter ✓ Due diligence
Listing remarks
SELLER WILL PAY 6 MONTHS LOT LEASE!!! Nestled in the peaceful Wildwood Hills community of Flagstaff, this charming 1-bedroom, 1-bath home offers an additional 15x12 studio that can be used as an office, living room or 2nd bedroom with own entrance & heat. Enjoy the comfort of newer double-pane windows and updated plumbing pipes. The property is beautifully landscaped and south-facing, the fenced backyard is landscaped and offers a great space to relax, garden, or entertain. Additional features include a carport, extra driveway parking, washer and dryer, and storage shed. The clubhouse with a pool, spa & pool table is just a short walk away. Land is leased for 1495/month which i
Key facts
- Landscaped backyard
- Carport
- 15x12 studio
Tags
Property features AI
Finance
- HOA & community: Has association with clubhouse; Community pool/spa available
Exterior
- Parking: Carport
- Utilities: Electricity available; Natural gas available
- Home design: Single wide home; One level
- Construction: Stem wall foundation
- Exterior features: Patio; Partial fencing; Shed(s); Landscaped lot; Sloped topography; Paved road; private maintained road
Interior
- Kitchen: Gas range
- Flooring: Carpet; Ceramic tile; Vinyl
- Bathrooms: 1 bathroom
- Heating & cooling: Natural gas forced air heating; Ceiling fan(s) for cooling
- Interior features: Eat-in kitchen; Double-pane windows; Smoke detector(s)
- Laundry & utility: Hall laundry
Neighborhood map
What this means for you Summary
Snapshot
- This is a 1-bed/1.0-bath manufactured listed at $79k. Condition is rated fair.
Deal economics
- At list price, monthly cash flow is $816 ($10k/yr) — positive.
- The deal already cash-flows at list — no discount required.
- Meets the 1% rule at list price ($2k rent vs $79k).
- Recommended offer: $77k (3.0% below list) — sets the bar for market timing.
- Cap rate 19.7% vs local median 2.1% in Flagstaff — top-decile yield for the area; either an underpriced asset or a hidden risk that comps aren't pricing in. Stress-test before assuming the spread holds.
Location & tenants
- Location reads 61/100 on livability (#167 in AZ) — a middle-class / working-renter tenant base. Strengths: housing B; Watch: schools C-, employment C-, crime D-.
- Flagstaff Unified District (4192) (urban): math 18% / reading 29% proficiency, ranked #158 of 249 in AZ (top 64%) — low school quality limits family demand, transient renter base, plan for 1-2y turnover.
- Market conditions: Rents flat; 280 active listings in the ZIP; 14 comparable units currently listed for rent nearby; rentals lingering (median 44d on market — plan ~5-8 weeks vacancy on turnover, expect pricing pressure); 100% of comp listings sitting > 30 days — soft ceiling on asking rent; 698 units permitted in Coconino County in 2024 (354 in 5+ unit buildings).
- This rent runs 34% of the median local income ($65k/yr) — at the standard rent-burdened threshold; future hikes will face affordability resistance.
Forward outlook
- Local home prices are declining (-3.0%/yr); year-one equity from $546 of loan paydown is wiped out by about $2k of value loss. Plan a longer hold.
- Coconino County population projected at +20% by 2050 — long-run rental-demand tailwind backs the buy-and-hold thesis.
- At projected returns (-3.0% appreciation + 0.6% rent growth), your $22k cash investment doubles in ~3 years — after that, you're playing with house money.
Negotiation context
- It's been on market 39 days — a 3% lower offer ($77k) is reasonable based on typical stale-listing flexibility.
Risks & watch-outs
- Watch-outs: flood insurance adds $66/mo.
- Climate carrying-cost: severe flood risk; severe wildfire risk — expect insurance premiums to compound above CPI over the hold.
Questions for the listing agent
- It's been on market 39 days. Have you received any prior offers? Is the seller open to a 3% concession, seller financing, or rate buy-down credit?
- Have any recent inspections been done? Can we get a copy of the seller's disclosures and any deferred-maintenance estimates?
- What's the actual annual flood-insurance premium (NFIP or private), and is the property in a SFHA with mandatory coverage?
- Is there a deadline driving the sale (1031 exchange, divorce, estate, relocation)? That informs how much negotiation room exists.
- Crime grade is D in this area — have there been break-ins, vandalism, or insurance claims at this property in the last 3 years? What carrier currently insures it and at what premium?
- What's the average days-on-market for RENTAL listings here right now (not sales)? A rising rental-DOM trend means longer vacancies and softer asking-rent achievability than the comps imply.
- What's the recent tenant-quality profile in this submarket — average credit score on applications, eviction rate, late-payment / NSF rate, and stable-employment percentage? A property-management company in the area should have these aggregated.
- How much new for-sale + rental construction is in the pipeline within 1–3 miles? Heavy new supply typically softens prices + rents 12–24 months out; constrained supply supports both.
Investment metrics
- 1% rule
- 2.29% ✓
- Cap rate
- 19.70%
- Cash-on-cash
- 47.87%
- DSCR
- 3.13
- GRM
- 3.6
CMA / ARV
- ARV (median comp)
- $75,396
- List price
- $79,000
- Delta
- 4.78%
- Verdict
- FAIR
- Comps
- 4 within 1.0 mi
Show comp detail 6 sales within ~0.75 mi
| Address | Dist | Beds/Ba | Sqft | Sold | Price | $/sf | Match |
|---|---|---|---|---|---|---|---|
| 2500 W Route 66 #21 | 0.22mi | 2/1.0 (+1) | 791 (-1%) | 1mo | $69,900 | $88 | 83 |
| 2401 W Route 66 #104 | 0.06mi | 2/1.0 (+1) | 741 (-7%) | 16mo | $99,500 | $134 | 67 |
| 2500 W Rte 66 #67 | 0.19mi | 2/1.0 (+1) | 728 (-8%) | 15mo | $92,000 | $126 | 60 |
| 2500 W Route 66 #1 | 0.16mi | 2/2.0 (+1) | 896 (+13%) | 9mo | $70,000 | $78 | 55 |
| 2500 W Route 66 #65 | 0.16mi | 2/2.0 (+1) | 896 (+13%) | 10mo | $100,000 | $112 | 54 |
| 2401 W Route 66 Dr #66 | 0.23mi | 2/2.0 (+1) | 868 (+9%) | 22mo | $161,500 | $186 | 47 |
Match score weights: distance 35% · size 25% · config 20% · recency 20%. Top-matched comps best support the ARV.
Projected returns pro-forma
-3.0% appreciation · 0.55% rent growth · sell at horizon
- IRR
- 38.3%
- Equity multiple
- 2.58×
- Total profit
- $34,878
- Equity at exit
- $11,779
- IRR
- 43.5%
- Equity multiple
- 4.64×
- Total profit
- $80,561
- Equity at exit
- $6,830
Cash invested: $22,120 (down + closing). Projections, not guarantees.
Landlord ↔ Tenant lean methodology
- Overall (STATE)
- 87 Strongly Landlord-Friendly
- State Arizona
- 87 Strongly Landlord-Friendly · R+3
- County
- — inherits STATE
- City
- — inherits STATE
ZIP-level market 86001
- Rents YoY
- 0.6%
- Active inventory
- 280
- Price-to-rent
- 3.6×
Monthly cashflow live
- Estimated rent
- $1,808 high interval (Pro) →
- Mortgage (P&I)
- −$414
- Tax est. 1.5%
- −$99 /mo · $1,185/yr
- Insurance
- −$33
- Flood insurance flood zone
- −$66 /mo · $798/yr
- HOA
- −$0
- Vacancy / Maint / Mgmt
- −$380
- Net cashflow
- $816
Break-even live
UW: 25.0% down · 7.5% · 30yr · 1.5% tax · 5.0% vac · 8.0% maint · 8.0% mgmt
Financing live
Cash to close
- Down payment
- $19,750
- Closing costs
- $2,370
- Reserves months
- —
- Total cash needed
- —
Loan-product check · same deal, 3 products live
Conventional
25% down · 7.5% · 30yr
- Down + closing
- —
- Monthly P&I
- —
- Monthly cashflow
- —
- DSCR
- —
- Eligible?
- —
Personal DTI + credit; lowest rate.
DSCR
20% down · 8.5% · 30yr
- Down + closing
- —
- Monthly P&I
- —
- Monthly cashflow
- —
- DSCR
- —
- Eligible?
- —
No personal income docs; deal must DSCR.
Hard money
10% down · 12.0% · 12mo
- Down + closing
- —
- Monthly P&I
- —
- Monthly cashflow
- —
- DSCR
- —
- Eligible?
- —
Short-term bridge; refi at stabilization.
Rent comps 14 comps
| Address | Beds | Baths | Sqft | Rent | $/sqft | DOM | Units | Dist |
|---|---|---|---|---|---|---|---|---|
| 2701 S Woody Mountain Rd Flagstaff, AZ | 1.0–3.0 | 1.0–2.0 | 1078 | $2,175 | $2.02 | 43d | 77 | 0.41mi |
| 2292 S Alvan Clark Blvd Flagstaff, AZ | 2.0–3.0 | 1.0–2.0 | 978 | $1,473 | $1.51 | 43d | 12 | 0.58mi |
| 1385 W University Ave Flagstaff, AZ | 2.0 | 2.0 | 906 | $1,725 | $1.90 | 43d | 3 | 0.82mi |
| 1000 W Forest Meadows St Flagstaff, AZ | 2.0 | 2.0 | 947 | $1,925 | $2.03 | 43d | 1 | 0.94mi |
| 927 W Forest Meadows St Flagstaff, AZ | 1.0–2.0 | 1.0–2.0 | 958 | $1,995 | $2.08 | 43d | 11 | 0.99mi |
| 923 W University Ave Flagstaff, AZ | 1.0–2.0 | 1.0–2.0 | 877 | $1,799 | $2.05 | 43d | 36 | 1.10mi |
| 1580 S Plaza Way Flagstaff, AZ | 1.0–2.0 | 1.0–2.0 | 875 | $1,899 | $2.17 | 43d | 12 | 1.12mi |
| 800 W Forest Meadows St Flagstaff, AZ | 1.0–3.0 | 1.0–2.0 | 847 | $1,561 | $1.84 | 43d | 32 | 1.14mi |
| 813 W University Ave Flagstaff, AZ | 2.0 | 1.0–2.0 | 567 | $1,642 | $2.90 | 43d | 1 | 1.18mi |
| 1515 S Yale St Flagstaff, AZ | 2.0 | 1.0–2.0 | 860 | $1,740 | $2.02 | 43d | 6 | 1.19mi |
| 700 W University Ave Flagstaff, AZ | 2.0 | 1.0–2.0 | 675 | $1,590 | $2.36 | 43d | 1 | 1.20mi |
| 600 W University Heights Dr N Flagstaff, AZ | 1.0–2.0 | 1.0–2.0 | 766 | $1,900 | $2.48 | 43d | 4 | 1.42mi |
| 3200 S Litzler Dr Unit 9-236 Flagstaff, AZ | 2.0 | 2.0 | 776 | $1,800 | $2.32 | 43d | 1 | 1.44mi |
| 1200 S Riordan Ranch St Flagstaff, AZ | 1.0 | 1.0 | 528 | $1,525 | $2.89 | 43d | 1 | 1.46mi |
Listing history 19 events
-
2026-06-19days on market $79,000 Active 39 DOM
-
2026-06-18days on market $79,000 Active 38 DOM
-
2026-06-17days on market $79,000 Active 37 DOM
-
2026-06-16days on market $79,000 Active 36 DOM
-
2026-06-15days on market $79,000 Active 35 DOM
-
2026-06-14days on market $79,000 Active 33 DOM
-
2026-06-13days on market $79,000 Active 32 DOM
-
2026-06-10days on market $79,000 Active 30 DOM
-
2026-06-09days on market $79,000 Active 29 DOM
-
2026-06-08days on market $79,000 Active 28 DOM
-
2026-06-07days on market $79,000 Active 27 DOM
-
2026-06-05days on market $79,000 Active 24 DOM
-
2026-06-03days on market $79,000 Active 23 DOM
-
2026-06-03remarks 691-char remark
-
2026-06-02days on market $79,000 Active 22 DOM
-
2026-06-01days on market $79,000 Active 21 DOM
-
2026-05-31days on market $79,000 Active 20 DOM
-
2026-05-30days on market $79,000 Active 19 DOM
-
2026-05-11$79,000 Active 792-char remark
ⓘ Source: listings_history table (triggers on properties + properties_extension) + one-shot
backfill from property_details.listing_events for pre-trigger history.
Climate risk First Street
- Flood 8/10 Severe FEMA zone X (unshaded) · 99% chance over 30 yrs
- Wildfire 8/10 Severe
- Heat 2/10 Low 7 d/yr ≥86°F today · 18 d/yr by 30 yrs out
- Wind 1/10 Low
- Air quality 1/10 Low 0 unhealthy d/yr today · 0 by 30 yrs out
Nearby sold comps map
Loading sold comps map…
Walkable amenities ~0.75 mi
Loading nearby amenities…
Taxation est. · year 1
- Rental income
- $21,695
- − Mortgage interest
- −$4,425
- − Property taxes
- −$1,185
- − Insurance
- −$1,192
- − Repairs & maintenance
- −$1,736
- − Management
- −$1,736
- − Depreciation
- −$2,298
- Taxable income
- $9,123
- Est. tax owed @ 24.0%
- −$2,190
- After-tax cash flow
- $7,601/yr
For passive investors: Depreciation is non-cash, so a rental often shows a tax loss while cash-flowing — sheltering income. Rental losses are passive: they offset passive income freely, and up to $25,000/yr can offset ordinary (W-2) income if you actively participate and your MAGI is under $100k (phasing out to $0 by $150k); unused losses carry forward. On sale, claimed depreciation is recaptured at up to 25%, and gains may owe capital-gains tax (a 1031 exchange can defer both). Figures are a year-1 estimate at your 24.0% rate — not tax advice; consult a CPA.
Condition & rehab AI · 22 photos
This home requires moderate renovations to improve its condition and increase its value. The kitchen and bathroom need significant updates, and the interior walls and paint could use freshening up. The exterior and landscaping are in average condition and could be improved to enhance the overall appeal.
Repairs flagged
- Moderate kitchen cabinets — dated and in need of replacement
- Moderate kitchen countertops — dated and in need of replacement
- Moderate bathroom fixtures — dated and in need of replacement
- Moderate bathroom flooring — dated and in need of replacement
- Moderate kitchen flooring — dated and in need of replacement
- Moderate interior walls/paint — dated and in need of fresh paint
Value-add opportunities
- Both paint interior walls — fresh paint can improve the overall appearance and value of the home
- Both replace kitchen cabinets and countertops — new cabinets and countertops can significantly improve the functionality and value of the kitchen
- Both replace bathroom fixtures and flooring — new fixtures and flooring can improve the functionality and value of the bathroom
- Both replace kitchen flooring — new flooring can improve the functionality and value of the kitchen
- Both landscaping and curb appeal — improved landscaping can enhance the curb appeal and overall value of the home
Renovation cost estimate screening
| Repair item | Severity | Est. cost |
|---|---|---|
| kitchen cabinets · dated and in need of replacement | Moderate | $3,000–15,000 |
| kitchen countertops · dated and in need of replacement | Moderate | $3,000–15,000 |
| bathroom fixtures · dated and in need of replacement | Moderate | $3,000–15,000 |
| bathroom flooring · dated and in need of replacement | Moderate | $3,000–15,000 |
| kitchen flooring · dated and in need of replacement | Moderate | $3,000–15,000 |
| interior walls/paint · dated and in need of fresh paint | Moderate | $3,000–15,000 |
| Total estimated repair cost · 6 items | $18,000–90,000 |
Value-add ROI direction
- Both paint interior walls — fresh paint can improve the overall appearance and value of the home ↑
- Both replace kitchen cabinets and countertops — new cabinets and countertops can significantly improve the functionality and value of the kitchen ↑
- Both replace bathroom fixtures and flooring — new fixtures and flooring can improve the functionality and value of the bathroom ↑
- Both replace kitchen flooring — new flooring can improve the functionality and value of the kitchen ↑
- Both landscaping and curb appeal — improved landscaping can enhance the curb appeal and overall value of the home ↑
ⓘ Cost ranges are severity-bucket heuristics (US national rule-of-thumb). Get contractor quotes + a written scope before underwriting a rehab budget.
Schools (NCES district)
- District
- Flagstaff Unified District (4192)
- NCES district ID
- 0402860
- Math proficiency
- 18% ▼ -16.00%
- Reading proficiency
- 29% ▼ -10.00%
- Median HH income
- $53,510
- Composite
- 21.11/100
- National rank
- #8437
- State rank
- #158 of 249 in AZ
Livability — Flagstaff
- Score
- 61/100
- State rank
- #167
- US rank
- #18308
Category grades
Schools grade is shown separately in the Schools card above.
Census & demographics
- Census place
- Flagstaff, AZ
- County
- Coconino County · 91,667 people
- City population
- 91,667
- Metro
- Flagstaff, AZ
- Population (ZIP)
- 37,312
- Household income
- $64,626
- Rent vs Own
- Severe rent burden
- 3117.0
Population outlook (Coconino County) Hauer SSP2
- Today (2025)
- 150,645 people
- By 2030
- 156,857 · +4.1%
- By 2040
- 168,714 · +12.0%
- By 2050
- 181,082 · +20.2%
- By 2075
- 218,399 · +45.0%
- By 2100
- 238,853 · +58.6%
Race, ethnicity, and origin ACS 2023
- Neighborhood character
- Diverse neighborhood (Simpson 0.59)
- Race & ethnicity
- White 62% Hispanic / Latino 15% Native American 12% Two or more races 9% Asian 3% Black 2%
- Hispanic origin (detail)
- Mexican 10%
- Common ancestry
- Italian 2% Slovak 2% Romanian 2%
- Foreign-born
- 6% · Canada, China, Jamaica
- Languages at home
- 84% English-only · Spanish 8% Other Indo-European 1% Chinese 1%
Political lean MEDSL · Coconino
- 2024 margin
- D (+19.9) · D 59.2% · R 39.4% · Other 1.4%
- 2008→2024 swing
- +2.9pp toward D · 2008: 17.0pp · 2024: 19.9pp
- All cycles
- 2024: D+19.9 2020: D+24.1 2016: D+19.4 2012: D+14.9 2008: D+17.0
Not yet ingested
- Civics
- —
Market trends
- HPI YoY
- ▼ -488.37%
- Current HPI
- 393.2551
- Rent YoY
- ▲ 0.55%
- Metro
- Flagstaff, AZ
- State GDP YoY
- ▲ 4.54%
- F500 in state
- 20
Industry mix (Fortune 500 HQ in AZ)
| Industry | F500 HQs | Revenue |
|---|---|---|
| Technology | 2 | $13B |
|
||
| Mining / Metals | 1 | $23B |
|
||
| Environmental Services | 1 | $16B |
|
||
| Metals / Steel | 1 | $14B |
|
||
| Technology Distribution | 1 | $9B |
|
||
| Homebuilding | 1 | $8B |
|
||
Price history
1 event — show timeline
- 2026-05-11 Listed $79,000 NAZMLS
Cash-flow waterfall
monthlySold comps — $/sqft
last 12 mo · ≤1 miLoading sold comps…