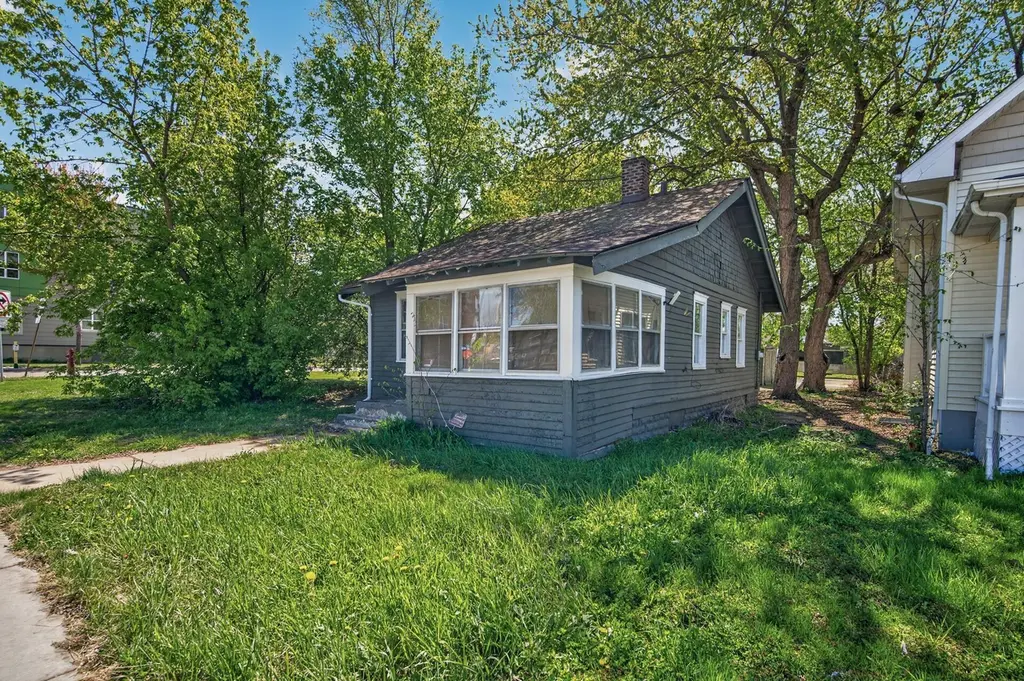
2305 Golden Valley Rd · Minneapolis, MN
Flood risk 3/10 · Minor
- FEMA flood zone
- X (unshaded)
- Chance of flooding over 30 yrs
- 0.2%
- Est. flood insurance / yr
- $473 – $860
Fire risk 1/10 · Minimal
- Est. fire insurance / yr
- $888 – $1,650
Heat risk 2/10 · Minimal
- Hot days now (above 99°F)
- 7 days/yr
- Hot days in 30 yrs
- 14 days/yr
Wind risk 2/10 · Minimal
- Chance of severe wind over 30 yrs
- —
Air-quality risk 2/10 · Minimal
- Unhealthy air days now
- 1 days/yr
- Unhealthy air days in 30 yrs
- 1 days/yr
Risk factors via First Street. Map © Google.
Why this score? — see what drove the B grade
The composite is a weighted blend of 9 inputs, each scored 0–100. Each bar is that input's sub-score; the figure is the points it added to the 100-point composite (weight × sub-score).
- Cash flow +30.0/30.0
- DSCR +10.0/10.0
- 1% rule +9.7/10.0
- ARV discount +7.5/15.0
- Rent growth +4.3/5.0
- Livability +3.9/5.0
- Schools +3.5/10.0
- Condition / age +2.5/5.0
- Appreciation +0.0/10.0
$99,000
🖨 Deal sheet 📄 Offer letter ✓ Due diligence
Listing remarks MLS
Cute and cozy 2 bedroom bungalow close to everything. Maple kitchen cabinets and high efficiency furnace. Hardwood floors throughout most of the main level and craftsman built ins. Best deal around and won't last long! Call an agent today for a private tour!
Key facts
- 4,791 sq ft lot
- Garage
- Built 1918
Property features AI
Finance
- Other: Living area listed as 698 (main level finished); total building area 1,396
Exterior
- Parking: 1-car garage (approx. 260 sq ft)
- Utilities: City water; City sewer; Natural gas
- Home design: Residential property; One level; Sun room included
- Construction: Block foundation; Foundation area approx. 698
- Exterior features: Other exterior features; No fencing; Lot dimensions approx. 38 x 126
Interior
- Kitchen: Kitchen on main level (approx. 8x8)
- Bedrooms: 2 bedrooms on the main level (approx. 10x10 each); Main floor bedroom
- Bathrooms: 1 full bathroom on the main level
- Heating & cooling: Forced air heating; No central cooling
- Interior features: Sun room; Full, unfinished basement
Neighborhood map
What this means for you Summary
Snapshot
- This is a 2-bed/1.0-bath single-family listed at $99k.
Deal economics
- At list price, monthly cash flow is $462 ($6k/yr) — positive.
- The deal already cash-flows at list — no discount required.
- Meets the 1% rule at list price ($1k rent vs $99k).
- Cap rate 11.9% vs local median 3.1% in Minneapolis — top-decile yield for the area; either an underpriced asset or a hidden risk that comps aren't pricing in. Stress-test before assuming the spread holds.
Location & tenants
- Location reads 78/100 on livability (#110 in MN, #2,525 nationally) — a middle-class / working-renter tenant base. Strengths: amenities A+, commute A+, housing A+; Watch: cost of living C-, crime F.
- Minneapolis Public School District (urban): math 35% / reading 46% proficiency, ranked #217 of 301 in MN (top 72%) — families likely to look elsewhere, expect single-tenant / working-renter base with shorter leases.
- Market conditions: Rents rising fast (+7.3%/yr); 132 active listings in the ZIP; 17 comparable units currently listed for rent nearby; rentals leasing fast (median 8d on market — plan ~1-2 weeks tenant-placement turnaround); 4,651 units permitted in Hennepin County in 2024 (2,443 in 5+ unit buildings).
Forward outlook
- Local home prices are declining (-3.0%/yr); year-one equity from $684 of loan paydown is wiped out by about $3k of value loss. Plan a longer hold.
- Hennepin County population projected at +30% by 2050 — long-run rental-demand tailwind backs the buy-and-hold thesis.
- At projected returns (-3.0% appreciation + 7.3% rent growth), your $28k cash investment doubles in ~5 years — after that, you're playing with house money.
Negotiation context
- Only 6 days on market — expect competitive offers; lowballing is unlikely to land.
- 5 sale attempts since 12y ago with the ask held roughly flat each time — persistent listings suggest the price (not the market) is what's stuck; bring a comps-based counter.
Risks & watch-outs
- Watch-outs: built in 1918 — expect roof / HVAC / electrical / plumbing capex.
Questions for the listing agent
- Built in 1918 — when were the roof, HVAC, electrical panel, plumbing, and water heater last replaced?
- Is there a deadline driving the sale (1031 exchange, divorce, estate, relocation)? That informs how much negotiation room exists.
- Crime grade is F in this area — have there been break-ins, vandalism, or insurance claims at this property in the last 3 years? What carrier currently insures it and at what premium?
- What's the average days-on-market for RENTAL listings here right now (not sales)? A rising rental-DOM trend means longer vacancies and softer asking-rent achievability than the comps imply.
- What's the recent tenant-quality profile in this submarket — average credit score on applications, eviction rate, late-payment / NSF rate, and stable-employment percentage? A property-management company in the area should have these aggregated.
- How much new for-sale + rental construction is in the pipeline within 1–3 miles? Heavy new supply typically softens prices + rents 12–24 months out; constrained supply supports both.
Investment metrics
- 1% rule
- 1.47% ✓
- Cap rate
- 11.89%
- Cash-on-cash
- 20.00%
- DSCR
- 1.89
- GRM
- 5.7
CMA / ARV
No comps found within radius.
Projected returns pro-forma
-3.0% appreciation · 7.35% rent growth · sell at horizon
- IRR
- 17.0%
- Equity multiple
- 1.72×
- Total profit
- $20,073
- Equity at exit
- $14,761
- IRR
- 28.5%
- Equity multiple
- 4.08×
- Total profit
- $85,383
- Equity at exit
- $8,560
Cash invested: $27,720 (down + closing). Projections, not guarantees.
Landlord ↔ Tenant lean methodology
- Overall (CITY)
- 34 Tenant-Leaning
- State Minnesota
- 46 Balanced · D+2
- County
- — inherits STATE
- City Minneapolis
- 34 Tenant-Leaning · D+50
ZIP-level market 55411
- Home prices YoY
- -8.7%
- Rents YoY
- 7.3%
- Active inventory
- 132
- Price-to-rent
- 5.7×
Monthly cashflow live
- Estimated rent
- $1,458 high interval (Pro) →
- Mortgage (P&I)
- −$519
- Tax from tax record
- −$130 /mo · $1,554/yr
- Insurance
- −$41
- HOA
- −$0
- Vacancy / Maint / Mgmt
- −$306
- Net cashflow
- $462
Break-even live
UW: 25.0% down · 7.5% · 30yr · 1.5% tax · 5.0% vac · 8.0% maint · 8.0% mgmt
Financing live
Cash to close
- Down payment
- $24,750
- Closing costs
- $2,970
- Reserves months
- —
- Total cash needed
- —
Loan-product check · same deal, 3 products live
Conventional
25% down · 7.5% · 30yr
- Down + closing
- —
- Monthly P&I
- —
- Monthly cashflow
- —
- DSCR
- —
- Eligible?
- —
Personal DTI + credit; lowest rate.
DSCR
20% down · 8.5% · 30yr
- Down + closing
- —
- Monthly P&I
- —
- Monthly cashflow
- —
- DSCR
- —
- Eligible?
- —
No personal income docs; deal must DSCR.
Hard money
10% down · 12.0% · 12mo
- Down + closing
- —
- Monthly P&I
- —
- Monthly cashflow
- —
- DSCR
- —
- Eligible?
- —
Short-term bridge; refi at stabilization.
Rent comps 17 comps
| Address | Beds | Baths | Sqft | Rent | $/sqft | DOM | Units | Dist |
|---|---|---|---|---|---|---|---|---|
| 2323 26th Ave N Minneapolis, MN | 2.0 | 1.0 | 807 | $1,717 | $2.13 | 14d | 3 | 0.45mi |
| 2419 Plymouth Ave N Minneapolis, MN | 2.0–3.0 | 1.0 | 836 | $1,495 | $1.79 | 4d | 2 | 0.54mi |
| 1255 Queen Ave N Minneapolis, MN | 1.0–2.0 | 1.0 | 633 | $1,419 | $2.24 | 3d | 4 | 0.54mi |
| 1239 Sheridan Ave N Minneapolis, MN | 1.0–2.0 | 1.0 | 795 | $1,250 | $1.57 | 4d | 4 | 0.55mi |
| 1407 N 15th Ave Unit 2 Minneapolis, MN | 2.0 | 1.0 | 687 | $1,300 | $1.89 | 43d | 1 | 0.66mi |
| 835 W Broadway Ave Minneapolis, MN | 1.0–2.0 | 1.0–2.0 | 849 | $2,150 | $2.53 | 3d | 7 | 0.94mi |
| 801 N 21st Ave Unit 204 Minneapolis, MN | 1.0 | 1.0 | 750 | $875 | $1.17 | 43d | 1 | 0.99mi |
| 801 21st Ave N Minneapolis, MN | 1.0 | 1.0 | 750 | $875 | $1.17 | 4d | 2 | 0.99mi |
| 2107 N 5th Ave Unit 3 Minneapolis, MN | 1.0 | 1.0 | 687 | $900 | $1.31 | 43d | 1 | 1.15mi |
| 3322 Penn Ave N Minneapolis, MN | 1.0 | 1.0 | 660 | $1,350 | $2.05 | 14d | 1 | 1.16mi |
| 1907 Glenwood Ave Minneapolis, MN | 1.0 | 1.0 | 600 | $990 | $1.65 | 7d | 1 | 1.31mi |
| 224 Cedar Lake Rd N Apt 9 Minneapolis, MN | 1.0 | 1.0 | 700 | $825 | $1.18 | 4d | 1 | 1.42mi |
| 224 Cedar Lake Rd N Unit 12 Minneapolis, MN | 2.0 | 1.0 | 750 | $1,100 | $1.47 | 43d | 1 | 1.42mi |
| 3347 Emerson Ave N #2 Minneapolis, MN | 1.0 | 1.0 | 746 | $1,300 | $1.74 | 3d | 1 | 1.42mi |
| 265 N Girard Ave Minneapolis, MN | 1.0–2.0 | 1.0–2.0 | 760 | $2,075 | $2.73 | 7d | 9 | 1.46mi |
| 1207 Glenwood Ave Minneapolis, MN | 1.0 | 1.0 | 593 | $1,452 | $2.45 | 2d | 4 | 1.47mi |
| 229 Irving Ave N Minneapolis, MN | 3.0 | 1.0–2.0 | 767 | $1,387 | $1.81 | 17d | 7 | 1.48mi |
Listing history 15 events
-
2026-05-14status Pending
-
2026-05-12status Active
-
2026-05-12historical Contingent - Inspection
-
2026-05-08$99,000 Active
-
2024-07-23soldstatus $110,000
-
2024-07-19soldstatus $110,000 Sold 258-char remark
Show marketing remark (258 chars)
Cute and cozy 2 bedroom bungalow close to everything. Maple kitchen cabinets and high efficiency furnace. Hardwood floors throughout most of the main level and craftsman built ins. Best deal around and won't last long! Call an agent today for a private tour!
-
2024-06-28status Pending 258-char remark
Show marketing remark (258 chars)
Cute and cozy 2 bedroom bungalow close to everything. Maple kitchen cabinets and high efficiency furnace. Hardwood floors throughout most of the main level and craftsman built ins. Best deal around and won't last long! Call an agent today for a private tour!
-
2024-06-11$135,000 Active 258-char remark
Show marketing remark (258 chars)
Cute and cozy 2 bedroom bungalow close to everything. Maple kitchen cabinets and high efficiency furnace. Hardwood floors throughout most of the main level and craftsman built ins. Best deal around and won't last long! Call an agent today for a private tour!
-
2022-10-25historical
-
2022-10-04price $144,900
-
2022-09-08$149,950 Active
-
2015-06-11soldstatus $42,500 Sold
-
2015-05-21status Pending
-
2014-11-13$49,900 Active
-
1995-08-03soldstatus $18,000
ⓘ Source: listings_history table (triggers on properties + properties_extension) + one-shot
backfill from property_details.listing_events for pre-trigger history.
Tax reassessment forecast MN · Partial reset (capped growth)
- Current annual tax
- $1,554 · $130/mo
- Projected year-2 tax
- $1,554 · $130/mo
- Expected delta
- $0/yr ($0/mo · -0.0%)
ⓘ Screening estimate from a state-policy table — verify with the county assessor before closing.
Climate risk First Street
- Flood 3/10 Moderate FEMA zone X (unshaded) · 20% chance over 30 yrs
- Wildfire 1/10 Low
- Heat 2/10 Low 7 d/yr ≥99°F today · 14 d/yr by 30 yrs out
- Wind 2/10 Low
- Air quality 2/10 Low 1 unhealthy d/yr today · 1 by 30 yrs out
Nearby sold comps map
Loading sold comps map…
Walkable amenities ~0.75 mi
Loading nearby amenities…
Taxation est. · year 1
- Rental income
- $17,498
- − Mortgage interest
- −$5,546
- − Property taxes
- −$1,554
- − Insurance
- −$495
- − Repairs & maintenance
- −$1,400
- − Management
- −$1,400
- − Depreciation
- −$2,880
- Taxable income
- $4,224
- Est. tax owed @ 24.0%
- −$1,014
- After-tax cash flow
- $4,531/yr
For passive investors: Depreciation is non-cash, so a rental often shows a tax loss while cash-flowing — sheltering income. Rental losses are passive: they offset passive income freely, and up to $25,000/yr can offset ordinary (W-2) income if you actively participate and your MAGI is under $100k (phasing out to $0 by $150k); unused losses carry forward. On sale, claimed depreciation is recaptured at up to 25%, and gains may owe capital-gains tax (a 1031 exchange can defer both). Figures are a year-1 estimate at your 24.0% rate — not tax advice; consult a CPA.
Schools (NCES district)
- District
- Minneapolis Public School District
- NCES district ID
- 2721240
- Math proficiency
- 35% ▼ -7.00%
- Reading proficiency
- 46% ▼ -1.00%
- Median HH income
- $50,521
- Composite
- 34.92/100
- National rank
- #5067
- State rank
- #217 of 301 in MN
Livability — Minneapolis
- Score
- 78/100
- State rank
- #110
- US rank
- #2525
Category grades
Schools grade is shown separately in the Schools card above.
Census & demographics
- Census place
- Minneapolis, MN
- County
- Hennepin County · 1,150,272 people
- City population
- 417,555
- Metro
- Minneapolis-St. Paul-Bloomington, MN-WI
- Population (ZIP)
- 27,741
- Household income
- $60,225
- Rent vs Own
- Severe rent burden
- 1826.0
Population outlook (Hennepin County) Hauer SSP2
- Today (2025)
- 1,405,227 people
- By 2030
- 1,492,650 · +6.2%
- By 2040
- 1,660,157 · +18.1%
- By 2050
- 1,823,498 · +29.8%
- By 2075
- 2,221,283 · +58.1%
- By 2100
- 2,509,976 · +78.6%
Race, ethnicity, and origin ACS 2023
- Neighborhood character
- Diverse neighborhood (Simpson 0.68)
- Race & ethnicity
- Black 49% White 23% Two or more races 11% Hispanic / Latino 11% Asian 9%
- Hispanic origin (detail)
- Mexican 7% Puerto Rican 1%
- Common ancestry
- Portuguese 3% Lithuanian 2% Italian 1%
- Foreign-born
- 19% · Canada, Guatemala
- Languages at home
- 68% English-only · Other Asian/Pacific 8% Spanish 8%
Political lean MEDSL · Hennepin
- 2024 margin
- Solid D (+42.6) · D 70.2% · R 27.5% · Other 2.3%
- 2008→2024 swing
- +14.0pp toward D · 2008: 28.6pp · 2024: 42.6pp
- All cycles
- 2024: D+42.6 2020: D+43.2 2016: D+35.3 2012: D+27.1 2008: D+28.6
Not yet ingested
- Civics
- —
Market trends
- HPI YoY
- ▼ -33.91%
- Current HPI
- 356.6758
- Rent YoY
- ▲ 7.35%
- Metro
- Minneapolis-St. Paul-Bloomington, MN-WI
- State GDP YoY
- ▲ 2.41%
- F500 in state
- 34
Industry mix (Fortune 500 HQ in MN)
| Industry | F500 HQs | Revenue |
|---|---|---|
| Healthcare | 2 | $407B |
|
||
| Retail | 2 | $150B |
|
||
| Consumer Goods | 2 | $32B |
|
||
| Industrial Machinery | 2 | $6B |
|
||
| Agriculture | 1 | $40B |
|
||
| Healthcare / Medical Devices | 1 | $32B |
|
||
Price history
+450.0% since first listed15 events — show timeline
- 2026-05-14 Pending — NORTHSTARMLS as Distributed by MLS Grid
- 2026-05-12 Relisted — NORTHSTARMLS as Distributed by MLS Grid
- 2026-05-12 Contingent — NORTHSTARMLS as Distributed by MLS Grid
- 2026-05-08 Listed $99,000 NORTHSTARMLS as Distributed by MLS Grid
- 2024-07-23 Sold (Public Records) $110,000 Public Records
- 2024-07-19 Sold (MLS) $110,000 NORTHSTARMLS as Distributed by MLS Grid
- 2024-06-28 Pending — NORTHSTARMLS as Distributed by MLS Grid
- 2024-06-11 Listed $135,000 NORTHSTARMLS as Distributed by MLS Grid
- 2022-10-25 Listing Removed — NORTHSTARMLS as Distributed by MLS Grid
- 2022-10-04 Price Changed $144,900 NORTHSTARMLS as Distributed by MLS Grid
- 2022-09-08 Listed $149,950 NORTHSTARMLS as Distributed by MLS Grid
- 2015-06-11 Sold (MLS) $42,500 NORTHSTARMLS as Distributed by MLS Grid
- 2015-05-21 Pending — NORTHSTARMLS as Distributed by MLS Grid
- 2014-11-13 Listed $49,900 NORTHSTARMLS as Distributed by MLS Grid
- 1995-08-03 Sold (Public Records) $18,000 Public Records
Property tax history
+4.2%/yrLatest (2025): $1,554 · -4.3% YoY. Source: county tax records.
Cash-flow waterfall
monthlySold comps — $/sqft
last 12 mo · ≤1 miLoading sold comps…