 🏷️ Likely Rental
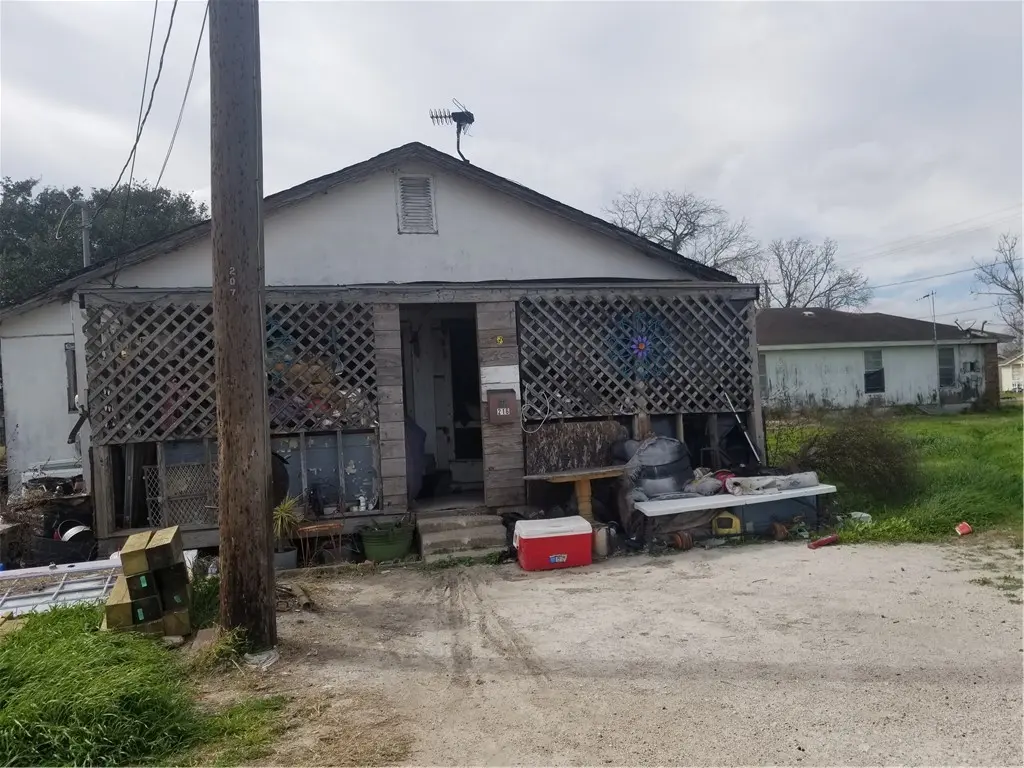
216 N Luque @ Fulton · Sinton, TX
Flood risk No data
- FEMA flood zone
- —
- Chance of flooding over 30 yrs
- —
- Est. flood insurance / yr
- —
Fire risk No data
- Est. fire insurance / yr
- —
Heat risk No data
- Hot days now (above threshold)
- —
- Hot days in 30 yrs
- —
Wind risk No data
- Chance of severe wind over 30 yrs
- —
Air-quality risk No data
- Unhealthy air days now
- —
- Unhealthy air days in 30 yrs
- —
Risk factors via First Street. Map © Google.
Why this score? — see what drove the B- grade
The composite is a weighted blend of 9 inputs, each scored 0–100. Each bar is that input's sub-score; the figure is the points it added to the 100-point composite (weight × sub-score).
- Cash flow +30.0/30.0
- 1% rule +10.0/10.0
- DSCR +10.0/10.0
- ARV discount +7.5/15.0
- Livability +3.2/5.0
- Schools +2.6/10.0
- Rent growth +2.5/5.0
- Condition / age +2.5/5.0
- Appreciation +0.0/10.0
$65,000
🖨 Deal sheet 📄 Offer letter ✓ Due diligence
Listing remarks MLS
CALLING ALL INVESTORS! This diamond in the rough is just waiting for an investor to restore it. It was rented out up until November, 2023, when the 20 year tenant fell ill and had to move out. The bones are good and would be an excellent source of rental income in the growing community of Sinton. Or maybe a do-it-all handyman might want it for his own residence. CALL LISTOR FOR SHOWING INSTRUCTIONS AND QUESTIONS. This is an "as is" sale. Seller will make no repairs. Bring us an offer.
Key facts
- 7,950 sq ft lot
- Built 1946
- Listed 860 days
Neighborhood map
What this means for you Summary
Snapshot
- This is a 3-bed/1.0-bath single-family listed at $65k.
Deal economics
- At list price, monthly cash flow is $844 ($10k/yr) — positive.
- The deal already cash-flows at list — no discount required.
- Meets the 1% rule at list price ($2k rent vs $65k).
- Recommended offer: $57k (12.0% below list) — sets the bar for market timing.
- Cap rate 21.9% vs local median 3.8% in Sinton — top-decile yield for the area; either an underpriced asset or a hidden risk that comps aren't pricing in. Stress-test before assuming the spread holds.
Location & tenants
- Location reads 65/100 on livability (#667 in TX) — a middle-class / working-renter tenant base. Strengths: cost of living A+, health & safety A+, housing A-; Watch: schools F, amenities F, commute F.
- Sinton ISD (town): math 27% / reading 35% proficiency, ranked #601 of 826 in TX (top 73%) — families likely to look elsewhere, expect single-tenant / working-renter base with shorter leases; 67% free/reduced lunch — lower-income household profile, screen leases tightly.
- Market conditions: 159 active listings in the ZIP; 2 comparable units currently listed for rent nearby; 344 units permitted in San Patricio County in 2024 (0 in 5+ unit buildings).
Forward outlook
- Local home prices are declining (-3.0%/yr); year-one equity from $449 of loan paydown is wiped out by about $2k of value loss. Plan a longer hold.
- San Patricio County population projected at +27% by 2050 — long-run rental-demand tailwind backs the buy-and-hold thesis.
- At projected returns (-3.0% appreciation + 3.0% rent growth), your $18k cash investment doubles in ~3 years — after that, you're playing with house money.
Negotiation context
- It's been on market 860 days — a 12% lower offer ($57k) is reasonable based on typical stale-listing flexibility.
Risks & watch-outs
- Watch-outs: property tax is 2.7% of price; built in 1946 — expect roof / HVAC / electrical / plumbing capex.
Questions for the listing agent
- It's been on market 860 days. Have you received any prior offers? Is the seller open to a 12% concession, seller financing, or rate buy-down credit?
- Built in 1946 — when were the roof, HVAC, electrical panel, plumbing, and water heater last replaced?
- Property tax is high relative to price — has the assessment been appealed recently, and will the sale trigger a re-assessment?
- Why hasn't it sold? Are there any deal-killer items the seller is aware of (foundation, flood, title, zoning, code violations)?
- Is there a deadline driving the sale (1031 exchange, divorce, estate, relocation)? That informs how much negotiation room exists.
- Schools are F-rated, which usually means shorter tenancies and higher turnover. Who's the typical renter profile here, and what's been the actual vacancy rate?
- What's the average days-on-market for RENTAL listings here right now (not sales)? A rising rental-DOM trend means longer vacancies and softer asking-rent achievability than the comps imply.
- What's the recent tenant-quality profile in this submarket — average credit score on applications, eviction rate, late-payment / NSF rate, and stable-employment percentage? A property-management company in the area should have these aggregated.
- How much new for-sale + rental construction is in the pipeline within 1–3 miles? Heavy new supply typically softens prices + rents 12–24 months out; constrained supply supports both.
Investment metrics
- 1% rule
- 2.65% ✓
- Cap rate
- 21.88%
- Cash-on-cash
- 55.68%
- DSCR
- 3.48
- GRM
- 3.1
CMA / ARV
- ARV (median comp)
- $149,856
- List price
- $65,000
- Delta
- -56.63%
- Verdict
- UNDERPRICED
- Comps
- 20 within 1.0 mi
Show comp detail 12 sales within ~0.75 mi
| Address | Dist | Beds/Ba | Sqft | Sold | Price | $/sf | Match |
|---|---|---|---|---|---|---|---|
| 408 Avenue D | 0.37mi | 3/1.0 | 1,005 (-6%) | 2mo | $185,500 | $185 | 71 |
| 812 Hamilton St | 0.33mi | 3/2.0 | 1,120 (+4%) | 7mo | $195,500 | $175 | 67 |
| 203 W Fourth St | 0.58mi | 3/2.0 | 1,058 (-1%) | 4mo | $169,900 | $161 | 64 |
| 800 Hamilton St | 0.36mi | 2/1.0 (-1) | 1,139 (+6%) | 6mo | $135,000 | $119 | 63 |
| 400 Avenue B | 0.39mi | 3/2.0 | 1,096 (+2%) | 14mo | $179,999 | $164 | 62 |
| 113 W Welder St | 0.37mi | 3/2.0 | 1,152 (+8%) | 11mo | $225,000 | $195 | 57 |
| 605 S Rachal St | 0.56mi | 2/1.0 (-1) | 1,008 (-6%) | 2mo | $34,900 | $35 | 57 |
| 621 E Merriman St | 0.29mi | 3/2.0 | 1,170 (+9%) | 13mo | $165,750 | $142 | 56 |
| 924 Lewis | 0.42mi | 2/1.0 (-1) | 941 (-12%) | 7mo | $149,999 | $159 | 50 |
| 104 Moonlite | 0.61mi | 3/1.0 | 922 (-14%) | 2mo | $149,900 | $163 | 47 |
| 606 Avenue F | 0.53mi | 4/2.0 (+1) | 1,148 (+7%) | 10mo | $199,900 | $174 | 46 |
| 413 W Main St | 0.55mi | 3/2.0 | 984 (-8%) | 17mo | $105,500 | $107 | 43 |
Match score weights: distance 35% · size 25% · config 20% · recency 20%. Top-matched comps best support the ARV.
Projected returns pro-forma
-3.0% appreciation · 3.0% rent growth · sell at horizon
- IRR
- 54.0%
- Equity multiple
- 3.38×
- Total profit
- $43,321
- Equity at exit
- $9,692
- IRR
- 59.2%
- Equity multiple
- 6.89×
- Total profit
- $107,255
- Equity at exit
- $5,620
Cash invested: $18,200 (down + closing). Projections, not guarantees.
Landlord ↔ Tenant lean methodology
- Overall (STATE)
- 87 Strongly Landlord-Friendly
- State Texas
- 87 Strongly Landlord-Friendly · R+5
- County
- — inherits STATE
- City
- — inherits STATE
ZIP-level market 78387
- Active inventory
- 159
- Price-to-rent
- 3.1×
Monthly cashflow live
- Estimated rent
- $1,723 medium interval (Pro) →
- Mortgage (P&I)
- −$341
- Tax from tax record
- −$149 /mo · $1,782/yr
- Insurance
- −$27
- HOA
- −$0
- Vacancy / Maint / Mgmt
- −$362
- Net cashflow
- $844
Break-even live
UW: 25.0% down · 7.5% · 30yr · 1.5% tax · 5.0% vac · 8.0% maint · 8.0% mgmt
Financing live
Cash to close
- Down payment
- $16,250
- Closing costs
- $1,950
- Reserves months
- —
- Total cash needed
- —
Loan-product check · same deal, 3 products live
Conventional
25% down · 7.5% · 30yr
- Down + closing
- —
- Monthly P&I
- —
- Monthly cashflow
- —
- DSCR
- —
- Eligible?
- —
Personal DTI + credit; lowest rate.
DSCR
20% down · 8.5% · 30yr
- Down + closing
- —
- Monthly P&I
- —
- Monthly cashflow
- —
- DSCR
- —
- Eligible?
- —
No personal income docs; deal must DSCR.
Hard money
10% down · 12.0% · 12mo
- Down + closing
- —
- Monthly P&I
- —
- Monthly cashflow
- —
- DSCR
- —
- Eligible?
- —
Short-term bridge; refi at stabilization.
Rent comps 2 comps
| Address | Beds | Baths | Sqft | Rent | $/sqft | DOM | Units | Dist |
|---|---|---|---|---|---|---|---|---|
| 1005 E Fulton St Sinton, TX | 2.0 | 2.0 | 1326 | $1,700 | $1.28 | 14d | 1 | 0.43mi |
| 804 Avenue B St Unit B Sinton, TX | 3.0 | 2.0 | 1092 | $1,750 | $1.60 | 21d | 1 | 0.63mi |
Listing history 17 events
-
2026-06-18days on market $65,000 Active 860 DOM
-
2026-06-17days on market $65,000 Active 859 DOM
-
2026-06-16days on market $65,000 Active 858 DOM
-
2026-06-15days on market $65,000 Active 857 DOM
-
2026-06-15days on market $65,000 Active 856 DOM
-
2026-06-13days on market $65,000 Active 855 DOM
-
2026-06-12days on market $65,000 Active 854 DOM
-
2026-06-09days on market $65,000 Active 851 DOM
-
2026-06-08days on market $65,000 Active 850 DOM
-
2026-06-08days on market $65,000 Active 849 DOM
-
2026-06-05days on market $65,000 Active 847 DOM
-
2026-06-03days on market $65,000 Active 845 DOM
-
2026-06-02days on market $65,000 Active 844 DOM
-
2026-06-01days on market $65,000 Active 843 DOM
-
2026-05-31days on market $65,000 Active 842 DOM
-
2024-02-29price $65,000 500-char remark
Show marketing remark (500 chars)
CALLING ALL INVESTORS! This diamond in the rough is just waiting for an investor to restore it. It was rented out up until November, 2023, when the 20 year tenant fell ill and had to move out. The bones are good and would be an excellent source of rental income in the growing community of Sinton. Or maybe a do-it-all handyman might want it for his own residence. CALL LISTOR FOR SHOWING INSTRUCTIONS AND QUESTIONS. This is an "as is" sale. Seller will make no repairs. Bring us an offer.
-
2024-01-15$75,000 Active 500-char remark
Show marketing remark (500 chars)
CALLING ALL INVESTORS! This diamond in the rough is just waiting for an investor to restore it. It was rented out up until November, 2023, when the 20 year tenant fell ill and had to move out. The bones are good and would be an excellent source of rental income in the growing community of Sinton. Or maybe a do-it-all handyman might want it for his own residence. CALL LISTOR FOR SHOWING INSTRUCTIONS AND QUESTIONS. This is an "as is" sale. Seller will make no repairs. Bring us an offer.
ⓘ Source: listings_history table (triggers on properties + properties_extension) + one-shot
backfill from property_details.listing_events for pre-trigger history.
Tax reassessment forecast TX · Resets to sale price
- Current annual tax
- $1,782 · $149/mo
- Projected year-2 tax
- $1,782 · $149/mo
- Expected delta
- $0/yr ($0/mo · 0.0%)
ⓘ Screening estimate from a state-policy table — verify with the county assessor before closing.
Nearby sold comps map
Loading sold comps map…
Walkable amenities ~0.75 mi
Loading nearby amenities…
Taxation est. · year 1
- Rental income
- $20,673
- − Mortgage interest
- −$3,641
- − Property taxes
- −$1,782
- − Insurance
- −$325
- − Repairs & maintenance
- −$1,654
- − Management
- −$1,654
- − Depreciation
- −$1,891
- Taxable income
- $9,726
- Est. tax owed @ 24.0%
- −$2,334
- After-tax cash flow
- $7,800/yr
For passive investors: Depreciation is non-cash, so a rental often shows a tax loss while cash-flowing — sheltering income. Rental losses are passive: they offset passive income freely, and up to $25,000/yr can offset ordinary (W-2) income if you actively participate and your MAGI is under $100k (phasing out to $0 by $150k); unused losses carry forward. On sale, claimed depreciation is recaptured at up to 25%, and gains may owe capital-gains tax (a 1031 exchange can defer both). Figures are a year-1 estimate at your 24.0% rate — not tax advice; consult a CPA.
Schools (NCES district)
- District
- Sinton ISD
- NCES district ID
- 4840350
- Math proficiency
- 27% ▼ -19.00%
- Reading proficiency
- 35% ▼ -3.00%
- Median HH income
- $44,618
- Composite
- 26.49/100
- National rank
- #7208
- State rank
- #601 of 826 in TX
Livability — Sinton
- Score
- 65/100
- State rank
- #667
- US rank
- #12510
Category grades
Schools grade is shown separately in the Schools card above.
Census & demographics
- Census place
- Sinton, TX
- Population (ZIP)
- 9,604
Population outlook (San Patricio County) Hauer SSP2
- Today (2025)
- 75,538 people
- By 2030
- 79,575 · +5.3%
- By 2040
- 87,670 · +16.1%
- By 2050
- 96,107 · +27.2%
- By 2075
- 117,984 · +56.2%
- By 2100
- 130,010 · +72.1%
Race, ethnicity, and origin ACS 2023
- Neighborhood character
- Predominantly Hispanic (71%)
- Race & ethnicity
- Hispanic / Latino 71% Two or more races 33% White 25% Black 2%
- Hispanic origin (detail)
- Mexican 64%
- Common ancestry
- Lithuanian 1%
- Foreign-born
- 2% · Canada
- Languages at home
- 62% English-only · Spanish 38%
Political lean MEDSL · San Patricio
- 2024 margin
- Solid R (+36.4) · D 31.4% · R 67.8%
- 2008→2024 swing
- -19.8pp toward R · 2008: -16.6pp · 2024: -36.4pp
- All cycles
- 2024: R+36.4 2020: R+29.1 2016: R+24.1 2012: R+20.6 2008: R+16.6
Not yet ingested
- Civics
- —
Market trends
- HPI YoY
- ▼ -81.32%
- Current HPI
- 149.9517
- Rent YoY
- —
- Metro
- —
- State GDP YoY
- ▲ 3.95%
- F500 in state
- 110
Industry mix (Fortune 500 HQ in TX)
| Industry | F500 HQs | Revenue |
|---|---|---|
| Energy | 16 | $1,198B |
|
||
| Technology | 5 | $198B |
|
||
| Engineering / Construction | 4 | $72B |
|
||
| Energy Services | 3 | $60B |
|
||
| Utilities | 3 | $41B |
|
||
| Healthcare | 2 | $330B |
|
||
Price history
-13.3% since first listed2 events — show timeline
- 2024-02-29 Price Changed $65,000 CBMLS
- 2024-01-15 Listed $75,000 CBMLS
Property tax history
+7.0%/yrLatest (2025): $1,782 · -11.1% YoY. Source: county tax records.
Cash-flow waterfall
monthlySold comps — $/sqft
last 12 mo · ≤1 miLoading sold comps…