28836 Lake Loop N/A · White Branch, MO
Flood risk 2/10 · Minimal
- FEMA flood zone
- X (unshaded)
- Chance of flooding over 30 yrs
- 0.09%
- Est. flood insurance / yr
- $473 – $860
Fire risk 3/10 · Minor
- Est. fire insurance / yr
- $1,054 – $1,958
Heat risk 5/10 · Moderate
- Hot days now (above 107°F)
- 7 days/yr
- Hot days in 30 yrs
- 18 days/yr
Wind risk 2/10 · Minimal
- Chance of severe wind over 30 yrs
- 0.0%
Air-quality risk 1/10 · Minimal
- Unhealthy air days now
- 0 days/yr
- Unhealthy air days in 30 yrs
- 0 days/yr
Risk factors via First Street. Map © Google.
Why this score? — see what drove the D grade
The composite is a weighted blend of 9 inputs, each scored 0–100. Each bar is that input's sub-score; the figure is the points it added to the 100-point composite (weight × sub-score).
- ARV discount +15.0/15.0
- Appreciation +8.3/10.0
- Cash flow +5.6/30.0
- Schools +4.1/10.0
- Rent growth +2.5/5.0
- Livability +2.5/5.0
- Condition / age +2.5/5.0
- 1% rule +1.1/10.0
- DSCR +0.0/10.0
$129,900
🖨 Deal sheet 📄 Offer letter ✓ Due diligence
Listing remarks
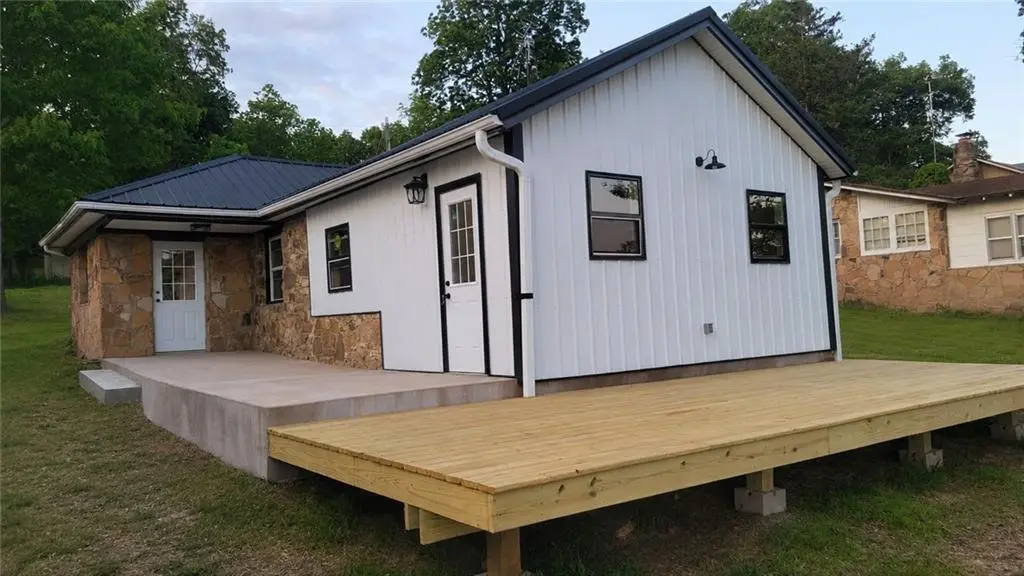
Escape to lake life with this charming retreat just seconds from the water! Featuring 1 bedroom, 1 bathroom, and an additional bunk room, this renovated home offers the perfect blend of comfort and convenience. All electric and full of potential, this property is a great opportunity to make it your own—whether you're looking for a weekend getaway, vacation rental, or full-time lake living. Enjoy the relaxing atmosphere, easy access to the lake, and the option to rent a boat slip at the nearby dock for even more accessibility to the water.
Key facts
- 5,000 sq ft lot
- Built 1940
- Listed 36 days
Property features AI
Finance
- Other: Seller provides warranty
Exterior
- Parking: Other parking
- Utilities: Private well water
- Home design: Single family residence; Residential property
- Construction: Stone and frame construction with stone trim; Metal roof; Slab foundation; Built approximately 76–100 years ago; About 850 above-grade finished area (owner reported)
- Exterior features: Second lake tier waterfront; Lot about 5,000 square feet (public records)
Interior
- Bedrooms: 1 bedroom
- Bathrooms: 1 full bathroom
- Heating & cooling: Electric heating; Electric cooling
- Interior features: Ranch floor plan; One fireplace
Neighborhood map
What this means for you Summary
Snapshot
- This is a 1-bed/1.0-bath other listed at $130k.
Deal economics
- At list price, monthly cash flow is $-273 ($-3k/yr) — negative.
- To cash-flow at today's rent, offer at most $90k (30.4% below list).
- To meet the 1% rule (rent ≥ 1% of price), the offer needs to be $79k (39.1% below list).
- Recommended offer: $79k (39.1% below list) — sets the bar for 1% rule.
Location & tenants
- Location reads: area grade D — affects rentability + tenant quality, not the cash-flow math above.
- Cole Camp R-I (rural): math 49% / reading 49% proficiency, ranked #61 of 324 in MO (top 19%) — families likely to look elsewhere, expect single-tenant / working-renter base with shorter leases.
- Market conditions: 61 active listings in the ZIP; 9 units permitted in Benton County in 2024 (0 in 5+ unit buildings).
Forward outlook
- In year one you build about $9k of equity ($898 loan paydown + $8k appreciation (6.5% local appreciation)).
- Benton County population projected at -21% by 2050 — secular population decline; favor cash flow + early exit over multi-decade hold.
- By year 4, paydown + projected appreciation supports a ~$32k cash-out refi (75% LTV) — recoverable capital for the next deal without selling this one.
Negotiation context
- It's been on market 37 days — a 3% lower offer ($126k) is reasonable based on typical stale-listing flexibility.
Risks & watch-outs
- Watch-outs: built in 1940 — expect roof / HVAC / electrical / plumbing capex.
- Climate carrying-cost: extreme-heat days projected 7→18/yr by 2055 (HVAC capex compounding) — expect insurance premiums to compound above CPI over the hold.
Questions for the listing agent
- What do current leases actually rent for vs. the listed asking? Can we see a recent rent roll and the last 12 months of T-12 income?
- It's been on market 37 days. Have you received any prior offers? Is the seller open to a 39% concession, seller financing, or rate buy-down credit?
- Built in 1940 — when were the roof, HVAC, electrical panel, plumbing, and water heater last replaced?
- Is there a deadline driving the sale (1031 exchange, divorce, estate, relocation)? That informs how much negotiation room exists.
- The area grade is low — what's the realistic commute time and amenity access for the typical tenant pool here? Any planned neighborhood developments (good or bad) we should know about?
- What's the average days-on-market for RENTAL listings here right now (not sales)? A rising rental-DOM trend means longer vacancies and softer asking-rent achievability than the comps imply.
- What's the recent tenant-quality profile in this submarket — average credit score on applications, eviction rate, late-payment / NSF rate, and stable-employment percentage? A property-management company in the area should have these aggregated.
- How much new for-sale + rental construction is in the pipeline within 1–3 miles? Heavy new supply typically softens prices + rents 12–24 months out; constrained supply supports both.
Investment metrics
- 1% rule
- 0.61% ✗
- Cap rate
- 3.77%
- Cash-on-cash
- -9.01%
- DSCR
- 0.60
- GRM
- 13.7
CMA / ARV
- ARV (median comp)
- $172,759
- List price
- $129,900
- Delta
- -21.91%
- Verdict
- UNDERPRICED
- Comps
- 4 within 1.0 mi
Projected returns pro-forma
6.5% appreciation · 3.0% rent growth · sell at horizon
- IRR
- 9.5%
- Equity multiple
- 1.66×
- Total profit
- $24,011
- Equity at exit
- $85,803
- IRR
- 10.8%
- Equity multiple
- 3.29×
- Total profit
- $83,364
- Equity at exit
- $159,308
Cash invested: $36,372 (down + closing). Projections, not guarantees.
Landlord ↔ Tenant lean methodology
- Overall (STATE)
- 81 Strongly Landlord-Friendly
- State Missouri
- 81 Strongly Landlord-Friendly · R+10
- County
- — inherits STATE
- City
- — inherits STATE
ZIP-level market 65338
- Home prices YoY
- 2.8%
- Active inventory
- 61
- Price-to-rent
- 13.7×
Monthly cashflow live
- Estimated rent
- $791 medium interval (Pro) →
- Mortgage (P&I)
- −$681
- Tax est. 1.5%
- −$162 /mo · $1,948/yr
- Insurance
- −$54
- HOA
- −$0
- Vacancy / Maint / Mgmt
- −$166
- Net cashflow
- $-273
Break-even live
UW: 25.0% down · 7.5% · 30yr · 1.5% tax · 5.0% vac · 8.0% maint · 8.0% mgmt
Financing live
Cash to close
- Down payment
- $32,475
- Closing costs
- $3,897
- Reserves months
- —
- Total cash needed
- —
Loan-product check · same deal, 3 products live
Conventional
25% down · 7.5% · 30yr
- Down + closing
- —
- Monthly P&I
- —
- Monthly cashflow
- —
- DSCR
- —
- Eligible?
- —
Personal DTI + credit; lowest rate.
DSCR
20% down · 8.5% · 30yr
- Down + closing
- —
- Monthly P&I
- —
- Monthly cashflow
- —
- DSCR
- —
- Eligible?
- —
No personal income docs; deal must DSCR.
Hard money
10% down · 12.0% · 12mo
- Down + closing
- —
- Monthly P&I
- —
- Monthly cashflow
- —
- DSCR
- —
- Eligible?
- —
Short-term bridge; refi at stabilization.
Listing history 21 events
-
2026-06-19days on market $129,900 Active 37 DOM
-
2026-06-18days on market $129,900 Active 36 DOM
-
2026-06-17price $129,900 Active 35 DOM
-
2026-06-17days on market $134,900 Active 35 DOM
-
2026-06-16days on market $134,900 Active 34 DOM
-
2026-06-15days on market $134,900 Active 33 DOM
-
2026-06-14days on market $134,900 Active 31 DOM
-
2026-06-12days on market $134,900 Active 30 DOM
-
2026-06-09days on market $134,900 Active 27 DOM
-
2026-06-08days on market $134,900 Active 26 DOM
-
2026-06-07days on market $134,900 Active 25 DOM
-
2026-06-05pricedays on market $134,900 Active 22 DOM
-
2026-06-03days on market $144,900 Active 21 DOM
-
2026-06-02days on market $144,900 Active 20 DOM
-
2026-06-01days on market $144,900 Active 19 DOM
-
2026-05-31days on market $144,900 Active 18 DOM
-
2026-05-30days on market $144,900 Active 17 DOM
-
2026-05-14$144,900 Active 550-char remark
-
2026-05-13price $144,900 550-char remark
-
2026-05-13historical $139,900 550-char remark
-
1981-10-01soldstatus
ⓘ Source: listings_history table (triggers on properties + properties_extension) + one-shot
backfill from property_details.listing_events for pre-trigger history.
Climate risk First Street
- Flood 2/10 Low FEMA zone X (unshaded) · 9% chance over 30 yrs
- Wildfire 3/10 Moderate
- Heat 5/10 Major 7 d/yr ≥107°F today · 18 d/yr by 30 yrs out
- Wind 2/10 Low 0% chance of damaging wind over 30 yrs
- Air quality 1/10 Low 0 unhealthy d/yr today · 0 by 30 yrs out
Nearby sold comps map
Loading sold comps map…
Walkable amenities ~0.75 mi
Loading nearby amenities…
Taxation est. · year 1
- Rental income
- $9,486
- − Mortgage interest
- −$7,276
- − Property taxes
- −$1,948
- − Insurance
- −$650
- − Repairs & maintenance
- −$759
- − Management
- −$759
- − Depreciation
- −$3,779
- Taxable loss
- −$5,685
- Est. tax savings @ 24.0%
- +$1,364
- After-tax cash flow
- $-1,914/yr
For passive investors: Depreciation is non-cash, so a rental often shows a tax loss while cash-flowing — sheltering income. Rental losses are passive: they offset passive income freely, and up to $25,000/yr can offset ordinary (W-2) income if you actively participate and your MAGI is under $100k (phasing out to $0 by $150k); unused losses carry forward. On sale, claimed depreciation is recaptured at up to 25%, and gains may owe capital-gains tax (a 1031 exchange can defer both). Figures are a year-1 estimate at your 24.0% rate — not tax advice; consult a CPA.
Schools (NCES district)
- District
- Cole Camp R-I
- NCES district ID
- 2909900
- Math proficiency
- 49% ▼ -10.00%
- Reading proficiency
- 49% ▼ -5.00%
- Median HH income
- $37,598
- Composite
- 40.78/100
- National rank
- #3641
- State rank
- #61 of 324 in MO
Livability — White Branch
No livability data for this city. (Only ~50 U.S. cities are tracked.)
Census & demographics
- Population (ZIP)
- 3,403
Population outlook (Benton County) Hauer SSP2
- Today (2025)
- 17,355 people
- By 2030
- 16,513 · -4.9%
- By 2040
- 14,898 · -14.2%
- By 2050
- 13,662 · -21.3%
- By 2075
- 11,308 · -34.8%
- By 2100
- 8,755 · -49.6%
Race, ethnicity, and origin ACS 2023
- Neighborhood character
- Predominantly White (90%)
- Race & ethnicity
- White 90% Two or more races 3% Black 3% Hispanic / Latino 2%
- Common ancestry
- Serbian 3% Lithuanian 1% Italian 1%
- Foreign-born
- 1% · Canada, Jamaica
- Languages at home
- 96% English-only · German/W. Germanic 2% Spanish 1%
Political lean MEDSL · Benton
- 2024 margin
- Solid R (+59.1) · D 20.1% · R 79.2%
- 2008→2024 swing
- -36.8pp toward R · 2008: -22.3pp · 2024: -59.1pp
- All cycles
- 2024: R+59.1 2020: R+56.6 2016: R+54.1 2012: R+34.3 2008: R+22.3
Not yet ingested
- Civics
- —
Market trends
- HPI YoY
- ▲ 6.50%
- Current HPI
- 236.0122
- Rent YoY
- —
- Metro
- —
- State GDP YoY
- ▲ 1.84%
- F500 in state
- 20
Industry mix (Fortune 500 HQ in MO)
| Industry | F500 HQs | Revenue |
|---|---|---|
| Healthcare | 1 | $163B |
|
||
| Insurance | 1 | $21B |
|
||
| Industrial Technology | 1 | $17B |
|
||
| Retail | 1 | $16B |
|
||
| Industrial Distribution | 1 | $10B |
|
||
| Utilities | 1 | $9B |
|
||
Price history
-7.1% since first listed6 events — show timeline
- 2026-06-17 Price Changed $129,900 Heartland MLS as Distributed by MLS Grid
- 2026-06-03 Price Changed $134,900 Heartland MLS as Distributed by MLS Grid
- 2026-05-14 Listed $144,900 Heartland MLS as Distributed by MLS Grid
- 2026-05-13 Price Changed $144,900 Heartland MLS as Distributed by MLS Grid
- 2026-05-13 Coming Soon $139,900 Heartland MLS as Distributed by MLS Grid
- 1981-10-01 Sold (Public Records) — Public Records
Property tax history
+2.6%/yrLatest (2025): $234 · +16.2% YoY. Source: county tax records.
Cash-flow waterfall
monthlySold comps — $/sqft
last 12 mo · ≤1 miLoading sold comps…