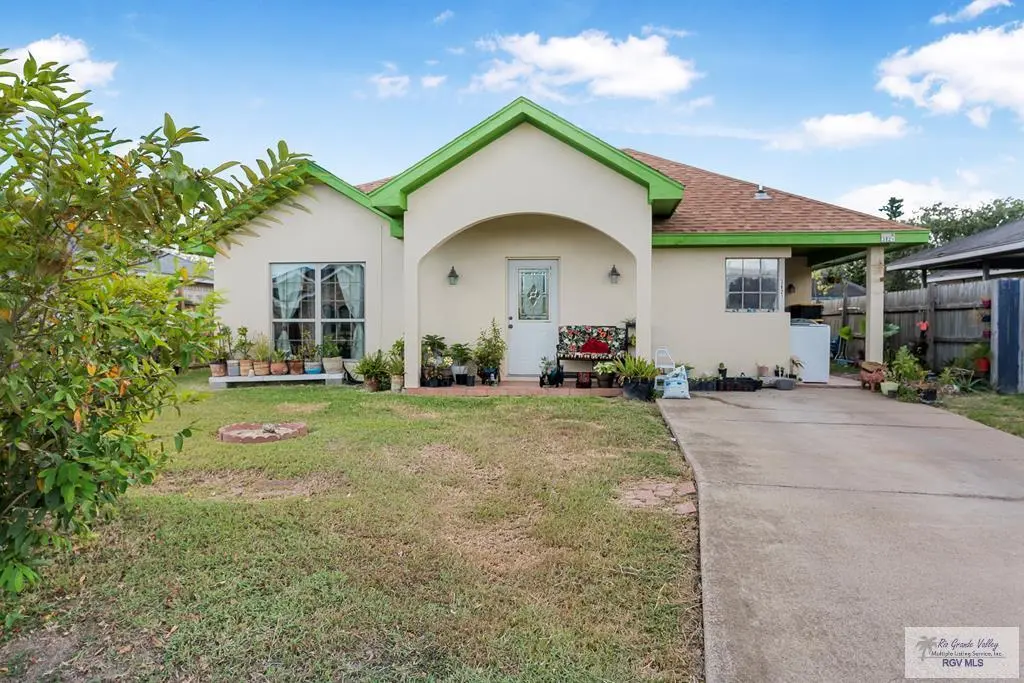
3821 Rey Fausto Dr · Brownsville, TX
Flood risk 2/10 · Minimal
- FEMA flood zone
- X (unshaded)
- Chance of flooding over 30 yrs
- 0.03%
- Est. flood insurance / yr
- $507 – $1,088
Fire risk 4/10 · Minor
- Est. fire insurance / yr
- $1,222 – $2,270
Heat risk 9/10 · Severe
- Hot days now (above 110°F)
- 6 days/yr
- Hot days in 30 yrs
- 20 days/yr
Wind risk 9/10 · Severe
- Chance of severe wind over 30 yrs
- 99.0%
Air-quality risk 3/10 · Minor
- Unhealthy air days now
- 2 days/yr
- Unhealthy air days in 30 yrs
- 3 days/yr
Risk factors via First Street. Map © Google.
Why this score? — see what drove the D grade
The composite is a weighted blend of 9 inputs, each scored 0–100. Each bar is that input's sub-score; the figure is the points it added to the 100-point composite (weight × sub-score).
- Cash flow +15.4/30.0
- DSCR +4.7/10.0
- Rent growth +4.5/5.0
- 1% rule +4.2/10.0
- Livability +4.0/5.0
- ARV discount +3.6/15.0
- Condition / age +2.8/5.0
- Schools +2.2/10.0
- Appreciation +0.0/10.0
$195,000
🖨 Deal sheet (PDF) 📄 Offer letter ✓ Due diligence
Listing remarks MLS
Charming home situated in a highly sought-after established area. Home is cozy with comfortable living space. Spacious backyard with outdoor patio. Second patio on the north side of the house accessible through kitchen. Attached laundry room/storage accessed outside. 3rd bedroom was meant to be main bedroom and has a room with setup for bathroom to be installed currently used as a second closet, has sliding door to backyard patio. Driveway accommodates two vehicles. Roof replaced approximately 3 years, water heater recently replaced. Great centralized location! 30 minutes away from Space-X, 35 minutes from South Padre Island, and less than 15 minutes from downtown Brownsville. Bring all offers.
Key facts
- Spacious backyard
- Outdoor patio
- Roof replaced
Tags
Neighborhood map
What this means for you Summary
Snapshot
- This is a 3-bed/1.0-bath single-family listed at $195k. Condition is rated average.
Deal economics
- At list price, monthly cash flow is $76 ($916/yr) — positive.
- The deal already cash-flows at list — no discount required.
- To meet the 1% rule (rent ≥ 1% of price), the offer needs to be $180k (7.6% below list).
- Recommended offer: $172k (12.0% below list) — sets the bar for market timing.
- Cap rate 6.8% vs local median 5.0% in Brownsville — top-decile yield for the area; either an underpriced asset or a hidden risk that comps aren't pricing in. Stress-test before assuming the spread holds.
Location & tenants
- Location reads 79/100 on livability (#62 in TX, #2,311 nationally) — a middle-class / working-renter tenant base. Strengths: commute A+, cost of living A+, housing A+; Watch: amenities D, crime D-, employment F.
- Brownsville ISD (urban): math 20% / reading 34% proficiency, ranked #710 of 826 in TX (top 86%) — low school quality limits family demand, transient renter base, plan for 1-2y turnover; 83% free/reduced lunch — lower-income household profile, screen leases tightly.
- Zoned schools: Gonzalez El (math 17% / reading 24%, grade F, #3,515 of 4,322 statewide, top 82%, 653 students, 91% FRL); Perkins Middle (math 11% / reading 18%, grade F, #1,583 of 1,662 statewide, top 96%, 571 students, 96% FRL); Rivera Early College H S (math 12% / reading 38%, grade F, #1,250 of 1,632 statewide, top 77%, 2,254 students, 84% FRL).
- Market conditions: Rents rising fast (+8.2%/yr); 366 active listings in the ZIP; 18 comparable units currently listed for rent nearby; rentals at typical pace (median 23d on market — plan ~3-4 weeks tenant-placement turnaround); lower-income renter base — watch delinquency; 2,326 units permitted in Cameron County in 2024 (503 in 5+ unit buildings).
- At $1,802/mo this rent would consume 49% of the median local household income ($45k/yr) (locally 2682% of renters already pay >50% of income on rent) — very limited rent-growth headroom before tenants either downsize or default.
Forward outlook
- Local home prices are declining (-3.0%/yr); year-one equity from $1k of loan paydown is wiped out by about $6k of value loss. Plan a longer hold.
- Cameron County population projected at +3% by 2050 — modest demand growth; plan on rents tracking national, not racing it.
Negotiation context
- It's been on market 216 days — a 12% lower offer ($172k) is reasonable based on typical stale-listing flexibility.
Risks & watch-outs
- Climate carrying-cost: severe wind risk, 99% chance of damaging wind over 30y; extreme-heat days projected 6→20/yr by 2055 (HVAC capex compounding) — expect insurance premiums to compound above CPI over the hold.
Questions for the listing agent
- It's been on market 216 days. Have you received any prior offers? Is the seller open to a 12% concession, seller financing, or rate buy-down credit?
- Why hasn't it sold? Are there any deal-killer items the seller is aware of (foundation, flood, title, zoning, code violations)?
- Is there a deadline driving the sale (1031 exchange, divorce, estate, relocation)? That informs how much negotiation room exists.
- Crime grade is D in this area — have there been break-ins, vandalism, or insurance claims at this property in the last 3 years? What carrier currently insures it and at what premium?
- The area grade is low — what's the realistic commute time and amenity access for the typical tenant pool here? Any planned neighborhood developments (good or bad) we should know about?
- What's the average days-on-market for RENTAL listings here right now (not sales)? A rising rental-DOM trend means longer vacancies and softer asking-rent achievability than the comps imply.
- What's the recent tenant-quality profile in this submarket — average credit score on applications, eviction rate, late-payment / NSF rate, and stable-employment percentage? A property-management company in the area should have these aggregated.
- How much new for-sale + rental construction is in the pipeline within 1–3 miles? Heavy new supply typically softens prices + rents 12–24 months out; constrained supply supports both.
Investment metrics
- 1% rule
- 0.92% ✗
- Cap rate
- 6.76%
- Cash-on-cash
- 1.68%
- DSCR
- 1.07
- GRM
- 9.0
CMA / ARV
- ARV (median comp)
- $179,373
- List price
- $195,000
- Delta
- 8.71%
- Verdict
- FAIR
- Comps
- 5 within 1.0 mi
Show comp detail 1 sale within ~0.75 mi
| Address | Dist | Beds/Ba | Sqft | Sold | Price | $/sf | Match |
|---|---|---|---|---|---|---|---|
| 463 Rey Salomon St | 0.73mi | 3/2.0 | 1,181 (-13%) | 5mo | $190,000 | $161 | 36 |
Match score weights: distance 35% · size 25% · config 20% · recency 20%. Top-matched comps best support the ARV.
Projected returns pro-forma
-3.0% appreciation · 8.0% rent growth · sell at horizon
- IRR
- -8.2%
- Equity multiple
- 0.69×
- Total profit
- $-17,185
- Equity at exit
- $29,075
- IRR
- 6.9%
- Equity multiple
- 1.64×
- Total profit
- $34,759
- Equity at exit
- $16,860
Cash invested: $54,600 (down + closing). Projections, not guarantees.
Landlord ↔ Tenant lean methodology
- Overall (STATE)
- 87 Strongly Landlord-Friendly
- State Texas
- 87 Strongly Landlord-Friendly · R+5
- County
- — inherits STATE
- City
- — inherits STATE
ZIP-level market 78521
- Home prices YoY
- -26.0%
- Rents YoY
- 8.2%
- Active inventory
- 366
- Price-to-rent
- 9.0×
Monthly cashflow live
- Estimated rent
- $1,802 high interval (Pro) →
- Mortgage (P&I)
- −$1,023
- Tax est. 1.5%
- −$244 /mo · $2,925/yr
- Insurance
- −$81
- HOA
- −$0
- Vacancy / Maint / Mgmt
- −$379
- Net cashflow
- $76
Break-even live
Sensitivity live
| Price | -10% $211 | -5% $144 | +0% $76 | +5% $9 | +10% $-58 |
|---|---|---|---|---|---|
| Rent | -10% $-66 | -5% $5 | +0% $76 | +5% $148 | +10% $219 |
| Rate | -1.0pp $175 | -0.5pp $126 | base $76 | +0.5pp $26 | +1.0pp $-26 |
UW: 25.0% down · 7.5% · 30yr · 1.5% tax · 5.0% vac · 8.0% maint · 8.0% mgmt
Financing live
Cash to close
- Down payment
- $48,750
- Closing costs
- $5,850
- Reserves months
- —
- Total cash needed
- —
Loan-product check · same deal, 3 products live
Conventional
25% down · 7.5% · 30yr
- Down + closing
- —
- Monthly P&I
- —
- Monthly cashflow
- —
- DSCR
- —
- Eligible?
- —
Personal DTI + credit; lowest rate.
DSCR
20% down · 8.5% · 30yr
- Down + closing
- —
- Monthly P&I
- —
- Monthly cashflow
- —
- DSCR
- —
- Eligible?
- —
No personal income docs; deal must DSCR.
Hard money
10% down · 12.0% · 12mo
- Down + closing
- —
- Monthly P&I
- —
- Monthly cashflow
- —
- DSCR
- —
- Eligible?
- —
Short-term bridge; refi at stabilization.
Rent comps 18 comps
| Address | Beds | Baths | Sqft | Rent | $/sqft | DOM | Units | Dist |
|---|---|---|---|---|---|---|---|---|
| 4021 Westland Dr Brownsville, TX | 3.0 | 2.0 | 1586 | $2,200 | $1.39 | 15d | 1 | 0.20mi |
| 2021 Westminster Cir Brownsville, TX | 2.0 | 2.0 | 1109 | $1,300 | $1.17 | 45d | 1 | 0.54mi |
| 328 Creekbend Dr Brownsville, TX | 3.0 | 2.0 | 1451 | $2,600 | $1.79 | 23d | 1 | 0.90mi |
| 2600 Elyssa Dr Brownsville, TX | 3.0 | 2.0 | 1216 | $1,850 | $1.52 | 15d | 1 | 1.05mi |
| 538 Land O Lakes Dr Brownsville, TX | 3.0 | 2.0 | 1421 | $1,600 | $1.13 | 45d | 1 | 1.10mi |
| 3901 Las Palmas Cir Brownsville, TX | 2.0 | 2.0 | 1208 | $1,600 | $1.32 | 23d | 1 | 1.22mi |
| 3552 Old Port Isabel Rd Unit A Brownsville, TX | 2.0 | 2.0 | 1500 | $1,600 | $1.07 | 45d | 1 | 1.23mi |
| 2888 Seville Blvd Brownsville, TX | 3.0 | 2.0 | 1456 | $1,650 | $1.13 | 23d | 1 | 1.28mi |
| 2D Palmetto Ct Unit 2D Brownsville, TX | 3.0 | 2.0 | 1360 | $1,450 | $1.07 | 23d | 1 | 1.28mi |
| 2834 Boardwalk Brownsville, TX | 3.0 | 2.0 | 1314 | $1,800 | $1.37 | 23d | 1 | 1.32mi |
| 16 Palmetto Ct Brownsville, TX | 2.0 | 1.5 | 1024 | $1,100 | $1.07 | 23d | 1 | 1.32mi |
| 15 Corine Cir Brownsville, TX | 3.0 | 1.0 | 1337 | $1,200 | $0.90 | 15d | 1 | 1.35mi |
| 2700 Farm to Market Road 802 Brownsville, TX | 1.0–3.0 | 1.0–2.0 | 990 | $2,002 | $2.02 | 15d | 8 | 1.41mi |
| 844 Jenny Cir Brownsville, TX | 4.0 | 2.0 | 1755 | $2,250 | $1.28 | 23d | 1 | 1.42mi |
| 2815 E Price Rd Unit 104 Brownsville, TX | 2.0 | 2.5 | 1123 | $1,350 | $1.20 | 23d | 1 | 1.42mi |
| 120 Galonsky St Unit G3 Brownsville, TX | 2.0 | 2.5 | 1224 | $1,325 | $1.08 | 23d | 1 | 1.43mi |
| 1625 Res St Brownsville, TX | 3.0 | 2.0 | 1504 | $1,800 | $1.20 | 45d | 1 | 1.45mi |
| 3109 Ascension Dr Brownsville, TX | 3.0 | 2.0 | 1632 | $1,800 | $1.10 | 45d | 1 | 1.46mi |
Listing history 18 events
-
2026-06-22days on market $195,000 Active 216 DOM
-
2026-06-18days on market $195,000 Active 213 DOM
-
2026-06-17days on market $195,000 Active 212 DOM
-
2026-06-16days on market $195,000 Active 211 DOM
-
2026-06-15days on market $195,000 Active 210 DOM
-
2026-06-14days on market $195,000 Active 208 DOM
-
2026-06-13days on market $195,000 Active 207 DOM
-
2026-06-10days on market $195,000 Active 205 DOM
-
2026-06-09days on market $195,000 Active 204 DOM
-
2026-06-08days on market $195,000 Active 203 DOM
-
2026-06-07days on market $195,000 Active 202 DOM
-
2026-06-05days on market $195,000 Active 199 DOM
-
2026-06-03days on market $195,000 Active 198 DOM
-
2026-06-02days on market $195,000 Active 197 DOM
-
2026-06-01days on market $195,000 Active 196 DOM
-
2026-05-31days on market $195,000 Active 195 DOM
-
2026-05-30days on market $195,000 Active 194 DOM
-
2025-11-17$195,000 Active 703-char remark
Show marketing remark (703 chars)
Charming home situated in a highly sought-after established area. Home is cozy with comfortable living space. Spacious backyard with outdoor patio. Second patio on the north side of the house accessible through kitchen. Attached laundry room/storage accessed outside. 3rd bedroom was meant to be main bedroom and has a room with setup for bathroom to be installed currently used as a second closet, has sliding door to backyard patio. Driveway accommodates two vehicles. Roof replaced approximately 3 years, water heater recently replaced. Great centralized location! 30 minutes away from Space-X, 35 minutes from South Padre Island, and less than 15 minutes from downtown Brownsville. Bring all offers.
ⓘ Source: listings_history table (triggers on properties + properties_extension) + one-shot
backfill from property_details.listing_events for pre-trigger history.
Climate risk First Street
- Flood 2/10 Low FEMA zone X (unshaded) · 3% chance over 30 yrs
- Wildfire 4/10 Moderate
- Heat 9/10 Extreme 6 d/yr ≥110°F today · 20 d/yr by 30 yrs out
- Wind 9/10 Extreme 99% chance of damaging wind over 30 yrs
- Air quality 3/10 Moderate 2 unhealthy d/yr today · 3 by 30 yrs out
Nearby sold comps map
Loading sold comps map…
Walkable amenities ~0.75 mi
Loading nearby amenities…
Taxation est. · year 1
- Rental income
- $21,629
- − Mortgage interest
- −$10,923
- − Property taxes
- −$2,925
- − Insurance
- −$975
- − Repairs & maintenance
- −$1,730
- − Management
- −$1,730
- − Depreciation
- −$5,673
- Taxable loss
- −$2,327
- Est. tax savings @ 24.0%
- +$559
- After-tax cash flow
- $1,474/yr
For passive investors: Depreciation is non-cash, so a rental often shows a tax loss while cash-flowing — sheltering income. Rental losses are passive: they offset passive income freely, and up to $25,000/yr can offset ordinary (W-2) income if you actively participate and your MAGI is under $100k (phasing out to $0 by $150k); unused losses carry forward. On sale, claimed depreciation is recaptured at up to 25%, and gains may owe capital-gains tax (a 1031 exchange can defer both). Figures are a year-1 estimate at your 24.0% rate — not tax advice; consult a CPA.
Condition & rehab AI · 12 photos
This home requires moderate updates to the kitchen and bathrooms, but is otherwise in average condition. The property is located in a desirable area and has a spacious backyard, making it a good investment opportunity.
Repairs flagged
- Moderate kitchen cabinets — dated and in need of updating
- Moderate kitchen countertops — dated and in need of updating
- Minor bathroom fixtures — standard fixtures
Value-add opportunities
- Resale update kitchen cabinetry and countertops — modernizing the kitchen would attract more buyers
- Resale paint interior walls — fresh paint can make a significant difference in a home's appeal
- Resale update bathroom fixtures — newer fixtures can improve the home's overall look
Renovation cost estimate screening
| Repair item | Severity | Est. cost |
|---|---|---|
| kitchen cabinets · dated and in need of updating | Moderate | $3,000–15,000 |
| kitchen countertops · dated and in need of updating | Moderate | $3,000–15,000 |
| bathroom fixtures · standard fixtures | Minor | $500–3,000 |
| Total estimated repair cost · 3 items | $6,500–33,000 |
Value-add ROI direction
- Resale update kitchen cabinetry and countertops — modernizing the kitchen would attract more buyers ↑
- Resale paint interior walls — fresh paint can make a significant difference in a home's appeal ↑
- Resale update bathroom fixtures — newer fixtures can improve the home's overall look ↑
ⓘ Cost ranges are severity-bucket heuristics (US national rule-of-thumb). Get contractor quotes + a written scope before underwriting a rehab budget.
Schools (NCES district)
- District
- Brownsville ISD
- NCES district ID
- 4811680
- Math proficiency
- 20% ▼ -36.00%
- Reading proficiency
- 34% ▼ -13.00%
- Median HH income
- $30,490
- Composite
- 21.8/100
- National rank
- #8249
- State rank
- #710 of 826 in TX
Livability — Brownsville
- Score
- 79/100
- State rank
- #62
- US rank
- #2311
Category grades
Schools grade is shown separately in the Schools card above.
Census & demographics
- Census place
- Brownsville, TX
- County
- Cameron County · 310,734 people
- City population
- 212,132
- Metro
- Brownsville-Harlingen, TX
- Population (ZIP)
- 87,380
- Household income
- $44,509
- Rent vs Own
- Severe rent burden
- 2682.0
Population outlook (Cameron County) Hauer SSP2
- Today (2025)
- 441,603 people
- By 2030
- 448,113 · +1.5%
- By 2040
- 456,385 · +3.3%
- By 2050
- 456,294 · +3.3%
- By 2075
- 423,851 · -4.0%
- By 2100
- 342,787 · -22.4%
Race, ethnicity, and origin ACS 2023
- Neighborhood character
- Predominantly Hispanic (97%)
- Race & ethnicity
- Hispanic / Latino 97% Two or more races 45% White 3%
- Hispanic origin (detail)
- Mexican 91%
- Foreign-born
- 30% · Canada
- Languages at home
- 12% English-only · Spanish 88%
Political lean MEDSL · Cameron
- 2024 margin
- Lean R (+5.8) · D 46.7% · R 52.5%
- 2008→2024 swing
- -34.6pp toward R · 2008: 28.8pp · 2024: -5.8pp
- All cycles
- 2024: R+5.8 2020: D+13.2 2016: D+32.5 2012: D+32.4 2008: D+28.8
Not yet ingested
- Civics
- —
Market trends
- HPI YoY
- ▼ -81.45%
- Current HPI
- 232.1072
- Rent YoY
- ▲ 8.19%
- Metro
- Brownsville-Harlingen, TX
- State GDP YoY
- ▲ 3.95%
- F500 in state
- 110
Industry mix (Fortune 500 HQ in TX)
| Industry | F500 HQs | Revenue |
|---|---|---|
| Energy | 16 | $1,198B |
|
||
| Technology | 5 | $198B |
|
||
| Engineering / Construction | 4 | $72B |
|
||
| Energy Services | 3 | $60B |
|
||
| Utilities | 3 | $41B |
|
||
| Healthcare | 2 | $330B |
|
||
Price history
1 event — show timeline
- 2025-11-17 Listed $195,000 RGVMLS
Cash-flow waterfall
monthlySold comps — $/sqft
last 12 mo · ≤1 miLoading sold comps…