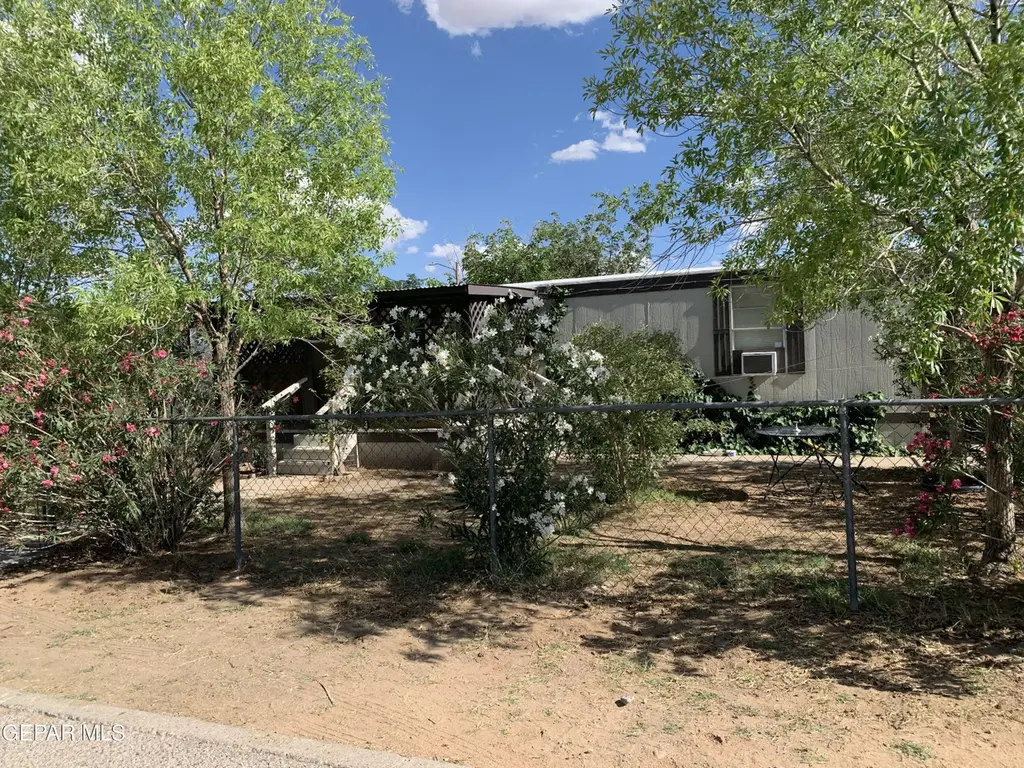
5837 Sunny Vale Cir · El Paso, TX
Flood risk 1/10 · Minimal
- FEMA flood zone
- X
- Chance of flooding over 30 yrs
- 0.0%
- Est. flood insurance / yr
- $507 – $1,088
Fire risk 3/10 · Minor
- Est. fire insurance / yr
- $1,222 – $2,270
Heat risk 6/10 · Moderate
- Hot days now (above 100°F)
- 7 days/yr
- Hot days in 30 yrs
- 22 days/yr
Wind risk 1/10 · Minimal
- Chance of severe wind over 30 yrs
- —
Air-quality risk 3/10 · Minor
- Unhealthy air days now
- 2 days/yr
- Unhealthy air days in 30 yrs
- 2 days/yr
Risk factors via First Street. Map © Google.
Why this score? — see what drove the C- grade
The composite is a weighted blend of 9 inputs, each scored 0–100. Each bar is that input's sub-score; the figure is the points it added to the 100-point composite (weight × sub-score).
- Cash flow +22.1/30.0
- ARV discount +7.5/15.0
- DSCR +7.1/10.0
- 1% rule +4.8/10.0
- Livability +4.0/5.0
- Rent growth +3.6/5.0
- Schools +2.6/10.0
- Condition / age +2.5/5.0
- Appreciation +0.0/10.0
$138,000
🖨 Deal sheet 📄 Offer letter ✓ Due diligence
Listing remarks
Nice home, freshly painted, corner lot, double car garage, lots of greenery, easy access to merchants. Kitchen and live-in room comfortable size. New carpet in master bedroom. Recently replaced the flooring throughout the home.
Key facts
- Lots of greenery
- Corner lot
- 5,869 sq ft lot
Tags
Property features AI
Finance
- Other: Lot size about 0.14 acres (5,869 sq ft); Please do not allow cats inside the home; secure doors and turn off lights per directions
- Financial info: Tax year 2024
- HOA & community: No HOA fees
Exterior
- Utilities: Pool: none
- Home design: Manufactured home
- Construction: Composition roof; Construction materials: see remarks; Total building area 868
- Exterior features: See remarks
Interior
- Kitchen: Free-standing gas oven; Range hood
- Flooring: Tile; Laminate; Carpet
- Bathrooms: 1 full bathroom; 1 three-quarter bathroom
- Heating & cooling: Ceiling fans; Window AC units; Heating: see remarks
- Interior features: Ceiling fans; Blinds
Neighborhood map
What this means for you Summary
Snapshot
- This is a 3-bed/2.0-bath manufactured listed at $138k.
Deal economics
- At list price, monthly cash flow is $222 ($3k/yr) — positive.
- The deal already cash-flows at list — no discount required.
- To meet the 1% rule (rent ≥ 1% of price), the offer needs to be $135k (2.2% below list).
- Recommended offer: $135k (2.2% below list) — sets the bar for 1% rule.
Location & tenants
- Location reads 81/100 on livability (#23 in TX, #1,375 nationally) — a professional / high-income tenant draw. Strengths: commute A+, cost of living A+, housing A+; Watch: employment D+.
- Ysleta ISD (urban): math 27% / reading 35% proficiency, ranked #626 of 826 in TX (top 76%) — families likely to look elsewhere, expect single-tenant / working-renter base with shorter leases; 68% free/reduced lunch — lower-income household profile, screen leases tightly.
- Zoned schools: Parkland El (math 22% / reading 36%, grade F, #2,668 of 4,322 statewide, top 63%, 510 students, 91% FRL); Parkland Pre-Engineering Middle (math 17% / reading 29%, grade F, #1,327 of 1,662 statewide, top 81%, 1,166 students, 83% FRL); Parkland H S (math 29% / reading 42%, grade F, #941 of 1,632 statewide, top 58%, 1,674 students, 71% FRL).
- Market conditions: Rents rising fast (+4.5%/yr); 241 active listings in the ZIP; 21 comparable units currently listed for rent nearby; rentals at typical pace (median 24d on market — plan ~3-4 weeks tenant-placement turnaround); 43% of comp listings sitting > 30 days — soft ceiling on asking rent; 2,196 units permitted in El Paso County in 2024 (143 in 5+ unit buildings).
Forward outlook
- Local home prices are declining (-3.0%/yr); year-one equity from $954 of loan paydown is wiped out by about $4k of value loss. Plan a longer hold.
- El Paso County population projected at +10% by 2050 — modest demand growth; plan on rents tracking national, not racing it.
Negotiation context
- It's been on market 20 days — a 2% lower offer ($136k) is reasonable based on typical stale-listing flexibility.
- 2 sale attempts since 20y ago with the ask held roughly flat each time — persistent listings suggest the price (not the market) is what's stuck; bring a comps-based counter.
- Current owner paid $24k; list at $138k implies a 463% gain — meaningful room to come down on a strong offer.
Risks & watch-outs
- Climate carrying-cost: extreme-heat days projected 7→22/yr by 2055 (HVAC capex compounding) — expect insurance premiums to compound above CPI over the hold.
Questions for the listing agent
- Is there a deadline driving the sale (1031 exchange, divorce, estate, relocation)? That informs how much negotiation room exists.
- Schools are B-rated — typically a magnet for longer-tenancy family renters. What's the average tenant stay here, and is there a school-zone premium baked into asking?
- What's the average days-on-market for RENTAL listings here right now (not sales)? A rising rental-DOM trend means longer vacancies and softer asking-rent achievability than the comps imply.
- What's the recent tenant-quality profile in this submarket — average credit score on applications, eviction rate, late-payment / NSF rate, and stable-employment percentage? A property-management company in the area should have these aggregated.
- How much new for-sale + rental construction is in the pipeline within 1–3 miles? Heavy new supply typically softens prices + rents 12–24 months out; constrained supply supports both.
Investment metrics
- 1% rule
- 0.98% ✗
- Cap rate
- 8.22%
- Cash-on-cash
- 6.90%
- DSCR
- 1.31
- GRM
- 8.5
CMA / ARV
No comps found within radius.
Projected returns pro-forma
-3.0% appreciation · 4.5% rent growth · sell at horizon
- IRR
- -4.2%
- Equity multiple
- 0.84×
- Total profit
- $-6,192
- Equity at exit
- $20,576
- IRR
- 6.9%
- Equity multiple
- 1.55×
- Total profit
- $21,385
- Equity at exit
- $11,932
Cash invested: $38,640 (down + closing). Projections, not guarantees.
Landlord ↔ Tenant lean methodology
- Overall (STATE)
- 87 Strongly Landlord-Friendly
- State Texas
- 87 Strongly Landlord-Friendly · R+5
- County
- — inherits STATE
- City
- — inherits STATE
ZIP-level market 79924
- Home prices YoY
- -13.2%
- Rents YoY
- 4.5%
- Active inventory
- 241
- Price-to-rent
- 8.5×
Monthly cashflow live
- Estimated rent
- $1,350 high interval (Pro) →
- Mortgage (P&I)
- −$724
- Tax from tax record
- −$63 /mo · $759/yr
- Insurance
- −$58
- HOA
- −$0
- Vacancy / Maint / Mgmt
- −$284
- Net cashflow
- $222
Break-even live
UW: 25.0% down · 7.5% · 30yr · 1.5% tax · 5.0% vac · 8.0% maint · 8.0% mgmt
Financing live
Cash to close
- Down payment
- $34,500
- Closing costs
- $4,140
- Reserves months
- —
- Total cash needed
- —
Loan-product check · same deal, 3 products live
Conventional
25% down · 7.5% · 30yr
- Down + closing
- —
- Monthly P&I
- —
- Monthly cashflow
- —
- DSCR
- —
- Eligible?
- —
Personal DTI + credit; lowest rate.
DSCR
20% down · 8.5% · 30yr
- Down + closing
- —
- Monthly P&I
- —
- Monthly cashflow
- —
- DSCR
- —
- Eligible?
- —
No personal income docs; deal must DSCR.
Hard money
10% down · 12.0% · 12mo
- Down + closing
- —
- Monthly P&I
- —
- Monthly cashflow
- —
- DSCR
- —
- Eligible?
- —
Short-term bridge; refi at stabilization.
Rent comps 21 comps
| Address | Beds | Baths | Sqft | Rent | $/sqft | DOM | Units | Dist |
|---|---|---|---|---|---|---|---|---|
| 5741 Arrowhead Dr El Paso, TX | 3.0 | 2.0 | 1080 | $1,175 | $1.09 | 43d | 1 | 0.21mi |
| 5732 Arrowhead Dr El Paso, TX | 3.0 | 1.0 | 957 | $1,175 | $1.23 | 43d | 1 | 0.24mi |
| 5944 Bridalveil Dr El Paso, TX | 2.0 | 2.0 | 912 | $1,250 | $1.37 | 23d | 1 | 0.41mi |
| 5947 Deer Ave El Paso, TX | 2.0 | 1.0 | 893 | $1,250 | $1.40 | 14d | 1 | 0.45mi |
| 10208 Niagara Falls Pl El Paso, TX | 2.0 | 1.0 | 1050 | $1,250 | $1.19 | 43d | 1 | 0.50mi |
| 10202 Niagara Falls Pl El Paso, TX | 3.0 | 1.5 | 1077 | $1,295 | $1.20 | 43d | 1 | 0.52mi |
| 10626 McCombs St Unit 01 El Paso, TX | 2.0 | 1.0 | 725 | $1,100 | $1.52 | 14d | 1 | 0.68mi |
| 5140 Tropicana Ave El Paso, TX | 3.0 | 1.0 | 998 | $1,100 | $1.10 | 11d | 1 | 0.94mi |
| 5140 Tropicana Ave El Paso, TX | 3.0 | 1.0 | 998 | $1,050 | $1.05 | 3d | 1 | 0.94mi |
| 10708 Levelland Pl El Paso, TX | 3.0 | 2.0 | 1064 | $1,400 | $1.32 | 43d | 1 | 0.98mi |
| 10708 Levelland Pl El Paso, TX | 3.0 | 2.0 | 1064 | $1,400 | $1.32 | 14d | 1 | 0.98mi |
| 10800 McCombs St El Paso, TX | 1.0–3.0 | 1.0–2.5 | 1067 | $1,970 | $1.85 | 2d | 12 | 1.01mi |
| 10051 Railroad Dr Unit 202 El Paso, TX | 2.0 | 2.0 | 989 | $975 | $0.99 | 23d | 1 | 1.20mi |
| 10051 Railroad Dr Unit 704 El Paso, TX | 2.0 | 2.0 | 989 | $975 | $0.99 | 43d | 1 | 1.20mi |
| 10051 Railroad Dr Unit 704 El Paso, TX | 2.0 | 2.0 | 989 | $975 | $0.99 | 14d | 1 | 1.20mi |
| 10021 Railroad Dr #402 El Paso, TX | 2.0 | 2.0 | 989 | $1,100 | $1.11 | 43d | 1 | 1.23mi |
| 10452 Persephone Dr El Paso, TX | 3.0 | 2.0 | 1014 | $1,250 | $1.23 | 14d | 1 | 1.24mi |
| 6262 Woodrow Bean Transmountain Unit 2 El Paso, TX | 2.0 | 2.5 | 1000 | $1,345 | $1.34 | 43d | 1 | 1.26mi |
| 4917 Royal Dr El Paso, TX | 3.0 | 2.0 | 1034 | $1,425 | $1.38 | 23d | 1 | 1.36mi |
| 10969 Duke Snider Cir El Paso, TX | 3.0 | 2.0 | 1003 | $1,385 | $1.38 | 11d | 1 | 1.38mi |
| 10037 Oakwood Dr El Paso, TX | 3.0 | 1.5 | 1039 | $1,200 | $1.15 | 43d | 1 | 1.46mi |
Listing history 15 events
-
2026-06-18days on market $138,000 Active 20 DOM
-
2026-06-17days on market $138,000 Active 19 DOM
-
2026-06-16days on market $138,000 Active 18 DOM
-
2026-06-15days on market $138,000 Active 17 DOM
-
2026-06-13days on market $138,000 Active 15 DOM
-
2026-06-10days on market $138,000 Active 12 DOM
-
2026-06-09days on market $138,000 Active 11 DOM
-
2026-06-08days on market $138,000 Active 10 DOM
-
2026-06-07remarks 227-char remark
-
2026-06-07days on market $138,000 Active 9 DOM
-
2026-06-05days on market $138,000 Active 6 DOM
-
2026-06-03days on market $138,000 Active 5 DOM
-
2026-06-03days on market $138,000 Active 4 DOM
-
2026-06-01days on market $138,000 Active 3 DOM
-
2026-05-31days on market $138,000 Active 2 DOM
ⓘ Source: listings_history table (triggers on properties + properties_extension) + one-shot
backfill from property_details.listing_events for pre-trigger history.
Tax reassessment forecast TX · Resets to sale price
- Current annual tax
- $759 · $63/mo
- Projected year-2 tax
- $2,525 · $210/mo
- Expected delta
- +$1,767/yr (+$147/mo · 232.9%)
ⓘ Screening estimate from a state-policy table — verify with the county assessor before closing.
Climate risk First Street
- Flood 1/10 Low FEMA zone X · 0% chance over 30 yrs
- Wildfire 3/10 Moderate
- Heat 6/10 Major 7 d/yr ≥100°F today · 22 d/yr by 30 yrs out
- Wind 1/10 Low
- Air quality 3/10 Moderate 2 unhealthy d/yr today · 2 by 30 yrs out
Nearby sold comps map
Loading sold comps map…
Walkable amenities ~0.75 mi
Loading nearby amenities…
Taxation est. · year 1
- Rental income
- $16,201
- − Mortgage interest
- −$7,730
- − Property taxes
- −$759
- − Insurance
- −$690
- − Repairs & maintenance
- −$1,296
- − Management
- −$1,296
- − Depreciation
- −$4,015
- Taxable income
- $415
- Est. tax owed @ 24.0%
- −$100
- After-tax cash flow
- $2,566/yr
For passive investors: Depreciation is non-cash, so a rental often shows a tax loss while cash-flowing — sheltering income. Rental losses are passive: they offset passive income freely, and up to $25,000/yr can offset ordinary (W-2) income if you actively participate and your MAGI is under $100k (phasing out to $0 by $150k); unused losses carry forward. On sale, claimed depreciation is recaptured at up to 25%, and gains may owe capital-gains tax (a 1031 exchange can defer both). Figures are a year-1 estimate at your 24.0% rate — not tax advice; consult a CPA.
Schools (NCES district)
- District
- Ysleta ISD
- NCES district ID
- 4846680
- Math proficiency
- 27% ▼ -31.00%
- Reading proficiency
- 35% ▼ -11.00%
- Median HH income
- $35,826
- Composite
- 25.65/100
- National rank
- #7400
- State rank
- #626 of 826 in TX
Livability — El Paso
- Score
- 81/100
- State rank
- #23
- US rank
- #1375
Category grades
Schools grade is shown separately in the Schools card above.
Census & demographics
- Census place
- El Paso, TX
- County
- El Paso County · 761,266 people
- City population
- 630,223
- Metro
- El Paso, TX
- Population (ZIP)
- 60,364
- Household income
- $56,976
- Rent vs Own
- Severe rent burden
- 1903.0
Population outlook (El Paso County) Hauer SSP2
- Today (2025)
- 897,899 people
- By 2030
- 922,694 · +2.8%
- By 2040
- 960,492 · +7.0%
- By 2050
- 982,919 · +9.5%
- By 2075
- 997,266 · +11.1%
- By 2100
- 900,630 · +0.3%
Race, ethnicity, and origin ACS 2023
- Neighborhood character
- Predominantly Hispanic (72%)
- Race & ethnicity
- Hispanic / Latino 72% Two or more races 35% White 16% Black 7% Asian 1% Native American 1%
- Hispanic origin (detail)
- Mexican 66% Puerto Rican 2%
- Common ancestry
- Lithuanian 1% Italian 1% Romanian 1%
- Foreign-born
- 19% · Canada, South Korea
- Languages at home
- 42% English-only · Spanish 56% German/W. Germanic 1% Korean 1%
Political lean MEDSL · El Paso
- 2024 margin
- D (+15.1) · D 57.0% · R 41.8% · Other 1.2%
- 2008→2024 swing
- -17.4pp toward R · 2008: 32.5pp · 2024: 15.1pp
- All cycles
- 2024: D+15.1 2020: D+35.1 2016: D+43.2 2012: D+32.6 2008: D+32.5
Not yet ingested
- Civics
- —
Market trends
- HPI YoY
- ▼ -40.46%
- Current HPI
- 265.8729
- Rent YoY
- ▲ 4.50%
- Metro
- El Paso, TX
- State GDP YoY
- ▲ 3.95%
- F500 in state
- 110
Industry mix (Fortune 500 HQ in TX)
| Industry | F500 HQs | Revenue |
|---|---|---|
| Energy | 16 | $1,198B |
|
||
| Technology | 5 | $198B |
|
||
| Engineering / Construction | 4 | $72B |
|
||
| Energy Services | 3 | $60B |
|
||
| Utilities | 3 | $41B |
|
||
| Healthcare | 2 | $330B |
|
||
Price history
+463.3% since first listed6 events — show timeline
- 2026-05-29 Listed $138,000 GEPARMLS
- 2006-07-13 Sold (Public Records) — Public Records
- 2006-03-20 Listing Removed — GEPARMLS
- 2006-01-11 Listed $38,500 GEPARMLS
- 1997-12-30 Sold (Public Records) $24,500 Public Records
- 1992-09-12 Sold (Public Records) — Public Records
Property tax history
+4.6%/yrLatest (2025): $759 · +20.7% YoY. Source: county tax records.
Cash-flow waterfall
monthlySold comps — $/sqft
last 12 mo · ≤1 miLoading sold comps…