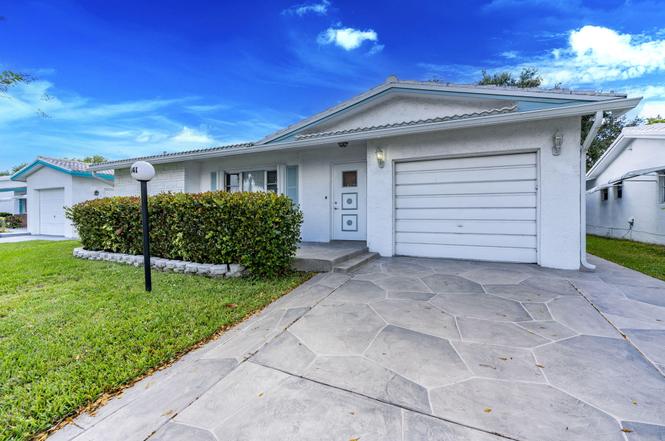
1141 NW 90th Way · Plantation, FL
Flood risk 1/10 · Minimal
- FEMA flood zone
- X (shaded)
- Chance of flooding over 30 yrs
- 0.0%
- Est. flood insurance / yr
- $507 – $1,088
Fire risk 1/10 · Minimal
- Est. fire insurance / yr
- $947 – $1,759
Heat risk 9/10 · Severe
- Hot days now (above 105°F)
- 6 days/yr
- Hot days in 30 yrs
- 22 days/yr
Wind risk 10/10 · Severe
- Chance of severe wind over 30 yrs
- 99.0%
Air-quality risk 3/10 · Minor
- Unhealthy air days now
- 2 days/yr
- Unhealthy air days in 30 yrs
- 3 days/yr
Risk factors via First Street. Map © Google.
Why this score? — see what drove the C- grade
The composite is a weighted blend of 9 inputs, each scored 0–100. Each bar is that input's sub-score; the figure is the points it added to the 100-point composite (weight × sub-score).
- ARV discount +15.0/15.0
- Cash flow +13.3/30.0
- 1% rule +4.5/10.0
- Schools +4.1/10.0
- Livability +4.1/5.0
- DSCR +4.0/10.0
- Rent growth +2.7/5.0
- Condition / age +2.5/5.0
- Appreciation +0.0/10.0
$359,000
🖨 Deal sheet (PDF) 📄 Offer letter ✓ Due diligence
Listing remarks MLS
PRICED TO SELL!!!, EXTRA living area, this home has 3 Bedrooms, 2 Full Bathrooms and 1 extra BONUS room that can be converted to a 4th room. 1 Car Garage. UPDATED bathrooms and Kitchen, stainless steel appliances, fans, Ceramic tile throughout, Knockdown Texture Ceilings. Screened rear patio and front porch. No neighbors in the back. Maintenance Includes pest control, lawn care, exterior paint, minor plumbing and electrical repairs, and cable, and also your roof is taken care of. Community offers 2 pools, tennis, entertainment, Bus route, fitness center and more amenities. Located in one of the Best Adult Communities (55+) in Broward, close to Shopping Centers. Association requires:1 owner must be 55+, 20% down.
Key facts
- Tile throughout
- Flex room office
- New washer dryer
Tags
Property features AI
Finance
- Other: Senior community; Pets not allowed
- HOA & community: Part of Lauderdale West association; Monthly HOA fee; Association amenities include clubhouse, fitness center, playground, pool; HOA pays for cable TV and grounds maintenance
Exterior
- Parking: Attached garage with 1 garage space (garage door opener); Total 2 parking spaces (1 covered)
- Utilities: Public water; Public sewer; Three-phase electric; Cable available
- Home design: Single family residence; One story; Faces east; Resale condition
- Construction: Built with stucco and CBS; Spanish tile roof
- Exterior features: Open patio; Open porch; Patio and porch space; Not waterfront
Interior
- Kitchen: Dishwasher; Electric range; Refrigerator
- Bedrooms: 3 bedrooms on the main level
- Flooring: Ceramic tile
- Bathrooms: 2 full bathrooms (main level)
- Heating & cooling: Central heating; Central air; Ceiling fans
- Interior features: Walk-in closets; Blinds
- Laundry & utility: Laundry closet; Electric water heater
Neighborhood map
What this means for you Summary
Snapshot
- This is a 3-bed/2.0-bath single-family listed at $359k.
Deal economics
- At list price, monthly cash flow is $-3 ($-36/yr) — negative.
- To cash-flow at today's rent, offer at most $358k (0.1% below list).
- To meet the 1% rule (rent ≥ 1% of price), the offer needs to be $339k (5.4% below list).
- Recommended offer: $316k (12.0% below list) — sets the bar for market timing.
- Cap rate 6.3% vs local median 3.4% in Plantation — top-decile yield for the area; either an underpriced asset or a hidden risk that comps aren't pricing in. Stress-test before assuming the spread holds.
Location & tenants
- Location reads 82/100 on livability (#70 in FL, #1,174 nationally) — a professional / high-income tenant draw. Strengths: commute A+, housing A+, health & safety A+; Watch: amenities C-, cost of living D-.
- Broward (suburban): math 42% / reading 53% proficiency, ranked #46 of 73 in FL (top 63%) — families likely to look elsewhere, expect single-tenant / working-renter base with shorter leases.
- Zoned schools: Mirror Lake Elementary School (math 33% / reading 48%, grade F, #1,471 of 2,144 statewide, top 69%, 610 students, 68% FRL); Plantation Middle School (math 20% / reading 39%, grade F, #469 of 571 statewide, top 84%, 572 students, 72% FRL); Plantation High School (math 14% / reading 36%, grade F, #501 of 667 statewide, top 75%, 1,818 students, 68% FRL) — zoned schools average 70% FRL vs 51% district-wide (18 pts higher); higher-poverty schools than district average — tighter screening recommended.
- Zoned-school proficiency averages 32% at this address vs 48% district-wide (-16 pts) — the specific schools serving this property underperform the Broward average; the district grade overstates school quality for this exact location.
- Market conditions: Rents flat; 560 active listings in the ZIP; 40 comparable units currently listed for rent nearby; rentals at typical pace (median 23d on market — plan ~3-4 weeks tenant-placement turnaround); 2,111 units permitted in Broward County in 2024 (1,265 in 5+ unit buildings).
- At $3,395/mo this rent would consume 57% of the median local household income ($72k/yr) (locally 931% of renters already pay >50% of income on rent) — very limited rent-growth headroom before tenants either downsize or default.
Forward outlook
- Local home prices are declining (-3.0%/yr); year-one equity from $2k of loan paydown is wiped out by about $11k of value loss. Plan a longer hold.
- Broward County population projected at +34% by 2050 — long-run rental-demand tailwind backs the buy-and-hold thesis.
Negotiation context
- It's been on market 194 days — a 12% lower offer ($316k) is reasonable based on typical stale-listing flexibility.
- 9 sale attempts since 11y ago with the ask held roughly flat each time — persistent listings suggest the price (not the market) is what's stuck; bring a comps-based counter.
- Current owner paid $225k; list at $359k implies a 60% gain — meaningful room to come down on a strong offer.
Risks & watch-outs
- Climate carrying-cost: severe wind risk, 99% chance of damaging wind over 30y; extreme-heat days projected 6→22/yr by 2055 (HVAC capex compounding) — expect insurance premiums to compound above CPI over the hold.
Questions for the listing agent
- What do current leases actually rent for vs. the listed asking? Can we see a recent rent roll and the last 12 months of T-12 income?
- It's been on market 194 days. Have you received any prior offers? Is the seller open to a 12% concession, seller financing, or rate buy-down credit?
- Built in 1978 — when were the roof, HVAC, electrical panel, plumbing, and water heater last replaced?
- What does the HOA fee cover, when was the last increase, and are there any pending special assessments or reserve-fund shortfalls?
- Why hasn't it sold? Are there any deal-killer items the seller is aware of (foundation, flood, title, zoning, code violations)?
- Is there a deadline driving the sale (1031 exchange, divorce, estate, relocation)? That informs how much negotiation room exists.
- Schools are B-rated — typically a magnet for longer-tenancy family renters. What's the average tenant stay here, and is there a school-zone premium baked into asking?
- What's the average days-on-market for RENTAL listings here right now (not sales)? A rising rental-DOM trend means longer vacancies and softer asking-rent achievability than the comps imply.
- What's the recent tenant-quality profile in this submarket — average credit score on applications, eviction rate, late-payment / NSF rate, and stable-employment percentage? A property-management company in the area should have these aggregated.
- How much new for-sale + rental construction is in the pipeline within 1–3 miles? Heavy new supply typically softens prices + rents 12–24 months out; constrained supply supports both.
Investment metrics
- 1% rule
- 0.95% ✗
- Cap rate
- 6.28%
- Cash-on-cash
- -0.04%
- DSCR
- 1.00
- GRM
- 8.8
CMA / ARV
- ARV (on-the-fly)
- $620,230
- Comps found
- 4
Show comp detail 4 sales within ~0.75 mi
| Address | Dist | Beds/Ba | Sqft | Sold | Price | $/sf | Match |
|---|---|---|---|---|---|---|---|
| 967 NW 89th Ave | 0.42mi | 3/2.0 | 1,616 (-4%) | 3mo | $480,000 | $297 | 70 |
| 990 NW 89th Ave | 0.38mi | 3/2.0 | 1,494 (-12%) | 8mo | $548,000 | $367 | 56 |
| 9354 NW 18th Mnr | 0.68mi | 3/2.0 | 1,568 (-7%) | 18mo | $624,900 | $399 | 42 |
| 1228 NW 85th Ave | 0.59mi | 2/2.0 (-1) | 1,438 (-15%) | 12mo | $345,000 | $240 | 32 |
Match score weights: distance 35% · size 25% · config 20% · recency 20%. Top-matched comps best support the ARV.
Projected returns pro-forma
-3.0% appreciation · 0.6% rent growth · sell at horizon
- IRR
- -19.3%
- Equity multiple
- 0.34×
- Total profit
- $-66,195
- Equity at exit
- $53,528
- IRR
- -18.4%
- Equity multiple
- 0.12×
- Total profit
- $-88,481
- Equity at exit
- $31,040
Cash invested: $100,520 (down + closing). Projections, not guarantees.
Landlord ↔ Tenant lean methodology
- Overall (STATE)
- 87 Strongly Landlord-Friendly
- State Florida
- 87 Strongly Landlord-Friendly · R+3
- County
- — inherits STATE
- City
- — inherits STATE
ZIP-level market 33322
- Home prices YoY
- -33.3%
- Rents YoY
- 0.6%
- Active inventory
- 560
- Price-to-rent
- 8.8×
Monthly cashflow live
- Estimated rent
- $3,395 high interval (Pro) →
- Mortgage (P&I)
- −$1,883
- Tax from tax record
- −$98 /mo · $1,170/yr
- Insurance
- −$150
- HOA
- −$555
- Vacancy / Maint / Mgmt
- −$713
- Net cashflow
- $-3
Break-even live
Sensitivity live
| Price | -10% $200 | -5% $99 | +0% $-3 | +5% $-105 | +10% $-206 |
|---|---|---|---|---|---|
| Rent | -10% $-271 | -5% $-137 | +0% $-3 | +5% $131 | +10% $265 |
| Rate | -1.0pp $178 | -0.5pp $88 | base $-3 | +0.5pp $-96 | +1.0pp $-191 |
UW: 25.0% down · 7.5% · 30yr · 1.5% tax · 5.0% vac · 8.0% maint · 8.0% mgmt
Financing live
Cash to close
- Down payment
- $89,750
- Closing costs
- $10,770
- Reserves months
- —
- Total cash needed
- —
Loan-product check · same deal, 3 products live
Conventional
25% down · 7.5% · 30yr
- Down + closing
- —
- Monthly P&I
- —
- Monthly cashflow
- —
- DSCR
- —
- Eligible?
- —
Personal DTI + credit; lowest rate.
DSCR
20% down · 8.5% · 30yr
- Down + closing
- —
- Monthly P&I
- —
- Monthly cashflow
- —
- DSCR
- —
- Eligible?
- —
No personal income docs; deal must DSCR.
Hard money
10% down · 12.0% · 12mo
- Down + closing
- —
- Monthly P&I
- —
- Monthly cashflow
- —
- DSCR
- —
- Eligible?
- —
Short-term bridge; refi at stabilization.
Rent comps 40 comps
| Address | Beds | Baths | Sqft | Rent | $/sqft | DOM | Units | Dist |
|---|---|---|---|---|---|---|---|---|
| 9090 NW 11th Ct Plantation, FL | 3.0 | 2.0 | 2112 | $5,000 | $2.37 | 22d | 1 | 0.11mi |
| 9023 Vineyard Lake Dr Plantation, FL | 3.0 | 2.5 | 1739 | $3,500 | $2.01 | 9d | 1 | 0.26mi |
| 9023 Vineyard Lake Dr Plantation, FL | 3.0 | 2.5 | 1739 | $3,500 | $2.01 | 3d | 1 | 0.26mi |
| 992 NW 93rd Ave Plantation, FL | 3.0 | 2.0 | 1504 | $3,350 | $2.23 | 26d | 1 | 0.33mi |
| 9087 Vineyard Lake Dr Plantation, FL | 3.0 | 2.5 | 1590 | $3,350 | $2.11 | 26d | 1 | 0.37mi |
| 9161 Vineyard Lake Dr Unit 9161 Plantation, FL | 3.0 | 2.5 | 1765 | $4,000 | $2.27 | 26d | 1 | 0.40mi |
| 9581 NW 9th Ct Plantation, FL | 4.0 | 2.5 | 2005 | $5,400 | $2.69 | 26d | 1 | 0.48mi |
| 858 NW 92nd Ave Unit 858 Plantation, FL | 2.0 | 2.0 | 1185 | $2,300 | $1.94 | 5d | 1 | 0.52mi |
| 705 NW 91st Ter Plantation, FL | 2.0 | 2.0 | 1097 | $2,400 | $2.19 | 13d | 1 | 0.52mi |
| 845 NW 91st Ter Unit 845 Plantation, FL | 3.0 | 2.5 | 1515 | $3,500 | $2.31 | 26d | 1 | 0.52mi |
| 729 NW 92nd Ave Plantation, FL | 2.0 | 2.0 | 1097 | $2,300 | $2.10 | 26d | 1 | 0.53mi |
| 704 NW 92nd Ave #704 Plantation, FL | 2.0 | 2.0 | 1097 | $2,350 | $2.14 | 4d | 1 | 0.53mi |
| 704 NW 92nd Ave Plantation, FL | 2.0 | 2.0 | 1097 | $2,400 | $2.19 | 26d | 1 | 0.53mi |
| 8536 NW 12th Ct Plantation, FL | 2.0 | 2.0 | 1138 | $2,625 | $2.31 | 19d | 1 | 0.54mi |
| 832 NW 86th Ave Plantation, FL | 2.0 | 2.0 | 1144 | $2,913 | $2.55 | 24d | 1 | 0.57mi |
| 1140 NW 85th Ave Unit A16 Plantation, FL | 2.0 | 1.5 | 1065 | $1,950 | $1.83 | 26d | 1 | 0.58mi |
| 9321 W Sunrise Blvd Plantation, FL | 2.0 | 2.0 | 1342 | $2,700 | $2.01 | 4d | 1 | 0.59mi |
| 8253 NW 9th St #3 Plantation, FL | 3.0 | 2.5 | 1770 | $2,800 | $1.58 | 9d | 1 | 0.59mi |
| 8244 NW 9th Ct #8 Fort Lauderdale, FL | 4.0 | 2.5 | 2080 | $3,500 | $1.68 | 26d | 1 | 0.60mi |
| 8811 W Sunrise Blvd #8811 Plantation, FL | 3.0 | 3.0 | 1457 | $3,450 | $2.37 | 1d | 1 | 0.61mi |
| 9812 NW 9th Ct Plantation, FL | 3.0 | 2.5 | 1516 | $3,500 | $2.31 | 6d | 1 | 0.62mi |
| 8244 NW 9th St #5 Plantation, FL | 4.0 | 2.5 | 2020 | $3,150 | $1.56 | 26d | 1 | 0.63mi |
| 8231 NW 8th Pl #3 Plantation, FL | 3.0 | 2.5 | 1770 | $2,850 | $1.61 | 26d | 1 | 0.64mi |
| 8231 NW 8th Pl #3 Plantation, FL | 3.0 | 2.5 | 1654 | $2,850 | $1.72 | 16d | 1 | 0.64mi |
| 9841 NW 9th Ct Plantation, FL | 3.0 | 2.5 | 1516 | $3,800 | $2.51 | 26d | 1 | 0.66mi |
| 9832 NW 9th Ct Plantation, FL | 3.0 | 2.5 | 1473 | $3,450 | $2.34 | 24d | 1 | 0.67mi |
| 8208 NW 8th Pl Plantation, FL | 3.0 | 2.5 | 1770 | $2,950 | $1.67 | 19d | 1 | 0.67mi |
| 9733 NW 7th Cir Plantation, FL | 3.0 | 1.0–2.0 | 1043 | $3,099 | $2.97 | 1d | 29 | 0.70mi |
| 9151 W Sunrise Blvd #9151 Plantation, FL | 3.0 | 2.0 | 1482 | $2,750 | $1.86 | 26d | 1 | 0.72mi |
| 9015 W Sunrise Blvd Plantation, FL | 3.0 | 3.0 | 1318 | $3,200 | $2.43 | 14d | 1 | 0.74mi |
| 791 N Pine Island Rd Plantation, FL | 2.0–3.0 | 2.0 | 1196 | $2,400 | $2.01 | 7d | 2 | 0.75mi |
| 791 N Pine Island Rd #306 Plantation, FL | 3.0 | 2.0 | 1320 | $2,400 | $1.82 | 14d | 1 | 0.75mi |
| 8344 NW 7th Pl Unit 8344 Plantation, FL | 3.0 | 2.5 | 1627 | $4,199 | $2.58 | 26d | 1 | 0.75mi |
| 8500 Cleary Blvd Plantation, FL | 1.0–3.0 | 1.0–2.0 | 1045 | $3,549 | $3.40 | 1d | 21 | 0.76mi |
| 835 NW 81st Way #5 Plantation, FL | 3.0 | 2.5 | 1770 | $2,600 | $1.47 | 9d | 1 | 0.76mi |
| 8080 NW 10th Ct Plantation, FL | 2.0 | 2.0 | 1111 | $2,300 | $2.07 | 26d | 1 | 0.77mi |
| 1171 Lakepointe Lndg Plantation, FL | 2.0 | 1.0–2.0 | 837 | $2,889 | $3.45 | 1d | 22 | 0.78mi |
| 8101 NW 14th St Plantation, FL | 1.0–2.0 | 1.5–2.0 | 1123 | $2,619 | $2.33 | 1d | 12 | 0.79mi |
| 741 N Pine Island Rd #303 Plantation, FL | 3.0 | 2.0 | 1214 | $2,400 | $1.98 | 26d | 1 | 0.79mi |
| 833 NW 81st Ter #8 Plantation, FL | 4.0 | 2.5 | 1770 | $2,900 | $1.64 | 22d | 1 | 0.79mi |
HOA detail
- Monthly dues
- $555 · $6,660/yr
- Likely covers
- electriccablelandscapingpoolgym
Listing history 40 events
-
2026-06-21days on market $359,000 Active 194 DOM
-
2026-06-18days on market $359,000 Active 191 DOM
-
2026-06-17days on market $359,000 Active 190 DOM
-
2026-06-16days on market $359,000 Active 189 DOM
-
2026-06-15days on market $359,000 Active 188 DOM
-
2026-06-13days on market $359,000 Active 186 DOM
-
2026-06-09days on market $359,000 Active 182 DOM
-
2026-06-07days on market $359,000 Active 180 DOM
-
2026-06-04days on market $359,000 Active 177 DOM
-
2026-06-03days on market $359,000 Active 176 DOM
-
2026-06-02days on market $359,000 Active 175 DOM
-
2026-06-01days on market $359,000 Active 174 DOM
-
2026-05-31days on market $359,000 Active 173 DOM
-
2026-03-27status Active
-
2026-03-20historical Active Under Contract
-
2026-03-12status Active
-
2026-02-11historical Active Under Contract
-
2025-12-09$359,000 Active
-
2020-06-25soldstatus $225,000
-
2020-06-03soldstatus $225,000 Closed 721-char remark
Show marketing remark (721 chars)
PRICED TO SELL!!!, EXTRA living area, this home has 3 Bedrooms, 2 Full Bathrooms and 1 extra BONUS room that can be converted to a 4th room. 1 Car Garage. UPDATED bathrooms and Kitchen, stainless steel appliances, fans, Ceramic tile throughout, Knockdown Texture Ceilings. Screened rear patio and front porch. No neighbors in the back. Maintenance Includes pest control, lawn care, exterior paint, minor plumbing and electrical repairs, and cable, and also your roof is taken care of. Community offers 2 pools, tennis, entertainment, Bus route, fitness center and more amenities. Located in one of the Best Adult Communities (55+) in Broward, close to Shopping Centers. Association requires:1 owner must be 55+, 20% down.
-
2020-03-12status Pending 721-char remark
Show marketing remark (721 chars)
PRICED TO SELL!!!, EXTRA living area, this home has 3 Bedrooms, 2 Full Bathrooms and 1 extra BONUS room that can be converted to a 4th room. 1 Car Garage. UPDATED bathrooms and Kitchen, stainless steel appliances, fans, Ceramic tile throughout, Knockdown Texture Ceilings. Screened rear patio and front porch. No neighbors in the back. Maintenance Includes pest control, lawn care, exterior paint, minor plumbing and electrical repairs, and cable, and also your roof is taken care of. Community offers 2 pools, tennis, entertainment, Bus route, fitness center and more amenities. Located in one of the Best Adult Communities (55+) in Broward, close to Shopping Centers. Association requires:1 owner must be 55+, 20% down.
-
2020-03-04$239,900 Active 721-char remark
Show marketing remark (721 chars)
PRICED TO SELL!!!, EXTRA living area, this home has 3 Bedrooms, 2 Full Bathrooms and 1 extra BONUS room that can be converted to a 4th room. 1 Car Garage. UPDATED bathrooms and Kitchen, stainless steel appliances, fans, Ceramic tile throughout, Knockdown Texture Ceilings. Screened rear patio and front porch. No neighbors in the back. Maintenance Includes pest control, lawn care, exterior paint, minor plumbing and electrical repairs, and cable, and also your roof is taken care of. Community offers 2 pools, tennis, entertainment, Bus route, fitness center and more amenities. Located in one of the Best Adult Communities (55+) in Broward, close to Shopping Centers. Association requires:1 owner must be 55+, 20% down.
-
2020-02-22historical
-
2019-08-22$234,900 Active
-
2017-02-13historical
-
2017-02-13status Backup Contract
-
2016-12-06price $217,499
-
2016-09-27status Active
-
2016-09-26historical
-
2016-08-16$219,900 Active
-
2016-07-30historical
-
2016-05-01price $224,900
-
2016-02-09price $227,900
-
2016-02-09price $220,000
-
2015-11-04price $229,900
-
2015-11-03status Active
-
2015-10-10historical
-
2015-08-31$224,000 Active
-
2008-04-07soldstatus $118,000
-
1978-07-01soldstatus $42,300
ⓘ Source: listings_history table (triggers on properties + properties_extension) + one-shot
backfill from property_details.listing_events for pre-trigger history.
Tax reassessment forecast FL · Resets to sale price
- Current annual tax
- $1,170 · $98/mo
- Projected year-2 tax
- $2,980 · $248/mo
- Expected delta
- +$1,809/yr (+$151/mo · 154.6%)
ⓘ Screening estimate from a state-policy table — verify with the county assessor before closing.
Climate risk First Street
- Flood 1/10 Low FEMA zone X (shaded) · 0% chance over 30 yrs
- Wildfire 1/10 Low
- Heat 9/10 Extreme 6 d/yr ≥105°F today · 22 d/yr by 30 yrs out
- Wind 10/10 Extreme 99% chance of damaging wind over 30 yrs
- Air quality 3/10 Moderate 2 unhealthy d/yr today · 3 by 30 yrs out
Nearby sold comps map
Loading sold comps map…
Walkable amenities ~0.75 mi
Loading nearby amenities…
Taxation est. · year 1
- Rental income
- $40,735
- − Mortgage interest
- −$20,110
- − Property taxes
- −$1,170
- − Insurance
- −$1,795
- − Repairs & maintenance
- −$3,259
- − Management
- −$3,259
- − HOA
- −$6,660
- − Depreciation
- −$10,444
- Taxable loss
- −$5,961
- Est. tax savings @ 24.0%
- +$1,431
- After-tax cash flow
- $1,394/yr
For passive investors: Depreciation is non-cash, so a rental often shows a tax loss while cash-flowing — sheltering income. Rental losses are passive: they offset passive income freely, and up to $25,000/yr can offset ordinary (W-2) income if you actively participate and your MAGI is under $100k (phasing out to $0 by $150k); unused losses carry forward. On sale, claimed depreciation is recaptured at up to 25%, and gains may owe capital-gains tax (a 1031 exchange can defer both). Figures are a year-1 estimate at your 24.0% rate — not tax advice; consult a CPA.
Schools (NCES district)
- District
- Broward
- NCES district ID
- 1200180
- Math proficiency
- 42% ▼ -18.00%
- Reading proficiency
- 53% ▼ -5.00%
- Median HH income
- $52,139
- Composite
- 40.88/100
- National rank
- #3621
- State rank
- #46 of 73 in FL
Livability — Plantation
- Score
- 82/100
- State rank
- #70
- US rank
- #1174
Category grades
Schools grade is shown separately in the Schools card above.
Census & demographics
- Census place
- Plantation, FL
- County
- Broward County · 1,963,430 people
- City population
- 111,690
- Metro
- Miami-Fort Lauderdale-Pompano Beach, FL
- Population (ZIP)
- 41,128
- Household income
- $71,755
- Rent vs Own
- Severe rent burden
- 931.0
Population outlook (Broward County) Hauer SSP2
- Today (2025)
- 2,207,033 people
- By 2030
- 2,360,704 · +7.0%
- By 2040
- 2,661,208 · +20.6%
- By 2050
- 2,946,698 · +33.5%
- By 2075
- 3,602,273 · +63.2%
- By 2100
- 3,970,984 · +79.9%
Race, ethnicity, and origin ACS 2023
- Neighborhood character
- Highly diverse neighborhood (Simpson 0.72)
- Race & ethnicity
- Hispanic / Latino 35% White 32% Black 24% Two or more races 22% Asian 4%
- Hispanic origin (detail)
- Puerto Rican 5% Cuban 6% Dominican 2% Salvadoran 1%
- Common ancestry
- Hispanic 5% Romanian 2% Scotch-Irish 2%
- Foreign-born
- 41% · Canada, Jamaica, South Korea
- Languages at home
- 58% English-only · Spanish 30% French/Haitian/Cajun 6% Other Indo-European 1%
Political lean MEDSL · Broward
- 2024 margin
- D (+17.0) · D 58.0% · R 41.0%
- 2008→2024 swing
- -17.8pp toward R · 2008: 34.7pp · 2024: 17.0pp
- All cycles
- 2024: D+17.0 2020: D+29.8 2016: D+35.0 2012: D+34.9 2008: D+34.7
Not yet ingested
- Civics
- —
Market trends
- HPI YoY
- ▼ -203.34%
- Current HPI
- 407.5452
- Rent YoY
- ▲ 0.60%
- Metro
- Miami-Fort Lauderdale-Pompano Beach, FL
- State GDP YoY
- ▲ 3.28%
- F500 in state
- 36
Industry mix (Fortune 500 HQ in FL)
| Industry | F500 HQs | Revenue |
|---|---|---|
| Industrial Technology | 2 | $29B |
|
||
| Insurance | 2 | $17B |
|
||
| Retail | 1 | $60B |
|
||
| Technology Distribution | 1 | $58B |
|
||
| Homebuilding | 1 | $35B |
|
||
| Technology Manufacturing | 1 | $35B |
|
||
Price history
+748.7% since first listed27 events — show timeline
- 2026-03-27 Relisted — Beaches MLS
- 2026-03-20 Contingent — Beaches MLS
- 2026-03-12 Relisted — Beaches MLS
- 2026-02-11 Contingent — Beaches MLS
- 2025-12-09 Listed $359,000 Beaches MLS
- 2020-06-25 Sold (Public Records) $225,000 Public Records
- 2020-06-03 Sold (MLS) $225,000 MARMLS
- 2020-03-12 Pending — MARMLS
- 2020-03-04 Listed $239,900 MARMLS
- 2020-02-22 Listing Removed — MARMLS
- 2019-08-22 Listed $234,900 MARMLS
- 2017-02-13 Listing Removed — MARMLS
- 2017-02-13 Pending — MARMLS
- 2016-12-06 Price Changed $217,499 MARMLS
- 2016-09-27 Relisted — MARMLS
- 2016-09-26 Listing Removed — MARMLS
- 2016-08-16 Listed $219,900 MARMLS
- 2016-07-30 Listing Removed — MARMLS
- 2016-05-01 Price Changed $224,900 MARMLS
- 2016-02-09 Price Changed $220,000 MARMLS
- 2016-02-09 Price Changed $227,900 MARMLS
- 2015-11-04 Price Changed $229,900 MARMLS
- 2015-11-03 Relisted — MARMLS
- 2015-10-10 Listing Removed — MARMLS
- 2015-08-31 Listed $224,000 MARMLS
- 2008-04-07 Sold (Public Records) $118,000 Public Records
- 1978-07-01 Sold (Public Records) $42,300 Public Records
Property tax history
-2.9%/yrLatest (2025): $1,170 · +6.2% YoY. Source: county tax records.
Cash-flow waterfall
monthlySold comps — $/sqft
last 12 mo · ≤1 miLoading sold comps…