 🏷️ Likely Rental
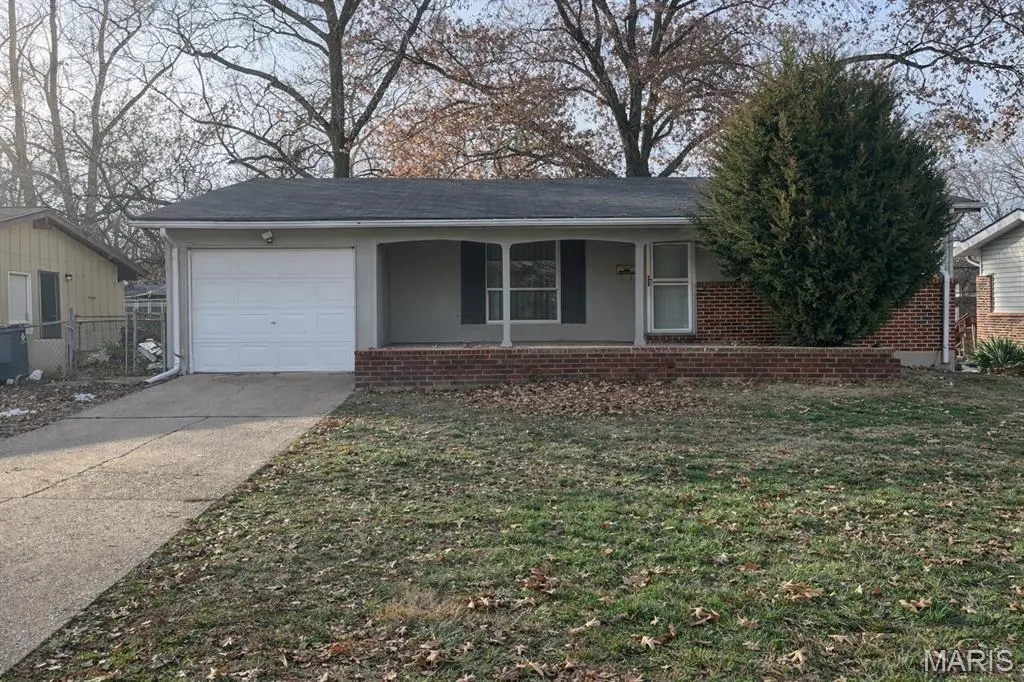
11043 Landseer Dr · Ferguson, MO
Flood risk 8/10 · Major
- FEMA flood zone
- AE
- Chance of flooding over 30 yrs
- 0.79%
- Est. flood insurance / yr
- $2,026 – $9,024
Fire risk 1/10 · Minimal
- Est. fire insurance / yr
- $1,054 – $1,958
Heat risk 5/10 · Moderate
- Hot days now (above 107°F)
- 7 days/yr
- Hot days in 30 yrs
- 21 days/yr
Wind risk 2/10 · Minimal
- Chance of severe wind over 30 yrs
- 1.0%
Air-quality risk 3/10 · Minor
- Unhealthy air days now
- 3 days/yr
- Unhealthy air days in 30 yrs
- 5 days/yr
Risk factors via First Street. Map © Google.
Why this score? — see what drove the B+ grade
The composite is a weighted blend of 9 inputs, each scored 0–100. Each bar is that input's sub-score; the figure is the points it added to the 100-point composite (weight × sub-score).
- Cash flow +27.1/30.0
- ARV discount +15.0/15.0
- DSCR +9.4/10.0
- 1% rule +7.3/10.0
- Appreciation +6.9/10.0
- Rent growth +3.7/5.0
- Livability +2.9/5.0
- Condition / age +2.5/5.0
- Schools +1.7/10.0
$119,000
🖨 Deal sheet 📄 Offer letter ✓ Due diligence
Listing remarks MLS
Section 8 investment with secured income in place. This property is currently rented at $1,105 per month, the resident pays all utilities and the lease is in place through 10/31/2026. A dependable addition to any cash-flow-focused portfolio. Buyer to perform due diligence. Additional photos available upon request.
Key facts
- 7,501 sq ft lot
- Garage
- Built 1962
Neighborhood map
What this means for you Summary
Snapshot
- This is a 3-bed/1.5-bath single-family listed at $119k.
Deal economics
- At list price, monthly cash flow is $-124 ($-1k/yr) — negative.
- To cash-flow at today's rent, offer at most $97k (18.5% below list).
- Meets the 1% rule at list price ($1k rent vs $119k).
- Recommended offer: $97k (18.5% below list) — sets the bar for cash-flow.
Location & tenants
- Location reads 58/100 on livability (#586 in MO) — a working-class tenant base; expect higher turnover. Strengths: cost of living A+, housing B+; Watch: health & safety C-, schools F, crime F.
- Hazelwood (suburban): math 11% / reading 26% proficiency, ranked #306 of 324 in MO (top 94%) — low school quality limits family demand, transient renter base, plan for 1-2y turnover.
- Market conditions: Rents rising fast (+5.0%/yr); 372 active listings in the ZIP; 34 comparable units currently listed for rent nearby; rentals at typical pace (median 24d on market — plan ~3-4 weeks tenant-placement turnaround); lower-income renter base — watch delinquency; 920 units permitted in St. Louis County in 2024 (250 in 5+ unit buildings).
- This rent runs 43% of the median local income ($41k/yr) — at the standard rent-burdened threshold; future hikes will face affordability resistance.
Forward outlook
- In year one you build about $5k of equity ($823 loan paydown + $5k appreciation (3.8% local appreciation)).
- By year 7, paydown + projected appreciation supports a ~$34k cash-out refi (75% LTV) — recoverable capital for the next deal without selling this one.
Negotiation context
- It's been on market 108 days — a 9% lower offer ($108k) is reasonable based on typical stale-listing flexibility.
- 2 sale attempts since 3y ago with the ask held roughly flat each time — persistent listings suggest the price (not the market) is what's stuck; bring a comps-based counter.
Risks & watch-outs
- Watch-outs: flood insurance adds $460/mo.
- Climate carrying-cost: in FEMA flood zone AE (mandatory federal flood insurance); extreme-heat days projected 7→21/yr by 2055 (HVAC capex compounding) — expect insurance premiums to compound above CPI over the hold.
Questions for the listing agent
- What do current leases actually rent for vs. the listed asking? Can we see a recent rent roll and the last 12 months of T-12 income?
- It's been on market 108 days. Have you received any prior offers? Is the seller open to a 18% concession, seller financing, or rate buy-down credit?
- Built in 1962 — when were the roof, HVAC, electrical panel, plumbing, and water heater last replaced?
- What's the actual annual flood-insurance premium (NFIP or private), and is the property in a SFHA with mandatory coverage?
- Why hasn't it sold? Are there any deal-killer items the seller is aware of (foundation, flood, title, zoning, code violations)?
- Is there a deadline driving the sale (1031 exchange, divorce, estate, relocation)? That informs how much negotiation room exists.
- Schools are F-rated, which usually means shorter tenancies and higher turnover. Who's the typical renter profile here, and what's been the actual vacancy rate?
- Crime grade is F in this area — have there been break-ins, vandalism, or insurance claims at this property in the last 3 years? What carrier currently insures it and at what premium?
- What's the average days-on-market for RENTAL listings here right now (not sales)? A rising rental-DOM trend means longer vacancies and softer asking-rent achievability than the comps imply.
- What's the recent tenant-quality profile in this submarket — average credit score on applications, eviction rate, late-payment / NSF rate, and stable-employment percentage? A property-management company in the area should have these aggregated.
- How much new for-sale + rental construction is in the pipeline within 1–3 miles? Heavy new supply typically softens prices + rents 12–24 months out; constrained supply supports both.
Investment metrics
- 1% rule
- 1.23% ✓
- Cap rate
- 9.68%
- Cash-on-cash
- 12.10%
- DSCR
- 1.54
- GRM
- 6.8
CMA / ARV
- ARV (median comp)
- $154,744
- List price
- $119,000
- Delta
- -23.10%
- Verdict
- UNDERPRICED
- Comps
- 20 within 1.0 mi
Show comp detail 12 sales within ~0.75 mi
| Address | Dist | Beds/Ba | Sqft | Sold | Price | $/sf | Match |
|---|---|---|---|---|---|---|---|
| 11100 Landseer Dr | 0.13mi | 3/2.0 | 1,116 (+2%) | 6mo | $187,000 | $168 | 84 |
| 2628 Hadden Dr | 0.20mi | 3/1.5 | 1,052 (-4%) | 8mo | $189,900 | $181 | 78 |
| 2505 Netherton Dr | 0.24mi | 3/1.5 | 1,064 (-3%) | 12mo | $168,000 | $158 | 74 |
| 2515 Linnell Dr | 0.39mi | 2/2.0 (-1) | 1,082 (-1%) | 1mo | $109,900 | $102 | 72 |
| 11030 Worchester Dr | 0.30mi | 3/2.0 | 1,080 (-1%) | 13mo | $179,900 | $167 | 71 |
| 4895 Lockwig Trl | 0.49mi | 3/2.0 | 1,092 (-0%) | 10mo | $124,900 | $114 | 67 |
| 2633 Hadden Dr | 0.24mi | 3/3.0 | 1,164 (+6%) | 7mo | $120,000 | $103 | 66 |
| 2252 Luxmore Dr | 0.33mi | 3/1.5 | 986 (-10%) | 6mo | $59,000 | $60 | 64 |
| 11129 Old Halls Ferry Rd | 0.28mi | 3/1.0 | 1,216 (+11%) | 6mo | $75,000 | $62 | 61 |
| 2018 Elkins Dr | 0.72mi | 3/2.0 | 1,236 (+13%) | 8mo | $174,900 | $142 | 36 |
| 1749 Foley Dr | 0.73mi | 3/1.0 | 936 (-14%) | 6mo | $115,000 | $123 | 35 |
| 10644 Trask Dr | 0.75mi | 3/2.0 | 950 (-13%) | 12mo | $125,000 | $132 | 31 |
Match score weights: distance 35% · size 25% · config 20% · recency 20%. Top-matched comps best support the ARV.
Projected returns pro-forma
3.79% appreciation · 4.97% rent growth · sell at horizon
- IRR
- 7.2%
- Equity multiple
- 1.44×
- Total profit
- $14,713
- Equity at exit
- $58,880
- IRR
- 11.0%
- Equity multiple
- 2.88×
- Total profit
- $62,549
- Equity at exit
- $95,160
Cash invested: $33,320 (down + closing). Projections, not guarantees.
Landlord ↔ Tenant lean methodology
- Overall (STATE)
- 81 Strongly Landlord-Friendly
- State Missouri
- 81 Strongly Landlord-Friendly · R+10
- County
- — inherits STATE
- City
- — inherits STATE
ZIP-level market 63136
- Home prices YoY
- 0.9%
- Rents YoY
- 5.0%
- Active inventory
- 372
- Price-to-rent
- 6.8×
Monthly cashflow live
- Estimated rent
- $1,460 high interval (Pro) →
- Mortgage (P&I)
- −$624
- Tax from tax record
- −$144 /mo · $1,727/yr
- Insurance
- −$50
- Flood insurance flood zone
- −$460 /mo · $5,525/yr
- HOA
- −$0
- Vacancy / Maint / Mgmt
- −$307
- Net cashflow
- $-124
Break-even live
UW: 25.0% down · 7.5% · 30yr · 1.5% tax · 5.0% vac · 8.0% maint · 8.0% mgmt
Financing live
Cash to close
- Down payment
- $29,750
- Closing costs
- $3,570
- Reserves months
- —
- Total cash needed
- —
Loan-product check · same deal, 3 products live
Conventional
25% down · 7.5% · 30yr
- Down + closing
- —
- Monthly P&I
- —
- Monthly cashflow
- —
- DSCR
- —
- Eligible?
- —
Personal DTI + credit; lowest rate.
DSCR
20% down · 8.5% · 30yr
- Down + closing
- —
- Monthly P&I
- —
- Monthly cashflow
- —
- DSCR
- —
- Eligible?
- —
No personal income docs; deal must DSCR.
Hard money
10% down · 12.0% · 12mo
- Down + closing
- —
- Monthly P&I
- —
- Monthly cashflow
- —
- DSCR
- —
- Eligible?
- —
Short-term bridge; refi at stabilization.
Rent comps 34 comps
| Address | Beds | Baths | Sqft | Rent | $/sqft | DOM | Units | Dist |
|---|---|---|---|---|---|---|---|---|
| 2544 Netherton Dr Saint Louis, MO | 3.0 | 2.0 | 1288 | $1,945 | $1.51 | 1d | 1 | 0.14mi |
| 2257 Luxmore Dr Saint Louis, MO | 3.0 | 3.0 | 1073 | $1,495 | $1.39 | 23d | 1 | 0.28mi |
| 2745 Rottingdean Dr St. Louis, MO | 1.0–2.0 | 1.0 | 825 | $975 | $1.18 | 43d | 1 | 0.37mi |
| 2259 Ainsworth Dr Saint Louis, MO | 4.0 | 2.0 | 1500 | $1,776 | $1.18 | 43d | 1 | 0.47mi |
| 11470 Latonka Trl Florissant, MO | 1.0–2.0 | 1.0 | 843 | $1,050 | $1.25 | 43d | 3 | 0.75mi |
| 13061 Lord Dr St. Louis, MO | 2.0 | 1.0 | 900 | $1,040 | $1.16 | 21d | 1 | 0.86mi |
| 10504 Baron Dr Saint Louis, MO | 3.0 | 1.0 | 1000 | $1,300 | $1.30 | 7d | 1 | 0.90mi |
| 11635 Hazeloak Dr Black Jack, MO | 3.0 | 2.0 | 1124 | $1,728 | $1.54 | 17d | 1 | 0.91mi |
| 10512 Count Dr Saint Louis, MO | 3.0 | 1.0 | 888 | $1,195 | $1.35 | 14d | 1 | 0.92mi |
| 62 Capitol Hill Dr Saint Louis, MO | 3.0 | 2.0 | 1239 | $1,250 | $1.01 | 43d | 1 | 0.93mi |
| 10501 Duke Dr Saint Louis, MO | 2.0 | 1.0 | 1140 | $1,090 | $0.96 | 43d | 1 | 1.03mi |
| 10409 Count Dr Saint Louis, MO | 3.0 | 1.0 | 912 | $1,100 | $1.21 | 21d | 1 | 1.03mi |
| 11321 Amboy Ln Saint Louis, MO | 3.0 | 3.0 | 1182 | $1,756 | $1.49 | 1d | 1 | 1.05mi |
| 10557 Castle Dr Saint Louis, MO | 3.0 | 2.0 | 1023 | $1,300 | $1.27 | 14d | 1 | 1.07mi |
| 4872 Bristol Rock Rd Black Jack, MO | 4.0 | 2.0 | 1448 | $2,061 | $1.42 | 2d | 1 | 1.08mi |
| 10322 Monarch Dr Saint Louis, MO | 3.0 | 2.0 | 1073 | $1,728 | $1.61 | 23d | 1 | 1.09mi |
| 10365 Lord Dr Saint Louis, MO | 3.0 | 1.0 | 864 | $1,075 | $1.24 | 2d | 1 | 1.09mi |
| 10239 Green Valley Dr Saint Louis, MO | 3.0 | 1.0 | 1014 | $1,395 | $1.38 | 23d | 1 | 1.10mi |
| 10404 Earl Dr Saint Louis, MO | 2.0 | 1.0 | 770 | $1,100 | $1.43 | 4d | 1 | 1.11mi |
| 10441 Prince Dr Saint Louis, MO | 4.0 | 1.5 | 1380 | $1,380 | $1.00 | 43d | 1 | 1.14mi |
| 10421 Prince Dr Saint Louis, MO | 3.0 | 2.0 | 1023 | $1,275 | $1.25 | 23d | 1 | 1.18mi |
| 10304 Bon Oak Dr Saint Louis, MO | 3.0 | 1.5 | 1500 | $1,250 | $0.83 | 43d | 1 | 1.18mi |
| 10129 Cavalier Ct Saint Louis, MO | 3.0 | 1.5 | 912 | $1,250 | $1.37 | 23d | 1 | 1.30mi |
| 10128 Cloverdale Dr Saint Louis, MO | 2.0 | 1.0 | 792 | $1,000 | $1.26 | 23d | 1 | 1.33mi |
| 10128 Cloverdale Dr Saint Louis, MO | 2.0 | 1.0 | 792 | $1,000 | $1.26 | 43d | 1 | 1.33mi |
| 10124 Winkler Dr Saint Louis, MO | 2.0 | 1.0 | 792 | $1,400 | $1.77 | 3d | 1 | 1.37mi |
| 10113 Count Dr Saint Louis, MO | 2.0 | 1.0 | 882 | $775 | $0.88 | 43d | 1 | 1.41mi |
| 10329 Chesley Dr Saint Louis, MO | 3.0 | 1.0 | 1014 | $1,350 | $1.33 | 23d | 1 | 1.42mi |
| 1547 Babcock Dr Saint Louis, MO | 3.0 | 1.0 | 1014 | $1,480 | $1.46 | 43d | 1 | 1.42mi |
| 10112 Count Dr Saint Louis, MO | 2.0 | 1.0 | 792 | $1,000 | $1.26 | 7d | 1 | 1.42mi |
| 10078 Green Valley Dr Saint Louis, MO | 3.0 | 1.0 | 900 | $1,325 | $1.47 | 7d | 1 | 1.43mi |
| 11592 Las Ladera Dr Florissant, MO | 3.0 | 2.0 | 986 | $1,616 | $1.64 | 7d | 1 | 1.44mi |
| 10139 Royal Dr Saint Louis, MO | 2.0 | 1.0 | 1016 | $900 | $0.89 | 43d | 1 | 1.47mi |
| 10113 Duke Dr Saint Louis, MO | 3.0 | 1.0 | 770 | $1,325 | $1.72 | 43d | 1 | 1.48mi |
Listing history 7 events
-
2026-05-31days on market $119,000 Active 108 DOM
-
2026-04-13price $119,000 315-char remark
Show marketing remark (315 chars)
Section 8 investment with secured income in place. This property is currently rented at $1,105 per month, the resident pays all utilities and the lease is in place through 10/31/2026. A dependable addition to any cash-flow-focused portfolio. Buyer to perform due diligence. Additional photos available upon request.
-
2026-02-12$124,000 Active 315-char remark
Show marketing remark (315 chars)
Section 8 investment with secured income in place. This property is currently rented at $1,105 per month, the resident pays all utilities and the lease is in place through 10/31/2026. A dependable addition to any cash-flow-focused portfolio. Buyer to perform due diligence. Additional photos available upon request.
-
2024-04-05soldstatus Closed 635-char remark
Show marketing remark (635 chars)
This property is part of a 7-single family home portfolio - 1695 Crowder Dr. Florissant MO 63031; 324 N. Floridale Ave, St. Louis MO 63135; 330 N. Floridale Ave. St. Louis MO 63135, 1917 Hildred Ave. St. Louis MO 63136, 11043 Landseer Dr. St. Louis MO 63136, 836 Marias Dr. St. Louis MO 63137, 3012 Solway Ave. St. Louis MO 63136. Each home has its own list price or list price for the entire bundle is $612,000. No sign in yard. Please do not disturb tenants. No showings permitted prior to accepted contract. Home is being sold As Is; seller to do no repairs or inspections of any kind. Must submit offers on Special Sales Contract.
-
2024-02-08status Pending 635-char remark
Show marketing remark (635 chars)
This property is part of a 7-single family home portfolio - 1695 Crowder Dr. Florissant MO 63031; 324 N. Floridale Ave, St. Louis MO 63135; 330 N. Floridale Ave. St. Louis MO 63135, 1917 Hildred Ave. St. Louis MO 63136, 11043 Landseer Dr. St. Louis MO 63136, 836 Marias Dr. St. Louis MO 63137, 3012 Solway Ave. St. Louis MO 63136. Each home has its own list price or list price for the entire bundle is $612,000. No sign in yard. Please do not disturb tenants. No showings permitted prior to accepted contract. Home is being sold As Is; seller to do no repairs or inspections of any kind. Must submit offers on Special Sales Contract.
-
2023-10-30price $120,000 635-char remark
Show marketing remark (635 chars)
This property is part of a 7-single family home portfolio - 1695 Crowder Dr. Florissant MO 63031; 324 N. Floridale Ave, St. Louis MO 63135; 330 N. Floridale Ave. St. Louis MO 63135, 1917 Hildred Ave. St. Louis MO 63136, 11043 Landseer Dr. St. Louis MO 63136, 836 Marias Dr. St. Louis MO 63137, 3012 Solway Ave. St. Louis MO 63136. Each home has its own list price or list price for the entire bundle is $612,000. No sign in yard. Please do not disturb tenants. No showings permitted prior to accepted contract. Home is being sold As Is; seller to do no repairs or inspections of any kind. Must submit offers on Special Sales Contract.
-
2023-08-09$125,000 Active 635-char remark
Show marketing remark (635 chars)
This property is part of a 7-single family home portfolio - 1695 Crowder Dr. Florissant MO 63031; 324 N. Floridale Ave, St. Louis MO 63135; 330 N. Floridale Ave. St. Louis MO 63135, 1917 Hildred Ave. St. Louis MO 63136, 11043 Landseer Dr. St. Louis MO 63136, 836 Marias Dr. St. Louis MO 63137, 3012 Solway Ave. St. Louis MO 63136. Each home has its own list price or list price for the entire bundle is $612,000. No sign in yard. Please do not disturb tenants. No showings permitted prior to accepted contract. Home is being sold As Is; seller to do no repairs or inspections of any kind. Must submit offers on Special Sales Contract.
ⓘ Source: listings_history table (triggers on properties + properties_extension) + one-shot
backfill from property_details.listing_events for pre-trigger history.
Tax reassessment forecast MO · Resets to sale price
- Current annual tax
- $1,727 · $144/mo
- Projected year-2 tax
- $1,727 · $144/mo
- Expected delta
- $0/yr ($0/mo · 0.0%)
ⓘ Screening estimate from a state-policy table — verify with the county assessor before closing.
Climate risk First Street
- Flood 8/10 Severe FEMA zone AE · 79% chance over 30 yrs
- Wildfire 1/10 Low
- Heat 5/10 Major 7 d/yr ≥107°F today · 21 d/yr by 30 yrs out
- Wind 2/10 Low 100% chance of damaging wind over 30 yrs
- Air quality 3/10 Moderate 3 unhealthy d/yr today · 5 by 30 yrs out
Nearby sold comps map
Loading sold comps map…
Walkable amenities ~0.75 mi
Loading nearby amenities…
Taxation est. · year 1
- Rental income
- $17,522
- − Mortgage interest
- −$6,666
- − Property taxes
- −$1,727
- − Insurance
- −$6,120
- − Repairs & maintenance
- −$1,402
- − Management
- −$1,402
- − Depreciation
- −$3,462
- Taxable loss
- −$3,256
- Est. tax savings @ 24.0%
- +$781
- After-tax cash flow
- $-712/yr
For passive investors: Depreciation is non-cash, so a rental often shows a tax loss while cash-flowing — sheltering income. Rental losses are passive: they offset passive income freely, and up to $25,000/yr can offset ordinary (W-2) income if you actively participate and your MAGI is under $100k (phasing out to $0 by $150k); unused losses carry forward. On sale, claimed depreciation is recaptured at up to 25%, and gains may owe capital-gains tax (a 1031 exchange can defer both). Figures are a year-1 estimate at your 24.0% rate — not tax advice; consult a CPA.
Schools (NCES district)
- District
- Hazelwood
- NCES district ID
- 2913830
- Math proficiency
- 11% ▼ -13.00%
- Reading proficiency
- 26% ▼ -6.00%
- Median HH income
- $51,621
- Composite
- 16.77/100
- National rank
- #9156
- State rank
- #306 of 324 in MO
Livability — Ferguson
- Score
- 58/100
- State rank
- #586
- US rank
- #20809
Category grades
Schools grade is shown separately in the Schools card above.
Census & demographics
- County
- Saint Louis County · 888,823 people
- City population
- 18,381
- Metro
- St. Louis, MO-IL
- Population (ZIP)
- 40,929
- Household income
- $41,154
- Rent vs Own
- Severe rent burden
- 3085.0
Population outlook (St. Louis County) Hauer SSP2
- Today (2025)
- 1,025,227 people
- By 2030
- 1,028,023 · +0.3%
- By 2040
- 1,020,940 · -0.4%
- By 2050
- 1,007,280 · -1.8%
- By 2075
- 987,277 · -3.7%
- By 2100
- 921,984 · -10.1%
Race, ethnicity, and origin ACS 2023
- Neighborhood character
- Predominantly Black (90%)
- Race & ethnicity
- Black 90% White 5% Two or more races 3%
- Foreign-born
- 1% · Canada
Political lean MEDSL · St. Louis
- 2024 margin
- Strong D (+23.4) · D 60.8% · R 37.4% · Other 1.7%
- 2008→2024 swing
- +3.5pp toward D · 2008: 19.9pp · 2024: 23.4pp
- All cycles
- 2024: D+23.4 2020: D+24.0 2016: D+16.2 2012: D+13.7 2008: D+19.9
Not yet ingested
- Civics
- —
Market trends
- HPI YoY
- ▲ 3.79%
- Current HPI
- 420.28
- Rent YoY
- ▲ 4.97%
- Metro
- St. Louis, MO-IL
- State GDP YoY
- ▲ 1.84%
- F500 in state
- 20
Industry mix (Fortune 500 HQ in MO)
| Industry | F500 HQs | Revenue |
|---|---|---|
| Healthcare | 1 | $163B |
|
||
| Insurance | 1 | $21B |
|
||
| Industrial Technology | 1 | $17B |
|
||
| Retail | 1 | $16B |
|
||
| Industrial Distribution | 1 | $10B |
|
||
| Utilities | 1 | $9B |
|
||
Price history
-4.8% since first listed6 events — show timeline
- 2026-04-13 Price Changed $119,000 MARIS as Distributed by MLS Grid
- 2026-02-12 Listed $124,000 MARIS as Distributed by MLS Grid
- 2024-04-05 Sold (MLS) — MARIS as Distributed by MLS Grid
- 2024-02-08 Pending — MARIS as Distributed by MLS Grid
- 2023-10-30 Price Changed $120,000 MARIS as Distributed by MLS Grid
- 2023-08-09 Listed $125,000 MARIS as Distributed by MLS Grid
Property tax history
+0.8%/yrLatest (2022): $1,727 · +5.6% YoY. Source: county tax records.
Cash-flow waterfall
monthlySold comps — $/sqft
last 12 mo · ≤1 miLoading sold comps…