6665 Long Bch · Long Beach, CA
Flood risk 5/10 · Moderate
- FEMA flood zone
- X
- Chance of flooding over 30 yrs
- 0.24%
- Est. flood insurance / yr
- $507 – $1,088
Fire risk 1/10 · Minimal
- Est. fire insurance / yr
- $659 – $1,223
Heat risk 4/10 · Minor
- Hot days now (above 90°F)
- 7 days/yr
- Hot days in 30 yrs
- 21 days/yr
Wind risk 1/10 · Minimal
- Chance of severe wind over 30 yrs
- —
Air-quality risk 6/10 · Moderate
- Unhealthy air days now
- 10 days/yr
- Unhealthy air days in 30 yrs
- 10 days/yr
Risk factors via First Street. Map © Google.
Why this score? — see what drove the B- grade
The composite is a weighted blend of 9 inputs, each scored 0–100. Each bar is that input's sub-score; the figure is the points it added to the 100-point composite (weight × sub-score).
- Cash flow +29.6/30.0
- DSCR +10.0/10.0
- 1% rule +8.3/10.0
- ARV discount +7.5/15.0
- Condition / age +4.0/5.0
- Schools +3.7/10.0
- Livability +3.4/5.0
- Rent growth +3.0/5.0
- Appreciation +0.0/10.0
$159,000
🖨 Deal sheet 📄 Offer letter ✓ Due diligence
Listing remarks MLS
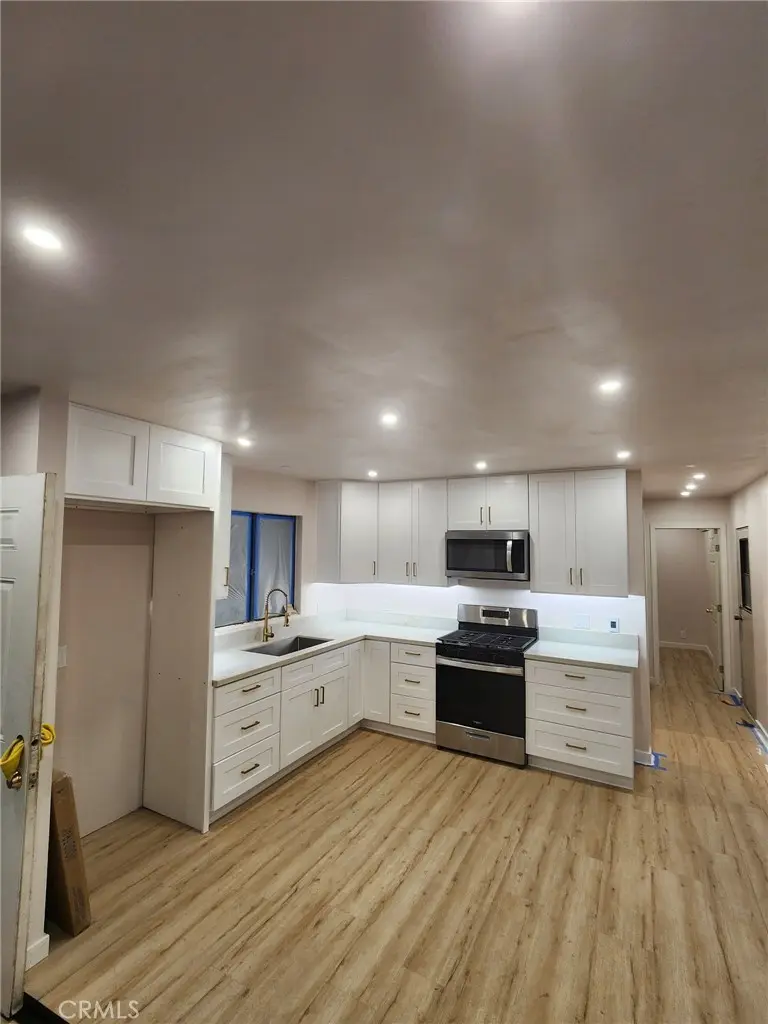
6665 Long Beach Blvd. Unit #J12. Beautifully remodeled 2 Bedroom, 2 Bath Home. Move-in ready. Modern home, featuring an open floor plan perfect for your enjoyment! Enjoy a brand-new kitchen with new cabinetry, and upgraded finishes. New plank flooring throughout the whole home. Mini split A/C in every room for those summer days. Fresh new paint exterior and interior of the home. Two parking spaces which is a big plus. Enjoy your easy commute because you are minutes from 91 and 710 Freeway. Family park all ages welcome. Must see to appreciate. More Photos to Follow.
Key facts
- 2 parking spots
- Built 1988
- Listed 148 days
Neighborhood map
What this means for you Summary
Snapshot
- This is a 2-bed/2.0-bath manufactured listed at $159k. Condition is rated good.
Deal economics
- At list price, monthly cash flow is $572 ($7k/yr) — positive.
- The deal already cash-flows at list — no discount required.
- Meets the 1% rule at list price ($2k rent vs $159k).
- Recommended offer: $140k (12.0% below list) — sets the bar for market timing.
- Cap rate 10.6% vs local median 1.9% in Long Beach — top-decile yield for the area; either an underpriced asset or a hidden risk that comps aren't pricing in. Stress-test before assuming the spread holds.
Location & tenants
- Location reads 67/100 on livability (#319 in CA) — a middle-class / working-renter tenant base. Strengths: amenities A+, commute A+, employment B+; Watch: health & safety C-, crime F, cost of living F.
- Long Beach Unified (urban): math 34% / reading 50% proficiency, ranked #216 of 517 in CA (top 42%) — families likely to look elsewhere, expect single-tenant / working-renter base with shorter leases.
- Market conditions: Rents rising (+1.9%/yr); 100 active listings in the ZIP; 25 comparable units currently listed for rent nearby; rentals at typical pace (median 21d on market — plan ~3-4 weeks tenant-placement turnaround); 19,697 units permitted in Los Angeles County in 2024 (9,426 in 5+ unit buildings).
- This rent runs 35% of the median local income ($73k/yr) — at the standard rent-burdened threshold; future hikes will face affordability resistance.
Forward outlook
- Local home prices are declining (-3.0%/yr); year-one equity from $1k of loan paydown is wiped out by about $5k of value loss. Plan a longer hold.
- Los Angeles County population projected at +9% by 2050 — modest demand growth; plan on rents tracking national, not racing it.
- At projected returns (-3.0% appreciation + 1.9% rent growth), your $45k cash investment doubles in ~9 years — after that, you're playing with house money.
Negotiation context
- It's been on market 148 days — a 12% lower offer ($140k) is reasonable based on typical stale-listing flexibility.
- 3 sale attempts since 7y ago; this cycle's ask has dropped $11k (6%) from the opening price — seller is motivated, your offer sets the floor, not the list.
Risks & watch-outs
- Climate carrying-cost: moderate flood risk — expect insurance premiums to compound above CPI over the hold.
Questions for the listing agent
- It's been on market 148 days. Have you received any prior offers? Is the seller open to a 12% concession, seller financing, or rate buy-down credit?
- Why hasn't it sold? Are there any deal-killer items the seller is aware of (foundation, flood, title, zoning, code violations)?
- Is there a deadline driving the sale (1031 exchange, divorce, estate, relocation)? That informs how much negotiation room exists.
- Crime grade is F in this area — have there been break-ins, vandalism, or insurance claims at this property in the last 3 years? What carrier currently insures it and at what premium?
- What's the average days-on-market for RENTAL listings here right now (not sales)? A rising rental-DOM trend means longer vacancies and softer asking-rent achievability than the comps imply.
- What's the recent tenant-quality profile in this submarket — average credit score on applications, eviction rate, late-payment / NSF rate, and stable-employment percentage? A property-management company in the area should have these aggregated.
- How much new for-sale + rental construction is in the pipeline within 1–3 miles? Heavy new supply typically softens prices + rents 12–24 months out; constrained supply supports both.
Investment metrics
- 1% rule
- 1.33% ✓
- Cap rate
- 10.61%
- Cash-on-cash
- 15.41%
- DSCR
- 1.69
- GRM
- 6.3
CMA / ARV
- ARV (median comp)
- $98,521
- List price
- $159,000
- Delta
- 61.39%
- Verdict
- OVERPRICED
- Comps
- 3 within 2.0 mi
Show comp detail 2 sales within ~0.75 mi
| Address | Dist | Beds/Ba | Sqft | Sold | Price | $/sf | Match |
|---|---|---|---|---|---|---|---|
| 6665 Long Beach Blvd Unit J25 | 0.00mi | 3/1.0 (+1) | 1,056 (+10%) | 8mo | $144,000 | $136 | 67 |
| 6665 Long Beach Blvd Spc D3 | 0.05mi | 3/1.0 (+1) | 832 (-13%) | 15mo | $110,000 | $132 | 54 |
Match score weights: distance 35% · size 25% · config 20% · recency 20%. Top-matched comps best support the ARV.
Projected returns pro-forma
-3.0% appreciation · 1.95% rent growth · sell at horizon
- IRR
- 5.0%
- Equity multiple
- 1.19×
- Total profit
- $8,463
- Equity at exit
- $23,707
- IRR
- 13.4%
- Equity multiple
- 2.02×
- Total profit
- $45,496
- Equity at exit
- $13,747
Cash invested: $44,520 (down + closing). Projections, not guarantees.
Landlord ↔ Tenant lean methodology
- Overall (STATE)
- 18 Strongly Tenant-Friendly
- State California
- 18 Strongly Tenant-Friendly · D+13
- County
- — inherits STATE
- City
- — inherits STATE
ZIP-level market 90805
- Rents YoY
- 1.9%
- Active inventory
- 100
- Price-to-rent
- 6.3×
Monthly cashflow live
- Estimated rent
- $2,114 high interval (Pro) →
- Mortgage (P&I)
- −$834
- Tax est. 1.5%
- −$199 /mo · $2,385/yr
- Insurance
- −$66
- HOA
- −$0
- Vacancy / Maint / Mgmt
- −$444
- Net cashflow
- $572
Break-even live
UW: 25.0% down · 7.5% · 30yr · 1.5% tax · 5.0% vac · 8.0% maint · 8.0% mgmt
Financing live
Cash to close
- Down payment
- $39,750
- Closing costs
- $4,770
- Reserves months
- —
- Total cash needed
- —
Loan-product check · same deal, 3 products live
Conventional
25% down · 7.5% · 30yr
- Down + closing
- —
- Monthly P&I
- —
- Monthly cashflow
- —
- DSCR
- —
- Eligible?
- —
Personal DTI + credit; lowest rate.
DSCR
20% down · 8.5% · 30yr
- Down + closing
- —
- Monthly P&I
- —
- Monthly cashflow
- —
- DSCR
- —
- Eligible?
- —
No personal income docs; deal must DSCR.
Hard money
10% down · 12.0% · 12mo
- Down + closing
- —
- Monthly P&I
- —
- Monthly cashflow
- —
- DSCR
- —
- Eligible?
- —
Short-term bridge; refi at stabilization.
Rent comps 25 comps
| Address | Beds | Baths | Sqft | Rent | $/sqft | DOM | Units | Dist |
|---|---|---|---|---|---|---|---|---|
| 6624 Delta Ave Long Beach, CA | 1.0 | 1.0 | 600 | $1,595 | $2.66 | 25d | 1 | 0.18mi |
| 6843 Delta Ave Long Beach, CA | 2.0 | 1.0 | 600 | $2,600 | $4.33 | 44d | 1 | 0.28mi |
| 169 E 68th Way Unit 1 Long Beach, CA | 2.0 | 1.0 | 610 | $2,400 | $3.93 | 25d | 1 | 0.29mi |
| 171 1/2 E 68th Way Long Beach, CA | 2.0 | 1.0 | 610 | $2,400 | $3.93 | 25d | 1 | 0.29mi |
| 221 E Artesia Blvd Long Beach, CA | 1.0 | 1.0 | 600 | $1,750 | $2.92 | 4d | 1 | 0.32mi |
| 10 W Trafford St Long Beach, CA | 1.0 | 1.0 | 800 | $1,800 | $2.25 | 44d | 1 | 0.57mi |
| 1119 S Chester Ave Unit 1119 Compton, CA | 1.0 | 1.0 | 650 | $1,695 | $2.61 | 7d | 1 | 0.88mi |
| 6479 Atlantic Ave Long Beach, CA | 1.0 | 1.0 | 526 | $1,838 | $3.49 | 3d | 5 | 1.11mi |
| 713 E Cocoa St Unit 713 Compton, CA | 2.0 | 1.0 | 825 | $2,200 | $2.67 | 21d | 1 | 1.13mi |
| 713 E Cocoa St Unit 713 Compton, CA | 2.0 | 1.0 | 825 | $2,200 | $2.67 | 44d | 1 | 1.13mi |
| 713 E Cocoa St Unit 713 Compton, CA | 2.0 | 1.0 | 825 | $2,200 | $2.67 | 25d | 1 | 1.13mi |
| 454 E 63rd St Long Beach, CA | 1.0 | 1.0 | 630 | $2,300 | $3.65 | 19d | 1 | 1.14mi |
| 147 E 59th St Unit 147 A Long Beach, CA | 2.0 | 2.0 | 740 | $2,650 | $3.58 | 4d | 1 | 1.15mi |
| 6067 Jaymills Ave Long Beach, CA | 2.0 | 1.0 | 781 | $2,300 | $2.94 | 44d | 1 | 1.20mi |
| 500 E Poppy St Long Beach, CA | 1.0 | 1.0 | 551 | $1,875 | $3.40 | 15d | 1 | 1.23mi |
| 409 S Harris Ave Unit 409 Compton, CA | 3.0 | 1.0 | 920 | $2,495 | $2.71 | 44d | 1 | 1.23mi |
| 6175 Linden Ave Long Beach, CA | 1.0 | 1.0 | 562 | $1,795 | $3.19 | 10d | 1 | 1.24mi |
| 6151 Linden Ave Long Beach, CA | 1.0 | 1.0 | 538 | $1,795 | $3.34 | 44d | 1 | 1.25mi |
| 15327 S Butler Ave Compton, CA | 2.0 | 1.0 | 716 | $2,875 | $4.02 | 2d | 1 | 1.28mi |
| 195 E Hullett St Long Beach, CA | 3.0 | 1.0 | 725 | $2,595 | $3.58 | 17d | 1 | 1.29mi |
| 247 E Hullett St Unit 8 Long Beach, CA | 1.0 | 1.0 | 750 | $1,895 | $2.53 | 25d | 1 | 1.32mi |
| 77 E Ellis St Unit 79 Long Beach, CA | 1.0 | 1.0 | 700 | $1,850 | $2.64 | 11d | 1 | 1.42mi |
| 5960 Linden Ave #1 Long Beach, CA | 2.0 | 1.0 | 800 | $1,995 | $2.49 | 5d | 1 | 1.42mi |
| 5960 Linden Ave Long Beach, CA | 2.0 | 1.0 | 800 | $1,995 | $2.49 | 5d | 1 | 1.42mi |
| 519 S Tamarind Ave Unit 519 Compton, CA | 2.0 | 1.0 | 850 | $2,575 | $3.03 | 25d | 1 | 1.45mi |
Listing history 21 events
-
2026-06-18days on market $159,000 Active 148 DOM
-
2026-06-17days on market $159,000 Active 147 DOM
-
2026-06-16days on market $159,000 Active 146 DOM
-
2026-06-15days on market $159,000 Active 145 DOM
-
2026-06-13days on market $159,000 Active 143 DOM
-
2026-06-13days on market $159,000 Active 142 DOM
-
2026-06-09days on market $159,000 Active 139 DOM
-
2026-06-08days on market $159,000 Active 138 DOM
-
2026-06-07days on market $159,000 Active 137 DOM
-
2026-06-04days on market $159,000 Active 134 DOM
-
2026-06-03days on market $159,000 Active 133 DOM
-
2026-06-02days on market $159,000 Active 132 DOM
-
2026-06-01days on market $159,000 Active 131 DOM
-
2026-05-31days on market $159,000 Active 130 DOM
-
2026-04-27price $159,000 571-char remark
Show marketing remark (571 chars)
6665 Long Beach Blvd. Unit #J12. Beautifully remodeled 2 Bedroom, 2 Bath Home. Move-in ready. Modern home, featuring an open floor plan perfect for your enjoyment! Enjoy a brand-new kitchen with new cabinetry, and upgraded finishes. New plank flooring throughout the whole home. Mini split A/C in every room for those summer days. Fresh new paint exterior and interior of the home. Two parking spaces which is a big plus. Enjoy your easy commute because you are minutes from 91 and 710 Freeway. Family park all ages welcome. Must see to appreciate. More Photos to Follow.
-
2026-04-24status Active 571-char remark
Show marketing remark (571 chars)
6665 Long Beach Blvd. Unit #J12. Beautifully remodeled 2 Bedroom, 2 Bath Home. Move-in ready. Modern home, featuring an open floor plan perfect for your enjoyment! Enjoy a brand-new kitchen with new cabinetry, and upgraded finishes. New plank flooring throughout the whole home. Mini split A/C in every room for those summer days. Fresh new paint exterior and interior of the home. Two parking spaces which is a big plus. Enjoy your easy commute because you are minutes from 91 and 710 Freeway. Family park all ages welcome. Must see to appreciate. More Photos to Follow.
-
2026-01-19$170,000 Active 571-char remark
Show marketing remark (571 chars)
6665 Long Beach Blvd. Unit #J12. Beautifully remodeled 2 Bedroom, 2 Bath Home. Move-in ready. Modern home, featuring an open floor plan perfect for your enjoyment! Enjoy a brand-new kitchen with new cabinetry, and upgraded finishes. New plank flooring throughout the whole home. Mini split A/C in every room for those summer days. Fresh new paint exterior and interior of the home. Two parking spaces which is a big plus. Enjoy your easy commute because you are minutes from 91 and 710 Freeway. Family park all ages welcome. Must see to appreciate. More Photos to Follow.
-
2026-01-14historical $170,000 571-char remark
Show marketing remark (571 chars)
6665 Long Beach Blvd. Unit #J12. Beautifully remodeled 2 Bedroom, 2 Bath Home. Move-in ready. Modern home, featuring an open floor plan perfect for your enjoyment! Enjoy a brand-new kitchen with new cabinetry, and upgraded finishes. New plank flooring throughout the whole home. Mini split A/C in every room for those summer days. Fresh new paint exterior and interior of the home. Two parking spaces which is a big plus. Enjoy your easy commute because you are minutes from 91 and 710 Freeway. Family park all ages welcome. Must see to appreciate. More Photos to Follow.
-
2019-09-19historical
-
2019-09-03price $189,997
-
2019-08-19$205,000 Active
ⓘ Source: listings_history table (triggers on properties + properties_extension) + one-shot
backfill from property_details.listing_events for pre-trigger history.
Climate risk First Street
- Flood 5/10 Major FEMA zone X · 24% chance over 30 yrs
- Wildfire 1/10 Low
- Heat 4/10 Moderate 7 d/yr ≥90°F today · 21 d/yr by 30 yrs out
- Wind 1/10 Low
- Air quality 6/10 Major 10 unhealthy d/yr today · 10 by 30 yrs out
Nearby sold comps map
Loading sold comps map…
Walkable amenities ~0.75 mi
Loading nearby amenities…
Taxation est. · year 1
- Rental income
- $25,374
- − Mortgage interest
- −$8,906
- − Property taxes
- −$2,385
- − Insurance
- −$795
- − Repairs & maintenance
- −$2,030
- − Management
- −$2,030
- − Depreciation
- −$4,625
- Taxable income
- $4,602
- Est. tax owed @ 24.0%
- −$1,104
- After-tax cash flow
- $5,755/yr
For passive investors: Depreciation is non-cash, so a rental often shows a tax loss while cash-flowing — sheltering income. Rental losses are passive: they offset passive income freely, and up to $25,000/yr can offset ordinary (W-2) income if you actively participate and your MAGI is under $100k (phasing out to $0 by $150k); unused losses carry forward. On sale, claimed depreciation is recaptured at up to 25%, and gains may owe capital-gains tax (a 1031 exchange can defer both). Figures are a year-1 estimate at your 24.0% rate — not tax advice; consult a CPA.
Condition & rehab AI · 11 photos
This beautifully remodeled 2-bedroom, 2-bath home is move-in ready with modern finishes and a fresh paint job. It offers a good condition score and is ready for a new owner or tenant.
Value-add opportunities
- Both Landscaping and curb appeal improvements — Enhances curb appeal and could attract more buyers
- Both Add smart home features — Improves convenience and could increase rental value
- Both Add a smart thermostat — Improves comfort and energy efficiency
Renovation cost estimate screening
Value-add ROI direction
- Both Landscaping and curb appeal improvements — Enhances curb appeal and could attract more buyers ↑
- Both Add smart home features — Improves convenience and could increase rental value ↑
- Both Add a smart thermostat — Improves comfort and energy efficiency ↑
ⓘ Cost ranges are severity-bucket heuristics (US national rule-of-thumb). Get contractor quotes + a written scope before underwriting a rehab budget.
Schools (NCES district)
- District
- Long Beach Unified
- NCES district ID
- 0622500
- Math proficiency
- 34% ▼ -11.00%
- Reading proficiency
- 50% ▼ -4.00%
- Median HH income
- $56,092
- Composite
- 36.67/100
- National rank
- #4607
- State rank
- #216 of 517 in CA
Livability — Long Beach
- Score
- 67/100
- State rank
- #319
- US rank
- #10758
Category grades
Schools grade is shown separately in the Schools card above.
Census & demographics
- Census place
- Long Beach, CA
- County
- Los Angeles County · 9,444,647 people
- City population
- 466,088
- Metro
- Los Angeles-Long Beach-Anaheim, CA
- Population (ZIP)
- 92,402
- Household income
- $73,415
- Rent vs Own
- Severe rent burden
- 4834.0
Population outlook (Los Angeles County) Hauer SSP2
- Today (2025)
- 10,940,515 people
- By 2030
- 11,256,481 · +2.9%
- By 2040
- 11,729,929 · +7.2%
- By 2050
- 11,948,407 · +9.2%
- By 2075
- 11,818,114 · +8.0%
- By 2100
- 10,842,928 · -0.9%
Race, ethnicity, and origin ACS 2023
- Neighborhood character
- Diverse neighborhood (Simpson 0.60)
- Race & ethnicity
- Hispanic / Latino 59% Black 18% Two or more races 16% Asian 11% White 8% Native American 2%
- Hispanic origin (detail)
- Mexican 48%
- Common ancestry
- Lithuanian 1% Slovak 1%
- Foreign-born
- 30% · Canada, Vietnam
- Languages at home
- 41% English-only · Spanish 49% Other Asian/Pacific 5% Tagalog/Filipino 2%
Political lean MEDSL · Los Angeles
- 2024 margin
- Solid D (+32.9) · D 64.8% · R 31.9% · Other 3.3%
- 2008→2024 swing
- -7.4pp toward R · 2008: 40.4pp · 2024: 32.9pp
- All cycles
- 2024: D+32.9 2020: D+44.2 2016: D+48.0 2012: D+40.0 2008: D+40.4
Not yet ingested
- Civics
- —
Market trends
- HPI YoY
- ▼ -817.43%
- Current HPI
- 456.7913
- Rent YoY
- ▲ 1.95%
- Metro
- Los Angeles-Long Beach-Anaheim, CA
- State GDP YoY
- ▲ 3.21%
- F500 in state
- 116
Industry mix (Fortune 500 HQ in CA)
| Industry | F500 HQs | Revenue |
|---|---|---|
| Technology | 27 | $1,492B |
|
||
| Financial Services | 3 | $174B |
|
||
| Retail | 3 | $44B |
|
||
| Insurance | 3 | $26B |
|
||
| Media / Entertainment | 2 | $115B |
|
||
| Pharmaceuticals / Biotech | 2 | $62B |
|
||
Price history
-22.4% since first listed7 events — show timeline
- 2026-04-27 Price Changed $159,000 CRMLS
- 2026-04-24 Relisted — CRMLS
- 2026-01-19 Listed $170,000 CRMLS
- 2026-01-14 Coming Soon $170,000 CRMLS
- 2019-09-19 Listing Removed — CRMLS
- 2019-09-03 Price Changed $189,997 CRMLS
- 2019-08-19 Listed $205,000 CRMLS
Property tax history
+7.2%/yrLatest (2025): $302 · +7.2% YoY. Source: county tax records.
Cash-flow waterfall
monthlySold comps — $/sqft
last 12 mo · ≤1 miLoading sold comps…