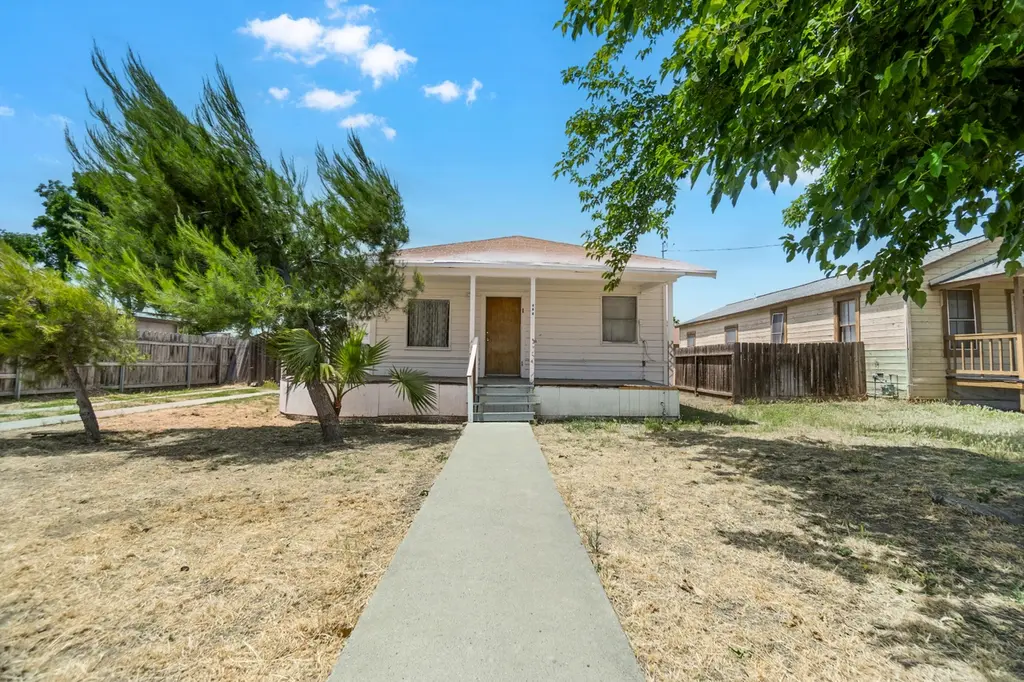
826 Kimball Ln · Hanford, CA
Flood risk 1/10 · Minimal
- FEMA flood zone
- X (unshaded)
- Chance of flooding over 30 yrs
- 0.0%
- Est. flood insurance / yr
- $507 – $1,088
Fire risk 5/10 · Moderate
- Est. fire insurance / yr
- $659 – $1,223
Heat risk 8/10 · Major
- Hot days now (above 105°F)
- 7 days/yr
- Hot days in 30 yrs
- 17 days/yr
Wind risk 1/10 · Minimal
- Chance of severe wind over 30 yrs
- —
Air-quality risk 10/10 · Severe
- Unhealthy air days now
- 31 days/yr
- Unhealthy air days in 30 yrs
- 35 days/yr
Risk factors via First Street. Map © Google.
Why this score? — see what drove the C+ grade
The composite is a weighted blend of 9 inputs, each scored 0–100. Each bar is that input's sub-score; the figure is the points it added to the 100-point composite (weight × sub-score).
- Cash flow +21.1/30.0
- ARV discount +15.0/15.0
- DSCR +6.7/10.0
- 1% rule +4.4/10.0
- Livability +3.8/5.0
- Schools +3.6/10.0
- Rent growth +3.2/5.0
- Condition / age +2.5/5.0
- Appreciation +0.0/10.0
$184,900
🖨 Deal sheet 📄 Offer letter ✓ Due diligence
Listing remarks
Rare Cottage/Bungalow fixer-upper opportunity in one of Hanford's most desirable neighborhoods! This 3-bedroom, 1-bath home is full of potential and located directly across from beautiful newer construction homes. Featuring an open floor plan, high ceilings, and a spacious lot, this property is the perfect canvas for an investor or buyer looking to add their personal touch. Conveniently located near freeway access, shopping, schools, restaurants, and new developments. Don't miss this incredible opportunity to transform this charming home into something special!
Key facts
- Near schools
- Open floor plan
- Near shopping
Tags
Property features AI
Exterior
- Parking: Driveway with space for 3 open vehicles
- Utilities: Public water; Public sewer; Natural gas available and connected; Electricity connected; Water connected
- Home design: Single-family residence; East-facing; Single-story; Fixer condition
- Construction: Wood siding; Shingle roof; Other foundation; Built on a 0.17-acre lot (approx. 53.56 x 138.85)
- Exterior features: Fenced backyard; Concrete road frontage on a city street; Publicly maintained road; Has a view
Interior
- Kitchen: Gas range
- Bathrooms: One three-quarter bathroom
- Heating & cooling: Natural gas heating; Window air conditioning units
- Interior features: Gas range; Wood-burning fireplace in the living room and dining room
Neighborhood map
What this means for you Summary
Snapshot
- This is a 3-bed/1.0-bath single-family listed at $185k.
Deal economics
- At list price, monthly cash flow is $265 ($3k/yr) — positive.
- The deal already cash-flows at list — no discount required.
- To meet the 1% rule (rent ≥ 1% of price), the offer needs to be $173k (6.4% below list).
- Recommended offer: $173k (6.4% below list) — sets the bar for 1% rule.
- Cap rate 8.0% vs local median 3.9% in Hanford — top-decile yield for the area; either an underpriced asset or a hidden risk that comps aren't pricing in. Stress-test before assuming the spread holds.
Location & tenants
- Location reads 75/100 on livability (#121 in CA, #4,255 nationally) — a middle-class / working-renter tenant base. Strengths: commute A+, housing A+, amenities B; Watch: crime D+, health & safety D+, cost of living F.
- Hanford Joint Union High (urban): math 20% / reading 58% proficiency, ranked #765 of 1,400 in CA (top 55%) — families likely to look elsewhere, expect single-tenant / working-renter base with shorter leases.
- Market conditions: Rents rising (+2.9%/yr); 430 active listings in the ZIP; 5 comparable units currently listed for rent nearby; rentals at typical pace (median 21d on market — plan ~3-4 weeks tenant-placement turnaround); solid renter incomes; 741 units permitted in Kings County in 2024 (307 in 5+ unit buildings).
Forward outlook
- Local home prices are declining (-3.0%/yr); year-one equity from $1k of loan paydown is wiped out by about $6k of value loss. Plan a longer hold.
Negotiation context
- Only 10 days on market — expect competitive offers; lowballing is unlikely to land.
- Current owner paid $155k; 19% above their basis — modest negotiation headroom, anchor on the comps not their cost.
Risks & watch-outs
- Watch-outs: built in 1939 — expect roof / HVAC / electrical / plumbing capex.
- Climate carrying-cost: moderate wildfire risk; extreme-heat days projected 7→17/yr by 2055 (HVAC capex compounding) — expect insurance premiums to compound above CPI over the hold.
Questions for the listing agent
- Built in 1939 — when were the roof, HVAC, electrical panel, plumbing, and water heater last replaced?
- Is there a deadline driving the sale (1031 exchange, divorce, estate, relocation)? That informs how much negotiation room exists.
- Crime grade is D in this area — have there been break-ins, vandalism, or insurance claims at this property in the last 3 years? What carrier currently insures it and at what premium?
- What's the average days-on-market for RENTAL listings here right now (not sales)? A rising rental-DOM trend means longer vacancies and softer asking-rent achievability than the comps imply.
- What's the recent tenant-quality profile in this submarket — average credit score on applications, eviction rate, late-payment / NSF rate, and stable-employment percentage? A property-management company in the area should have these aggregated.
- How much new for-sale + rental construction is in the pipeline within 1–3 miles? Heavy new supply typically softens prices + rents 12–24 months out; constrained supply supports both.
Investment metrics
- 1% rule
- 0.94% ✗
- Cap rate
- 8.01%
- Cash-on-cash
- 6.14%
- DSCR
- 1.27
- GRM
- 8.9
CMA / ARV
- ARV (on-the-fly)
- $240,748
- Comps found
- 8
Show comp detail 8 sales within ~0.75 mi
| Address | Dist | Beds/Ba | Sqft | Sold | Price | $/sf | Match |
|---|---|---|---|---|---|---|---|
| 1215 Washington St | 0.08mi | 2/1.0 (-1) | 816 (-6%) | 1mo | $223,000 | $273 | 81 |
| 821 Lincoln St | 0.26mi | 2/1.0 (-1) | 864 (-0%) | 5mo | $230,000 | $266 | 78 |
| 766 Lincoln St | 0.34mi | 3/1.0 | 875 (+1%) | 6mo | $267,000 | $305 | 77 |
| 1261 State St | 0.29mi | 2/1.0 (-1) | 859 (-1%) | 12mo | $260,000 | $303 | 70 |
| 148 Walnut St | 0.55mi | 2/1.0 (-1) | 828 (-4%) | 5mo | $230,000 | $278 | 58 |
| 669 S 11 1/2 Ave | 0.15mi | 2/1.0 (-1) | 782 (-10%) | 21mo | $145,000 | $185 | 54 |
| 11360 Jones | 0.66mi | 3/2.0 | 940 (+8%) | 22mo | $255,000 | $271 | 33 |
| 1132 W 7th St | 0.69mi | 2/1.0 (-1) | 748 (-14%) | 9mo | $235,000 | $314 | 32 |
Match score weights: distance 35% · size 25% · config 20% · recency 20%. Top-matched comps best support the ARV.
Projected returns pro-forma
-3.0% appreciation · 2.87% rent growth · sell at horizon
- IRR
- -7.0%
- Equity multiple
- 0.74×
- Total profit
- $-13,401
- Equity at exit
- $27,569
- IRR
- 2.4%
- Equity multiple
- 1.17×
- Total profit
- $8,794
- Equity at exit
- $15,987
Cash invested: $51,772 (down + closing). Projections, not guarantees.
Landlord ↔ Tenant lean methodology
- Overall (STATE)
- 18 Strongly Tenant-Friendly
- State California
- 18 Strongly Tenant-Friendly · D+13
- County
- — inherits STATE
- City
- — inherits STATE
ZIP-level market 93230
- Rents YoY
- 2.9%
- Active inventory
- 430
- Price-to-rent
- 8.9×
Monthly cashflow live
- Estimated rent
- $1,731 high interval (Pro) →
- Mortgage (P&I)
- −$970
- Tax from tax record
- −$56 /mo · $668/yr
- Insurance
- −$77
- HOA
- −$0
- Vacancy / Maint / Mgmt
- −$363
- Net cashflow
- $265
Break-even live
UW: 25.0% down · 7.5% · 30yr · 1.5% tax · 5.0% vac · 8.0% maint · 8.0% mgmt
Financing live
Cash to close
- Down payment
- $46,225
- Closing costs
- $5,547
- Reserves months
- —
- Total cash needed
- —
Loan-product check · same deal, 3 products live
Conventional
25% down · 7.5% · 30yr
- Down + closing
- —
- Monthly P&I
- —
- Monthly cashflow
- —
- DSCR
- —
- Eligible?
- —
Personal DTI + credit; lowest rate.
DSCR
20% down · 8.5% · 30yr
- Down + closing
- —
- Monthly P&I
- —
- Monthly cashflow
- —
- DSCR
- —
- Eligible?
- —
No personal income docs; deal must DSCR.
Hard money
10% down · 12.0% · 12mo
- Down + closing
- —
- Monthly P&I
- —
- Monthly cashflow
- —
- DSCR
- —
- Eligible?
- —
Short-term bridge; refi at stabilization.
Rent comps 5 comps
| Address | Beds | Baths | Sqft | Rent | $/sqft | DOM | Units | Dist |
|---|---|---|---|---|---|---|---|---|
| 11116 Kay Ln Hanford, CA | 3.0 | 1.0 | 1008 | $1,700 | $1.69 | 21d | 1 | 0.75mi |
| 824 S Irwin St Hanford, CA | 2.0 | 1.0 | 700 | $1,395 | $1.99 | 13d | 1 | 0.89mi |
| 412 Ford St Unit 2 Hanford, CA | 2.0 | 1.0 | 725 | $1,150 | $1.59 | 21d | 1 | 1.15mi |
| 1012 Rodgers Rd Unit Rodgers-101214 Rodgers Hanford, CA | 2.0 | 1.0 | 650 | $1,050 | $1.62 | 21d | 1 | 1.44mi |
| 201 E 11th St Unit C Hanford, CA | 2.0 | 1.0 | 700 | $1,295 | $1.85 | 21d | 1 | 1.49mi |
Listing history 18 events
-
2026-06-16status $184,900 Pending 10 DOM
-
2026-06-16days on market $184,900 Active 10 DOM
-
2026-06-15days on market $184,900 Active 9 DOM
-
2026-06-14days on market $184,900 Active 7 DOM
-
2026-06-13days on market $184,900 Active 6 DOM
-
2026-06-10days on market $184,900 Active 4 DOM
-
2026-06-09days on market $184,900 Active 3 DOM
-
2026-06-08days on market $184,900 Active 2 DOM
-
2026-06-07remarks 567-char remark
-
2026-06-07pricedays on market $184,900 Active 1 DOM
-
2026-06-05days on market $185,000 Active 13 DOM
-
2026-06-03days on market $185,000 Active 12 DOM
-
2026-06-02days on market $185,000 Active 11 DOM
-
2026-06-01days on market $185,000 Active 10 DOM
-
2026-05-31days on market $185,000 Active 9 DOM
-
2026-05-30pricedays on market $185,000 Active 8 DOM
-
2026-05-22$195,000 Active
-
2026-02-23soldstatus $155,000
ⓘ Source: listings_history table (triggers on properties + properties_extension) + one-shot
backfill from property_details.listing_events for pre-trigger history.
Tax reassessment forecast CA · Resets to sale price
- Current annual tax
- $668 · $56/mo
- Projected year-2 tax
- $1,405 · $117/mo
- Expected delta
- +$738/yr (+$61/mo · 110.5%)
ⓘ Screening estimate from a state-policy table — verify with the county assessor before closing.
Climate risk First Street
- Flood 1/10 Low FEMA zone X (unshaded) · 0% chance over 30 yrs
- Wildfire 5/10 Major
- Heat 8/10 Severe 7 d/yr ≥105°F today · 17 d/yr by 30 yrs out
- Wind 1/10 Low
- Air quality 10/10 Extreme 31 unhealthy d/yr today · 35 by 30 yrs out
Nearby sold comps map
Loading sold comps map…
Walkable amenities ~0.75 mi
Loading nearby amenities…
Taxation est. · year 1
- Rental income
- $20,767
- − Mortgage interest
- −$10,357
- − Property taxes
- −$668
- − Insurance
- −$924
- − Repairs & maintenance
- −$1,661
- − Management
- −$1,661
- − Depreciation
- −$5,379
- Taxable income
- $116
- Est. tax owed @ 24.0%
- −$28
- After-tax cash flow
- $3,150/yr
For passive investors: Depreciation is non-cash, so a rental often shows a tax loss while cash-flowing — sheltering income. Rental losses are passive: they offset passive income freely, and up to $25,000/yr can offset ordinary (W-2) income if you actively participate and your MAGI is under $100k (phasing out to $0 by $150k); unused losses carry forward. On sale, claimed depreciation is recaptured at up to 25%, and gains may owe capital-gains tax (a 1031 exchange can defer both). Figures are a year-1 estimate at your 24.0% rate — not tax advice; consult a CPA.
Schools (NCES district)
- District
- Hanford Joint Union High
- NCES district ID
- 0616500
- Math proficiency
- 20% ▲ 1.00%
- Reading proficiency
- 58% ▬ 0.00%
- Median HH income
- $47,265
- Composite
- 35.8/100
- National rank
- #9626
- State rank
- #765 of 1400 in CA
Livability — Hanford
- Score
- 75/100
- State rank
- #121
- US rank
- #4255
Category grades
Schools grade is shown separately in the Schools card above.
Census & demographics
- Census place
- Hanford, CA
- County
- Kings County · 107,655 people
- City population
- 69,684
- Metro
- Hanford-Corcoran, CA
- Population (ZIP)
- 69,684
- Household income
- $76,023
- Rent vs Own
- Severe rent burden
- 2081.0
Population outlook (Kings County) Hauer SSP2
- Today (2025)
- 147,136 people
- By 2030
- 145,623 · -1.0%
- By 2040
- 146,017 · -0.8%
- By 2050
- 145,239 · -1.3%
- By 2075
- 131,479 · -10.6%
- By 2100
- 103,967 · -29.3%
Race, ethnicity, and origin ACS 2023
- Neighborhood character
- Diverse neighborhood (Simpson 0.60)
- Race & ethnicity
- Hispanic / Latino 52% White 35% Two or more races 19% Black 5% Asian 3% Native American 2%
- Hispanic origin (detail)
- Mexican 49%
- Common ancestry
- Russian 6% Italian 2% Lithuanian 1%
- Foreign-born
- 17% · Canada
- Languages at home
- 65% English-only · Spanish 31% Other Indo-European 2% Tagalog/Filipino 2%
Political lean MEDSL · Kings
- 2024 margin
- Strong R (+23.0) · D 37.4% · R 60.4% · Other 2.2%
- 2008→2024 swing
- -8.9pp toward R · 2008: -14.1pp · 2024: -23.0pp
- All cycles
- 2024: R+23.0 2020: R+12.2 2016: R+14.1 2012: R+16.3 2008: R+14.1
Not yet ingested
- Civics
- —
Market trends
- HPI YoY
- ▼ -267.79%
- Current HPI
- 321.3409
- Rent YoY
- ▲ 2.87%
- Metro
- Hanford-Corcoran, CA
- State GDP YoY
- ▲ 3.21%
- F500 in state
- 116
Industry mix (Fortune 500 HQ in CA)
| Industry | F500 HQs | Revenue |
|---|---|---|
| Technology | 27 | $1,492B |
|
||
| Financial Services | 3 | $174B |
|
||
| Retail | 3 | $44B |
|
||
| Insurance | 3 | $26B |
|
||
| Media / Entertainment | 2 | $115B |
|
||
| Pharmaceuticals / Biotech | 2 | $62B |
|
||
Price history
+25.8% since first listed2 events — show timeline
- 2026-05-22 Listed $195,000 TCMLS
- 2026-02-23 Sold (Public Records) $155,000 Public Records
Property tax history
-0.2%/yrLatest (2025): $668 · +3.7% YoY. Source: county tax records.
Cash-flow waterfall
monthlySold comps — $/sqft
last 12 mo · ≤1 miLoading sold comps…