30 Moss Hill Ln · Point Blank, TX
Flood risk No data
- FEMA flood zone
- —
- Chance of flooding over 30 yrs
- —
- Est. flood insurance / yr
- —
Fire risk No data
- Est. fire insurance / yr
- —
Heat risk No data
- Hot days now (above threshold)
- —
- Hot days in 30 yrs
- —
Wind risk No data
- Chance of severe wind over 30 yrs
- —
Air-quality risk No data
- Unhealthy air days now
- —
- Unhealthy air days in 30 yrs
- —
Risk factors via First Street. Map © Google.
Why this score? — see what drove the D- grade
The composite is a weighted blend of 9 inputs, each scored 0–100. Each bar is that input's sub-score; the figure is the points it added to the 100-point composite (weight × sub-score).
- Cash flow +11.6/30.0
- ARV discount +7.5/15.0
- Appreciation +4.8/10.0
- DSCR +3.4/10.0
- 1% rule +3.3/10.0
- Livability +2.6/5.0
- Rent growth +2.5/5.0
- Condition / age +2.2/5.0
- Schools +2.0/10.0
$99,900
🖨 Deal sheet (PDF) 📄 Offer letter ✓ Due diligence
Listing remarks
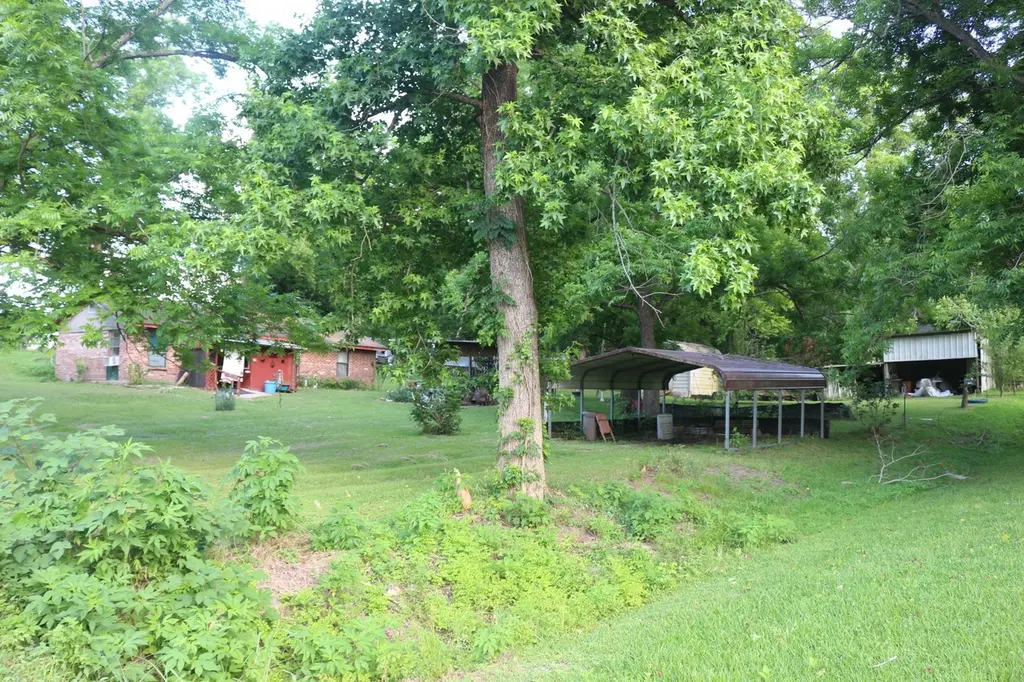
This small country cottage is the perfect setting under large vintage trees with lush grass under you feet, Lake breeze across you face. A step back in time. 2br-1 1/2 bath, 2 car carport, Boat Port 12x12, RV Port 18x15, Fish Frying Area 10x10 with concrete floor, Gazabo/Smoking Area 10x12. Sporting 5 garden areas, 1 producing lemon tree, 2 peace tree's, 3 fig tree's, 3 pear tree's, 8 to 10 Walnut Tree's, 6 Pecan Tree's. A Step into a luxirous grassland under these majestic vintage tree's where you can feel a Lake Breeze on your face.
Key facts
- Gazebo smoking area
- Producing lemon tree
- Boat port
Tags
Property features AI
Finance
- Financial info: Lease not considered
Exterior
- Parking: Detached carport; Carport for 4 vehicles; Additional parking and driveway; RV access/parking; Boat parking
- Utilities: Public water; Septic sewer
- Home design: Residential property; Built in 1993; Slab foundation; Composition roof
- Construction: Brick construction
- Exterior features: Covered patio; Deck; Porch; Patio; Private yard; Cleared and partly wooded lot with side yard
Interior
- Kitchen: Gas oven; Gas range
- Bedrooms: Primary bedroom on first floor (approximately 12 x 18); Bedroom on first floor (approximately 12 x 12); Total of 6 rooms
- Flooring: Carpet; Concrete; Laminate; Plank; Vinyl
- Bathrooms: 1 full bathroom; 1 half bathroom
- Heating & cooling: Space heater for heating; Window air conditioning units
- Interior features: Handicap accessible with ramp; Bath in primary bedroom; Tub with shower; Ceiling fans; Kitchen/dining combo; Ventilation and added insulation for improved indoor air quality
- Laundry & utility: Washer hookup; Electric dryer hookup; Utility room on first floor (approximately 11 x 8)
Neighborhood map
What this means for you Summary
Snapshot
- This is a 2-bed/1.5-bath single-family listed at $100k. Condition is rated fair.
Deal economics
- At list price, monthly cash flow is $-32 ($-382/yr) — negative.
- To cash-flow at today's rent, offer at most $95k (4.6% below list).
- To meet the 1% rule (rent ≥ 1% of price), the offer needs to be $83k (16.6% below list).
- Recommended offer: $83k (16.6% below list) — sets the bar for 1% rule.
- Cap rate 5.9% vs local median 2.4% in Point Blank — top-decile yield for the area; either an underpriced asset or a hidden risk that comps aren't pricing in. Stress-test before assuming the spread holds.
Location & tenants
- Location reads 51/100 on livability (#1,477 in TX) — a working-class tenant base; expect higher turnover. Strengths: cost of living A+, housing A+; Watch: employment D+, crime D, amenities F.
- Coldspring-Oakhurst CISD (rural): math 18% / reading 28% proficiency, ranked #732 of 826 in TX (top 89%) — low school quality limits family demand, transient renter base, plan for 1-2y turnover; 60% free/reduced lunch — lower-income household profile, screen leases tightly.
- Zoned schools: Coldspring-Oakhurst H S (math 27% / reading 37%, grade F, #1,044 of 1,632 statewide, top 66%, 496 students, 55% FRL).
- Market conditions: 197 active listings in the ZIP; 575 units permitted in San Jacinto County in 2024 (0 in 5+ unit buildings).
Forward outlook
- In year one you build about $385 of equity ($691 loan paydown + $-306 appreciation (-0.3% local appreciation)).
- San Jacinto County population projected at +7% by 2050 — modest demand growth; plan on rents tracking national, not racing it.
Negotiation context
- It's been on market 16 days — a 2% lower offer ($98k) is reasonable based on typical stale-listing flexibility.
Questions for the listing agent
- What do current leases actually rent for vs. the listed asking? Can we see a recent rent roll and the last 12 months of T-12 income?
- Have any recent inspections been done? Can we get a copy of the seller's disclosures and any deferred-maintenance estimates?
- Is there a deadline driving the sale (1031 exchange, divorce, estate, relocation)? That informs how much negotiation room exists.
- Schools are F-rated, which usually means shorter tenancies and higher turnover. Who's the typical renter profile here, and what's been the actual vacancy rate?
- Crime grade is D in this area — have there been break-ins, vandalism, or insurance claims at this property in the last 3 years? What carrier currently insures it and at what premium?
- The area grade is low — what's the realistic commute time and amenity access for the typical tenant pool here? Any planned neighborhood developments (good or bad) we should know about?
- What's the average days-on-market for RENTAL listings here right now (not sales)? A rising rental-DOM trend means longer vacancies and softer asking-rent achievability than the comps imply.
- What's the recent tenant-quality profile in this submarket — average credit score on applications, eviction rate, late-payment / NSF rate, and stable-employment percentage? A property-management company in the area should have these aggregated.
- How much new for-sale + rental construction is in the pipeline within 1–3 miles? Heavy new supply typically softens prices + rents 12–24 months out; constrained supply supports both.
Investment metrics
- 1% rule
- 0.83% ✗
- Cap rate
- 5.91%
- Cash-on-cash
- -1.37%
- DSCR
- 0.94
- GRM
- 10.0
CMA / ARV
- ARV (on-the-fly)
- $100,000
- Comps found
- 1
Show comp detail 1 sale within ~0.75 mi
| Address | Dist | Beds/Ba | Sqft | Sold | Price | $/sf | Match |
|---|---|---|---|---|---|---|---|
| 30 Moss Hill Ln | 0.00mi | 2/1.5 | 800 (0%) | 0mo | $99,900 | $125 | 100 |
Match score weights: distance 35% · size 25% · config 20% · recency 20%. Top-matched comps best support the ARV.
Projected returns pro-forma
-0.31% appreciation · 3.0% rent growth · sell at horizon
- IRR
- -5.0%
- Equity multiple
- 0.77×
- Total profit
- $-6,365
- Equity at exit
- $27,488
- IRR
- 1.2%
- Equity multiple
- 1.12×
- Total profit
- $3,414
- Equity at exit
- $31,853
Cash invested: $27,972 (down + closing). Projections, not guarantees.
Landlord ↔ Tenant lean methodology
- Overall (STATE)
- 87 Strongly Landlord-Friendly
- State Texas
- 87 Strongly Landlord-Friendly · R+5
- County
- — inherits STATE
- City
- — inherits STATE
ZIP-level market 77364
- Home prices YoY
- -0.2%
- Active inventory
- 197
- Price-to-rent
- 10.0×
Monthly cashflow live
- Estimated rent
- $834 medium interval (Pro) →
- Mortgage (P&I)
- −$524
- Tax est. 1.5%
- −$125 /mo · $1,498/yr
- Insurance
- −$42
- HOA
- −$0
- Vacancy / Maint / Mgmt
- −$175
- Net cashflow
- $-32
Break-even live
Sensitivity live
| Price | -10% $37 | -5% $3 | +0% $-32 | +5% $-66 | +10% $-101 |
|---|---|---|---|---|---|
| Rent | -10% $-98 | -5% $-65 | +0% $-32 | +5% $1 | +10% $34 |
| Rate | -1.0pp $18 | -0.5pp $-6 | base $-32 | +0.5pp $-58 | +1.0pp $-84 |
UW: 25.0% down · 7.5% · 30yr · 1.5% tax · 5.0% vac · 8.0% maint · 8.0% mgmt
Financing live
Cash to close
- Down payment
- $24,975
- Closing costs
- $2,997
- Reserves months
- —
- Total cash needed
- —
Loan-product check · same deal, 3 products live
Conventional
25% down · 7.5% · 30yr
- Down + closing
- —
- Monthly P&I
- —
- Monthly cashflow
- —
- DSCR
- —
- Eligible?
- —
Personal DTI + credit; lowest rate.
DSCR
20% down · 8.5% · 30yr
- Down + closing
- —
- Monthly P&I
- —
- Monthly cashflow
- —
- DSCR
- —
- Eligible?
- —
No personal income docs; deal must DSCR.
Hard money
10% down · 12.0% · 12mo
- Down + closing
- —
- Monthly P&I
- —
- Monthly cashflow
- —
- DSCR
- —
- Eligible?
- —
Short-term bridge; refi at stabilization.
Listing history 7 events
-
2026-06-07days on market $99,900 Pending 16 DOM
-
2026-06-03days on market $99,900 Pending 15 DOM
-
2026-06-02days on market $99,900 Pending 14 DOM
-
2026-06-01days on market $99,900 Pending 13 DOM
-
2026-05-31statusdays on market $99,900 Pending 12 DOM
-
2026-05-30days on market $99,900 Active 11 DOM
-
2026-05-19$99,900 Active
ⓘ Source: listings_history table (triggers on properties + properties_extension) + one-shot
backfill from property_details.listing_events for pre-trigger history.
Nearby sold comps map
Loading sold comps map…
Walkable amenities ~0.75 mi
Loading nearby amenities…
Taxation est. · year 1
- Rental income
- $10,004
- − Mortgage interest
- −$5,596
- − Property taxes
- −$1,498
- − Insurance
- −$500
- − Repairs & maintenance
- −$800
- − Management
- −$800
- − Depreciation
- −$2,906
- Taxable loss
- −$2,097
- Est. tax savings @ 24.0%
- +$503
- After-tax cash flow
- $121/yr
For passive investors: Depreciation is non-cash, so a rental often shows a tax loss while cash-flowing — sheltering income. Rental losses are passive: they offset passive income freely, and up to $25,000/yr can offset ordinary (W-2) income if you actively participate and your MAGI is under $100k (phasing out to $0 by $150k); unused losses carry forward. On sale, claimed depreciation is recaptured at up to 25%, and gains may owe capital-gains tax (a 1031 exchange can defer both). Figures are a year-1 estimate at your 24.0% rate — not tax advice; consult a CPA.
Condition & rehab AI · 1 photo
The property has a good landscaping but lacks interior and exterior photos, indicating potential for moderate renovations and landscaping improvements to increase its value.
Repairs flagged
- Minor Landscaping — Some areas of the lawn appear slightly overgrown
Value-add opportunities
- Both Landscaping and garden maintenance — Enhances curb appeal and property value
- Both Interior updates — Improves the home's livability and aesthetic appeal
Renovation cost estimate screening
| Repair item | Severity | Est. cost |
|---|---|---|
| Landscaping · Some areas of the lawn appear slightly overgrown | Minor | $500–3,000 |
| Total estimated repair cost · 1 items | $500–3,000 |
Value-add ROI direction
- Both Landscaping and garden maintenance — Enhances curb appeal and property value ↑
- Both Interior updates — Improves the home's livability and aesthetic appeal ↑
ⓘ Cost ranges are severity-bucket heuristics (US national rule-of-thumb). Get contractor quotes + a written scope before underwriting a rehab budget.
Schools (NCES district)
- District
- Coldspring-Oakhurst CISD
- NCES district ID
- 4814520
- Math proficiency
- 18% ▼ -9.00%
- Reading proficiency
- 28% ▼ -2.00%
- Median HH income
- $46,916
- Composite
- 20.07/100
- National rank
- #8653
- State rank
- #732 of 826 in TX
Livability — Point Blank
- Score
- 51/100
- State rank
- #1477
- US rank
- #25299
Category grades
Schools grade is shown separately in the Schools card above.
Census & demographics
- Population (ZIP)
- 1,835
Population outlook (San Jacinto County) Hauer SSP2
- Today (2025)
- 29,069 people
- By 2030
- 29,750 · +2.3%
- By 2040
- 30,714 · +5.7%
- By 2050
- 31,010 · +6.7%
- By 2075
- 31,616 · +8.8%
- By 2100
- 29,874 · +2.8%
Race, ethnicity, and origin ACS 2023
- Neighborhood character
- Predominantly White (75%)
- Race & ethnicity
- White 75% Black 13% Two or more races 8% Hispanic / Latino 3% Asian 3%
- Common ancestry
- Lithuanian 5% Italian 4% Serbian 3%
- Foreign-born
- 5% · South Korea, Canada
- Languages at home
- 93% English-only · Spanish 6% Other Asian/Pacific 1%
Political lean MEDSL · San Jacinto
- 2024 margin
- Solid R (+65.3) · D 17.0% · R 82.3%
- 2008→2024 swing
- -27.0pp toward R · 2008: -38.3pp · 2024: -65.3pp
- All cycles
- 2024: R+65.3 2020: R+61.9 2016: R+58.4 2012: R+48.9 2008: R+38.3
Not yet ingested
- Civics
- —
Market trends
- HPI YoY
- ▼ -0.31%
- Current HPI
- 193.4748
- Rent YoY
- —
- Metro
- —
- State GDP YoY
- ▲ 3.95%
- F500 in state
- 110
Industry mix (Fortune 500 HQ in TX)
| Industry | F500 HQs | Revenue |
|---|---|---|
| Energy | 16 | $1,198B |
|
||
| Technology | 5 | $198B |
|
||
| Engineering / Construction | 4 | $72B |
|
||
| Energy Services | 3 | $60B |
|
||
| Utilities | 3 | $41B |
|
||
| Healthcare | 2 | $330B |
|
||
Price history
1 event — show timeline
- 2026-05-19 Listed $99,900 HARMLS
Cash-flow waterfall
monthlySold comps — $/sqft
last 12 mo · ≤1 miLoading sold comps…