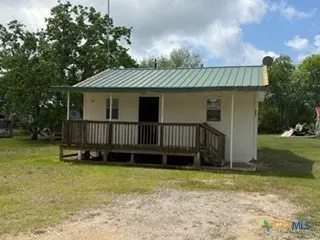
707 W Houston Ave · Seadrift, TX
Flood risk 6/10 · Moderate
- FEMA flood zone
- X (unshaded)
- Chance of flooding over 30 yrs
- 0.64%
- Est. flood insurance / yr
- $507 – $1,088
Fire risk 5/10 · Moderate
- Est. fire insurance / yr
- $1,222 – $2,270
Heat risk 10/10 · Severe
- Hot days now (above 109°F)
- 7 days/yr
- Hot days in 30 yrs
- 26 days/yr
Wind risk 9/10 · Severe
- Chance of severe wind over 30 yrs
- 99.0%
Air-quality risk 1/10 · Minimal
- Unhealthy air days now
- 0 days/yr
- Unhealthy air days in 30 yrs
- 0 days/yr
Risk factors via First Street. Map © Google.
Why this score? — see what drove the D+ grade
The composite is a weighted blend of 9 inputs, each scored 0–100. Each bar is that input's sub-score; the figure is the points it added to the 100-point composite (weight × sub-score).
- Cash flow +13.1/30.0
- ARV discount +7.5/15.0
- Appreciation +6.6/10.0
- 1% rule +5.0/10.0
- DSCR +3.9/10.0
- Schools +3.7/10.0
- Livability +3.6/5.0
- Rent growth +2.5/5.0
- Condition / age +2.5/5.0
$79,900
🖨 Deal sheet (PDF) 📄 Offer letter ✓ Due diligence
Listing remarks
Great Investment Property located in the town of Seadrift. Could be a Great fishing camp not far from the Bay. Come take a look and see the great opportunities this home has.
Key facts
- 7,100 sq ft lot
- Built 1963
- Listed 55 days
Property features AI
Exterior
- Utilities: Public water; Public sewer; Water available
- Home design: Single-story; Resale property; Pillar/post/pier foundation
- Construction: Frame construction; Composition/shingle roof; Built (year source: assessor)
- Exterior features: Covered porch
Interior
- Flooring: Laminate flooring
- Bathrooms: 2 full bathrooms
- Heating & cooling: Central heating; Central air (one unit)
- Interior features: Kitchen/dining combo; Eat-in kitchen; Separate shower
- Laundry & utility: Indoor laundry
Neighborhood map
What this means for you Summary
Snapshot
- This is a 3-bed/1.0-bath single-family listed at $80k.
Deal economics
- At list price, monthly cash flow is $-4 ($-43/yr) — negative.
- To cash-flow at today's rent, offer at most $79k (0.8% below list).
- Meets the 1% rule at list price ($799 rent vs $80k).
- Recommended offer: $78k (3.0% below list) — sets the bar for market timing.
- Cap rate 6.2% vs local median 2.1% in Seadrift — top-decile yield for the area; either an underpriced asset or a hidden risk that comps aren't pricing in. Stress-test before assuming the spread holds.
Location & tenants
- Location reads 71/100 on livability (#333 in TX) — a middle-class / working-renter tenant base. Strengths: crime A+, cost of living A+, health & safety A+; Watch: schools F, amenities F, commute F.
- Calhoun County ISD (town): math 44% / reading 43% proficiency, ranked #293 of 826 in TX (top 36%) — families likely to look elsewhere, expect single-tenant / working-renter base with shorter leases.
- Market conditions: 117 active listings in the ZIP; 1 comparable units currently listed for rent nearby; 95 units permitted in Calhoun County in 2024 (0 in 5+ unit buildings).
Forward outlook
- In year one you build about $3k of equity ($552 loan paydown + $3k appreciation (3.2% local appreciation)).
- Calhoun County population projected at +12% by 2050 — modest demand growth; plan on rents tracking national, not racing it.
- At projected returns (3.2% appreciation + 3.0% rent growth), your $22k cash investment doubles in ~6 years — after that, you're playing with house money.
- By year 10, paydown + projected appreciation supports a ~$30k cash-out refi (75% LTV) — recoverable capital for the next deal without selling this one.
Negotiation context
- It's been on market 55 days — a 3% lower offer ($78k) is reasonable based on typical stale-listing flexibility.
- 2 sale attempts with the ask held roughly flat each time — persistent listings suggest the price (not the market) is what's stuck; bring a comps-based counter.
Risks & watch-outs
- Watch-outs: property tax is 2.7% of price.
- Climate carrying-cost: major flood risk; severe wind risk, 99% chance of damaging wind over 30y; moderate wildfire risk; extreme-heat days projected 7→26/yr by 2055 (HVAC capex compounding) — expect insurance premiums to compound above CPI over the hold.
Questions for the listing agent
- What do current leases actually rent for vs. the listed asking? Can we see a recent rent roll and the last 12 months of T-12 income?
- It's been on market 55 days. Have you received any prior offers? Is the seller open to a 3% concession, seller financing, or rate buy-down credit?
- Built in 1963 — when were the roof, HVAC, electrical panel, plumbing, and water heater last replaced?
- Property tax is high relative to price — has the assessment been appealed recently, and will the sale trigger a re-assessment?
- Is there a deadline driving the sale (1031 exchange, divorce, estate, relocation)? That informs how much negotiation room exists.
- Schools are F-rated, which usually means shorter tenancies and higher turnover. Who's the typical renter profile here, and what's been the actual vacancy rate?
- The area grade is low — what's the realistic commute time and amenity access for the typical tenant pool here? Any planned neighborhood developments (good or bad) we should know about?
- What's the average days-on-market for RENTAL listings here right now (not sales)? A rising rental-DOM trend means longer vacancies and softer asking-rent achievability than the comps imply.
- What's the recent tenant-quality profile in this submarket — average credit score on applications, eviction rate, late-payment / NSF rate, and stable-employment percentage? A property-management company in the area should have these aggregated.
- How much new for-sale + rental construction is in the pipeline within 1–3 miles? Heavy new supply typically softens prices + rents 12–24 months out; constrained supply supports both.
Investment metrics
- 1% rule
- 1.00% ✓
- Cap rate
- 6.24%
- Cash-on-cash
- -0.19%
- DSCR
- 0.99
- GRM
- 8.3
CMA / ARV
- ARV (median comp)
- $162,278
- List price
- $79,900
- Delta
- -50.76%
- Verdict
- UNDERPRICED
- Comps
- 7 within 1.0 mi
Show comp detail 1 sale within ~0.75 mi
| Address | Dist | Beds/Ba | Sqft | Sold | Price | $/sf | Match |
|---|---|---|---|---|---|---|---|
| 404 S 13th St | 0.39mi | 2/1.0 (-1) | 810 (+1%) | 1mo | $279,000 | $344 | 74 |
Match score weights: distance 35% · size 25% · config 20% · recency 20%. Top-matched comps best support the ARV.
Projected returns pro-forma
3.2% appreciation · 3.0% rent growth · sell at horizon
- IRR
- 7.9%
- Equity multiple
- 1.46×
- Total profit
- $10,296
- Equity at exit
- $36,815
- IRR
- 10.5%
- Equity multiple
- 2.61×
- Total profit
- $36,042
- Equity at exit
- $57,437
Cash invested: $22,372 (down + closing). Projections, not guarantees.
Landlord ↔ Tenant lean methodology
- Overall (STATE)
- 87 Strongly Landlord-Friendly
- State Texas
- 87 Strongly Landlord-Friendly · R+5
- County
- — inherits STATE
- City
- — inherits STATE
ZIP-level market 77983
- Home prices YoY
- 2.0%
- Active inventory
- 117
- Price-to-rent
- 8.3×
Monthly cashflow live
- Estimated rent
- $799 medium interval (Pro) →
- Mortgage (P&I)
- −$419
- Tax from tax record
- −$182 /mo · $2,190/yr
- Insurance
- −$33
- HOA
- −$0
- Vacancy / Maint / Mgmt
- −$168
- Net cashflow
- $-4
Break-even live
Sensitivity live
| Price | -10% $42 | -5% $19 | +0% $-4 | +5% $-26 | +10% $-49 |
|---|---|---|---|---|---|
| Rent | -10% $-67 | -5% $-35 | +0% $-4 | +5% $28 | +10% $60 |
| Rate | -1.0pp $37 | -0.5pp $17 | base $-4 | +0.5pp $-24 | +1.0pp $-45 |
UW: 25.0% down · 7.5% · 30yr · 1.5% tax · 5.0% vac · 8.0% maint · 8.0% mgmt
Financing live
Cash to close
- Down payment
- $19,975
- Closing costs
- $2,397
- Reserves months
- —
- Total cash needed
- —
Loan-product check · same deal, 3 products live
Conventional
25% down · 7.5% · 30yr
- Down + closing
- —
- Monthly P&I
- —
- Monthly cashflow
- —
- DSCR
- —
- Eligible?
- —
Personal DTI + credit; lowest rate.
DSCR
20% down · 8.5% · 30yr
- Down + closing
- —
- Monthly P&I
- —
- Monthly cashflow
- —
- DSCR
- —
- Eligible?
- —
No personal income docs; deal must DSCR.
Hard money
10% down · 12.0% · 12mo
- Down + closing
- —
- Monthly P&I
- —
- Monthly cashflow
- —
- DSCR
- —
- Eligible?
- —
Short-term bridge; refi at stabilization.
Rent comps 1 comps
| Address | Beds | Baths | Sqft | Rent | $/sqft | DOM | Units | Dist |
|---|---|---|---|---|---|---|---|---|
| 1310 Broadway Ave Seadrift, TX | 2.0 | 1.0 | 672 | $799 | $1.19 | 44d | 1 | 0.48mi |
Listing history 17 events
-
2026-06-18days on market $79,900 Active 55 DOM
-
2026-06-17days on market $79,900 Active 54 DOM
-
2026-06-16days on market $79,900 Active 53 DOM
-
2026-06-15days on market $79,900 Active 52 DOM
-
2026-06-13days on market $79,900 Active 50 DOM
-
2026-06-12days on market $79,900 Active 49 DOM
-
2026-06-09days on market $79,900 Active 46 DOM
-
2026-06-08days on market $79,900 Active 45 DOM
-
2026-06-08days on market $79,900 Active 44 DOM
-
2026-06-07days on market $79,900 Active 43 DOM
-
2026-06-03days on market $79,900 Active 40 DOM
-
2026-06-02days on market $79,900 Active 39 DOM
-
2026-06-01days on market $79,900 Active 38 DOM
-
2026-05-31days on market $79,900 Active 37 DOM
-
2026-05-06status Active 174-char remark
-
2026-05-01historical Active Under Contract 174-char remark
-
2026-04-23$79,900 Active 174-char remark
ⓘ Source: listings_history table (triggers on properties + properties_extension) + one-shot
backfill from property_details.listing_events for pre-trigger history.
Tax reassessment forecast TX · Resets to sale price
- Current annual tax
- $2,190 · $182/mo
- Projected year-2 tax
- $2,190 · $182/mo
- Expected delta
- $0/yr ($0/mo · 0.0%)
ⓘ Screening estimate from a state-policy table — verify with the county assessor before closing.
Climate risk First Street
- Flood 6/10 Major FEMA zone X (unshaded) · 64% chance over 30 yrs
- Wildfire 5/10 Major
- Heat 10/10 Extreme 7 d/yr ≥109°F today · 26 d/yr by 30 yrs out
- Wind 9/10 Extreme 99% chance of damaging wind over 30 yrs
- Air quality 1/10 Low 0 unhealthy d/yr today · 0 by 30 yrs out
Nearby sold comps map
Loading sold comps map…
Walkable amenities ~0.75 mi
Loading nearby amenities…
Taxation est. · year 1
- Rental income
- $9,588
- − Mortgage interest
- −$4,476
- − Property taxes
- −$2,190
- − Insurance
- −$400
- − Repairs & maintenance
- −$767
- − Management
- −$767
- − Depreciation
- −$2,324
- Taxable loss
- −$1,335
- Est. tax savings @ 24.0%
- +$320
- After-tax cash flow
- $278/yr
For passive investors: Depreciation is non-cash, so a rental often shows a tax loss while cash-flowing — sheltering income. Rental losses are passive: they offset passive income freely, and up to $25,000/yr can offset ordinary (W-2) income if you actively participate and your MAGI is under $100k (phasing out to $0 by $150k); unused losses carry forward. On sale, claimed depreciation is recaptured at up to 25%, and gains may owe capital-gains tax (a 1031 exchange can defer both). Figures are a year-1 estimate at your 24.0% rate — not tax advice; consult a CPA.
Schools (NCES district)
- District
- Calhoun County ISD
- NCES district ID
- 4812480
- Math proficiency
- 44% ▼ -10.00%
- Reading proficiency
- 43% ▼ -2.00%
- Median HH income
- $48,588
- Composite
- 37.27/100
- National rank
- #4453
- State rank
- #293 of 826 in TX
Livability — Seadrift
- Score
- 71/100
- State rank
- #333
- US rank
- #7319
Category grades
Schools grade is shown separately in the Schools card above.
Census & demographics
- Census place
- Seadrift, TX
- Population (ZIP)
- 2,707
Population outlook (Calhoun County) Hauer SSP2
- Today (2025)
- 23,512 people
- By 2030
- 24,183 · +2.9%
- By 2040
- 25,370 · +7.9%
- By 2050
- 26,388 · +12.2%
- By 2075
- 28,014 · +19.1%
- By 2100
- 26,314 · +11.9%
Race, ethnicity, and origin ACS 2023
- Neighborhood character
- Majority White (59%)
- Race & ethnicity
- White 59% Hispanic / Latino 37% Two or more races 20%
- Hispanic origin (detail)
- Mexican 34%
- Common ancestry
- Romanian 2% Slovak 2% Russian 1%
- Foreign-born
- 9% · Canada
- Languages at home
- 82% English-only · Spanish 18%
Political lean MEDSL · Calhoun
- 2024 margin
- Solid R (+52.2) · D 23.7% · R 75.8%
- 2008→2024 swing
- -32.2pp toward R · 2008: -20.0pp · 2024: -52.2pp
- All cycles
- 2024: R+52.2 2020: R+44.5 2016: R+36.2 2012: R+24.2 2008: R+20.0
Not yet ingested
- Civics
- —
Market trends
- HPI YoY
- ▲ 3.20%
- Current HPI
- 159.3392
- Rent YoY
- —
- Metro
- —
- State GDP YoY
- ▲ 3.95%
- F500 in state
- 110
Industry mix (Fortune 500 HQ in TX)
| Industry | F500 HQs | Revenue |
|---|---|---|
| Energy | 16 | $1,198B |
|
||
| Technology | 5 | $198B |
|
||
| Engineering / Construction | 4 | $72B |
|
||
| Energy Services | 3 | $60B |
|
||
| Utilities | 3 | $41B |
|
||
| Healthcare | 2 | $330B |
|
||
Price history
3 events — show timeline
- 2026-05-06 Relisted — CTXMLS
- 2026-05-01 Contingent — CTXMLS
- 2026-04-23 Listed $79,900 CTXMLS
Property tax history
+8.2%/yrLatest (2025): $2,190 · +13.5% YoY. Source: county tax records.
Cash-flow waterfall
monthlySold comps — $/sqft
last 12 mo · ≤1 miLoading sold comps…