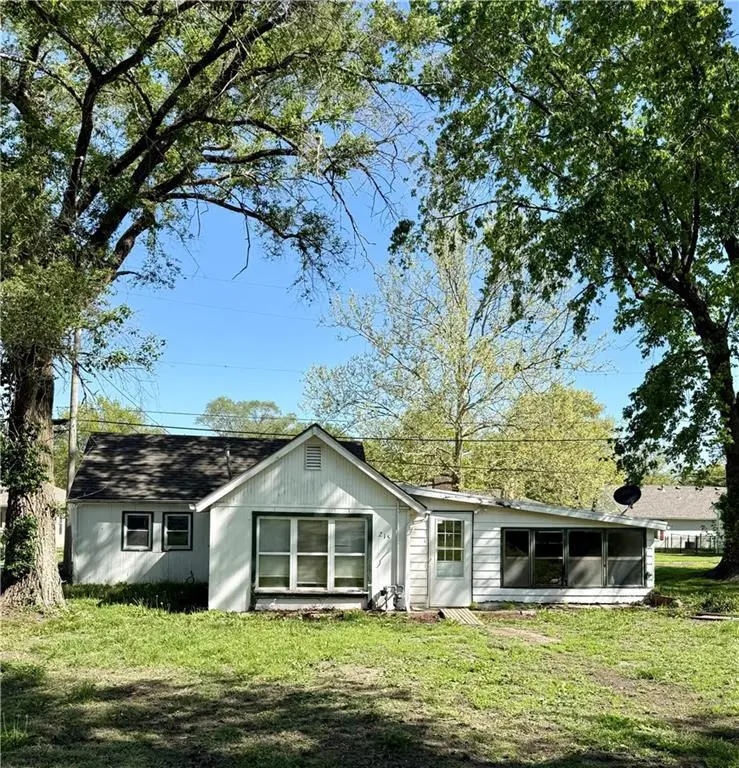
215 W 3rd St · Tonganoxie, KS
Flood risk 1/10 · Minimal
- FEMA flood zone
- X (unshaded)
- Chance of flooding over 30 yrs
- 0.0%
- Est. flood insurance / yr
- $507 – $1,088
Fire risk 3/10 · Minor
- Est. fire insurance / yr
- $1,154 – $2,142
Heat risk 4/10 · Minor
- Hot days now (above 109°F)
- 7 days/yr
- Hot days in 30 yrs
- 17 days/yr
Wind risk 2/10 · Minimal
- Chance of severe wind over 30 yrs
- —
Air-quality risk 2/10 · Minimal
- Unhealthy air days now
- 2 days/yr
- Unhealthy air days in 30 yrs
- 2 days/yr
Risk factors via First Street. Map © Google.
Why this score? — see what drove the D+ grade
The composite is a weighted blend of 9 inputs, each scored 0–100. Each bar is that input's sub-score; the figure is the points it added to the 100-point composite (weight × sub-score).
- ARV discount +15.0/15.0
- Cash flow +14.9/30.0
- DSCR +4.6/10.0
- 1% rule +4.0/10.0
- Livability +3.6/5.0
- Schools +2.7/10.0
- Rent growth +2.5/5.0
- Condition / age +2.5/5.0
- Appreciation +0.0/10.0
$130,000
🖨 Deal sheet 📄 Offer letter ✓ Due diligence
Listing remarks
This two-bedroom, one-bath home sits on a spacious lot with plenty of room to spread out, garden, or expand. The property offers a great opportunity for someone looking to bring new life into a home. While the home does need significant TLC, it provides a blank canvas for updates, renovations, or a complete transformation to fit your vision. Outside, the large lot is a standout feature—offering space for outbuildings, or future additions. Whether you’re an investor, flipper, or buyer looking to build equity, this property is full of possibilities for the right buyer willing to put in the work.
Key facts
- 7,384 sq ft lot
- Built 1940
- Listed 48 days
Property features AI
Finance
- Other: Living area reported as 812 (source: public records)
Exterior
- Parking: Other parking
- Utilities: Public water
- Home design: Single-family residence; Residential property; Ranch style; 1-story (ranch)
- Construction: Board & batten siding and frame construction; Composition roof; Approximately 76–100 years old
- Exterior features: City lot; Not in a flood plain; Lot dimensions approximately 52 x 142
Interior
- Bedrooms: 2 bedrooms
- Bathrooms: 1 full bathroom
- Heating & cooling: Forced air heating; Has cooling
- Interior features: Ranch floor plan; Slab foundation
Neighborhood map
What this means for you Summary
Snapshot
- This is a 2-bed/1.0-bath single-family listed at $130k.
Deal economics
- At list price, monthly cash flow is $39 ($464/yr) — positive.
- The deal already cash-flows at list — no discount required.
- To meet the 1% rule (rent ≥ 1% of price), the offer needs to be $116k (10.4% below list).
- Recommended offer: $116k (10.4% below list) — sets the bar for 1% rule.
- Cap rate 6.7% vs local median 3.2% in Tonganoxie — top-decile yield for the area; either an underpriced asset or a hidden risk that comps aren't pricing in. Stress-test before assuming the spread holds.
Location & tenants
- Location reads 71/100 on livability (#137 in KS) — a middle-class / working-renter tenant base. Strengths: crime A+, cost of living A+, housing A+; Watch: schools D+, amenities F, commute F.
- Tonganoxie (town): math 25% / reading 34% proficiency, ranked #89 of 169 in KS (top 53%) — low school quality limits family demand, transient renter base, plan for 1-2y turnover.
- Market conditions: 190 active listings in the ZIP; 2 comparable units currently listed for rent nearby; solid renter incomes; 347 units permitted in Leavenworth County in 2024 (50 in 5+ unit buildings).
- This rent is only 14% of the median local income ($98k/yr) — well below the 30% rent-burden line; pricing power to push rent on renewal without tenant pushback.
Forward outlook
- Local home prices are declining (-3.0%/yr); year-one equity from $899 of loan paydown is wiped out by about $4k of value loss. Plan a longer hold.
- Leavenworth County population projected at +12% by 2050 — modest demand growth; plan on rents tracking national, not racing it.
Negotiation context
- It's been on market 49 days — a 3% lower offer ($126k) is reasonable based on typical stale-listing flexibility.
- Current owner paid $40k; list at $130k implies a 225% gain — meaningful room to come down on a strong offer.
Risks & watch-outs
- Watch-outs: built in 1940 — expect roof / HVAC / electrical / plumbing capex.
Questions for the listing agent
- It's been on market 49 days. Have you received any prior offers? Is the seller open to a 10% concession, seller financing, or rate buy-down credit?
- Built in 1940 — when were the roof, HVAC, electrical panel, plumbing, and water heater last replaced?
- Is there a deadline driving the sale (1031 exchange, divorce, estate, relocation)? That informs how much negotiation room exists.
- Schools are D-rated, which usually means shorter tenancies and higher turnover. Who's the typical renter profile here, and what's been the actual vacancy rate?
- The area grade is low — what's the realistic commute time and amenity access for the typical tenant pool here? Any planned neighborhood developments (good or bad) we should know about?
- What's the average days-on-market for RENTAL listings here right now (not sales)? A rising rental-DOM trend means longer vacancies and softer asking-rent achievability than the comps imply.
- What's the recent tenant-quality profile in this submarket — average credit score on applications, eviction rate, late-payment / NSF rate, and stable-employment percentage? A property-management company in the area should have these aggregated.
- How much new for-sale + rental construction is in the pipeline within 1–3 miles? Heavy new supply typically softens prices + rents 12–24 months out; constrained supply supports both.
Investment metrics
- 1% rule
- 0.90% ✗
- Cap rate
- 6.65%
- Cash-on-cash
- 1.28%
- DSCR
- 1.06
- GRM
- 9.3
CMA / ARV
- ARV (on-the-fly)
- $177,016
- Comps found
- 4
Show comp detail 4 sales within ~0.75 mi
| Address | Dist | Beds/Ba | Sqft | Sold | Price | $/sf | Match |
|---|---|---|---|---|---|---|---|
| 320 E 5th St | 0.41mi | 2/1.0 | 826 (+2%) | 7mo | $179,950 | $218 | 72 |
| 210 E 4th St | 0.31mi | 2/1.0 | 825 (+2%) | 18mo | $175,000 | $212 | 68 |
| 308 E 2nd St | 0.36mi | 2/1.0 | 910 (+12%) | 3mo | $239,950 | $264 | 60 |
| 623 E 7th St | 0.64mi | 2/1.0 | 864 (+6%) | 2mo | $125,000 | $145 | 58 |
Match score weights: distance 35% · size 25% · config 20% · recency 20%. Top-matched comps best support the ARV.
Projected returns pro-forma
-3.0% appreciation · 3.0% rent growth · sell at horizon
- IRR
- -14.3%
- Equity multiple
- 0.49×
- Total profit
- $-18,593
- Equity at exit
- $19,383
- IRR
- -5.5%
- Equity multiple
- 0.64×
- Total profit
- $-12,987
- Equity at exit
- $11,240
Cash invested: $36,400 (down + closing). Projections, not guarantees.
Landlord ↔ Tenant lean methodology
- Overall (STATE)
- 83 Strongly Landlord-Friendly
- State Kansas
- 83 Strongly Landlord-Friendly · R+10
- County
- — inherits STATE
- City
- — inherits STATE
ZIP-level market 66086
- Home prices YoY
- -25.6%
- Active inventory
- 190
- Price-to-rent
- 9.3×
Monthly cashflow live
- Estimated rent
- $1,165 medium interval (Pro) →
- Mortgage (P&I)
- −$682
- Tax from tax record
- −$146 /mo · $1,749/yr
- Insurance
- −$54
- HOA
- −$0
- Vacancy / Maint / Mgmt
- −$245
- Net cashflow
- $39
Break-even live
UW: 25.0% down · 7.5% · 30yr · 1.5% tax · 5.0% vac · 8.0% maint · 8.0% mgmt
Financing live
Cash to close
- Down payment
- $32,500
- Closing costs
- $3,900
- Reserves months
- —
- Total cash needed
- —
Loan-product check · same deal, 3 products live
Conventional
25% down · 7.5% · 30yr
- Down + closing
- —
- Monthly P&I
- —
- Monthly cashflow
- —
- DSCR
- —
- Eligible?
- —
Personal DTI + credit; lowest rate.
DSCR
20% down · 8.5% · 30yr
- Down + closing
- —
- Monthly P&I
- —
- Monthly cashflow
- —
- DSCR
- —
- Eligible?
- —
No personal income docs; deal must DSCR.
Hard money
10% down · 12.0% · 12mo
- Down + closing
- —
- Monthly P&I
- —
- Monthly cashflow
- —
- DSCR
- —
- Eligible?
- —
Short-term bridge; refi at stabilization.
Rent comps 2 comps
| Address | Beds | Baths | Sqft | Rent | $/sqft | DOM | Units | Dist |
|---|---|---|---|---|---|---|---|---|
| 202 Grace St Apt C Tonganoxie, KS | 2.0 | 1.0 | 750 | $895 | $1.19 | 24d | 1 | 0.62mi |
| 301 Ridge St Unit C Tonganoxie, KS | 1.0 | 1.0 | 750 | $895 | $1.19 | 8d | 1 | 1.11mi |
Listing history 14 events
-
2026-06-09days on market $130,000 Active 49 DOM
-
2026-06-08days on market $130,000 Active 48 DOM
-
2026-06-07days on market $130,000 Active 47 DOM
-
2026-06-05days on market $130,000 Active 44 DOM
-
2026-06-03days on market $130,000 Active 43 DOM
-
2026-06-02days on market $130,000 Active 42 DOM
-
2026-06-01days on market $130,000 Active 41 DOM
-
2026-05-31days on market $130,000 Active 40 DOM
-
2026-05-30days on market $130,000 Active 39 DOM
-
2026-04-22$130,000 Active
-
2026-04-20historical $130,000
-
1998-07-01soldstatus $40,000
-
1996-04-01soldstatus $27,500
-
1995-09-01soldstatus $27,500
ⓘ Source: listings_history table (triggers on properties + properties_extension) + one-shot
backfill from property_details.listing_events for pre-trigger history.
Tax reassessment forecast KS · Resets to sale price
- Current annual tax
- $1,749 · $146/mo
- Projected year-2 tax
- $1,833 · $153/mo
- Expected delta
- +$84/yr (+$7/mo · 4.8%)
ⓘ Screening estimate from a state-policy table — verify with the county assessor before closing.
Climate risk First Street
- Flood 1/10 Low FEMA zone X (unshaded) · 0% chance over 30 yrs
- Wildfire 3/10 Moderate
- Heat 4/10 Moderate 7 d/yr ≥109°F today · 17 d/yr by 30 yrs out
- Wind 2/10 Low
- Air quality 2/10 Low 2 unhealthy d/yr today · 2 by 30 yrs out
Nearby sold comps map
Loading sold comps map…
Walkable amenities ~0.75 mi
Loading nearby amenities…
Taxation est. · year 1
- Rental income
- $13,980
- − Mortgage interest
- −$7,282
- − Property taxes
- −$1,749
- − Insurance
- −$650
- − Repairs & maintenance
- −$1,118
- − Management
- −$1,118
- − Depreciation
- −$3,782
- Taxable loss
- −$1,720
- Est. tax savings @ 24.0%
- +$413
- After-tax cash flow
- $877/yr
For passive investors: Depreciation is non-cash, so a rental often shows a tax loss while cash-flowing — sheltering income. Rental losses are passive: they offset passive income freely, and up to $25,000/yr can offset ordinary (W-2) income if you actively participate and your MAGI is under $100k (phasing out to $0 by $150k); unused losses carry forward. On sale, claimed depreciation is recaptured at up to 25%, and gains may owe capital-gains tax (a 1031 exchange can defer both). Figures are a year-1 estimate at your 24.0% rate — not tax advice; consult a CPA.
Schools (NCES district)
- District
- Tonganoxie
- NCES district ID
- 2012210
- Math proficiency
- 25% ▼ -7.00%
- Reading proficiency
- 34% ▼ -4.00%
- Median HH income
- $66,669
- Composite
- 27.35/100
- National rank
- #6982
- State rank
- #89 of 169 in KS
Livability — Tonganoxie
- Score
- 71/100
- State rank
- #137
- US rank
- #6777
Category grades
Schools grade is shown separately in the Schools card above.
Census & demographics
- Census place
- Tonganoxie, KS
- County
- Leavenworth County · 57,713 people
- City population
- 10,940
- Metro
- Kansas City, MO-KS
- Population (ZIP)
- 10,940
- Household income
- $98,318
- Rent vs Own
- Severe rent burden
- 258.0
Population outlook (Leavenworth County) Hauer SSP2
- Today (2025)
- 85,138 people
- By 2030
- 87,518 · +2.8%
- By 2040
- 91,715 · +7.7%
- By 2050
- 95,304 · +11.9%
- By 2075
- 103,750 · +21.9%
- By 2100
- 101,230 · +18.9%
Race, ethnicity, and origin ACS 2023
- Neighborhood character
- Predominantly White (86%)
- Race & ethnicity
- White 86% Two or more races 10% Hispanic / Latino 6% Asian 1%
- Hispanic origin (detail)
- Mexican 5%
- Common ancestry
- Romanian 3% Italian 3% Slovak 3%
- Foreign-born
- 2% · China, Canada
- Languages at home
- 97% English-only · Spanish 1% Chinese 1%
Political lean MEDSL · Leavenworth
- 2024 margin
- Strong R (+22.8) · D 37.6% · R 60.4% · Other 2.1%
- 2008→2024 swing
- -11.2pp toward R · 2008: -11.6pp · 2024: -22.8pp
- All cycles
- 2024: R+22.8 2020: R+21.1 2016: R+24.7 2012: R+20.2 2008: R+11.6
Not yet ingested
- Civics
- —
Market trends
- HPI YoY
- ▼ -87.89%
- Current HPI
- 255.5239
- Rent YoY
- —
- Metro
- Kansas City, MO-KS
- State GDP YoY
- —
- F500 in state
- 0
Price history
+372.7% since first listed5 events — show timeline
- 2026-04-22 Listed $130,000 Heartland MLS as Distributed by MLS Grid
- 2026-04-20 Coming Soon $130,000 Heartland MLS as Distributed by MLS Grid
- 1998-07-01 Sold (Public Records) $40,000 Public Records
- 1996-04-01 Sold (Public Records) $27,500 Public Records
- 1995-09-01 Sold (Public Records) $27,500 Public Records
Property tax history
+6.0%/yrLatest (2025): $1,749 · +3.2% YoY. Source: county tax records.
Cash-flow waterfall
monthlySold comps — $/sqft
last 12 mo · ≤1 miLoading sold comps…