 🏗️ New Construction
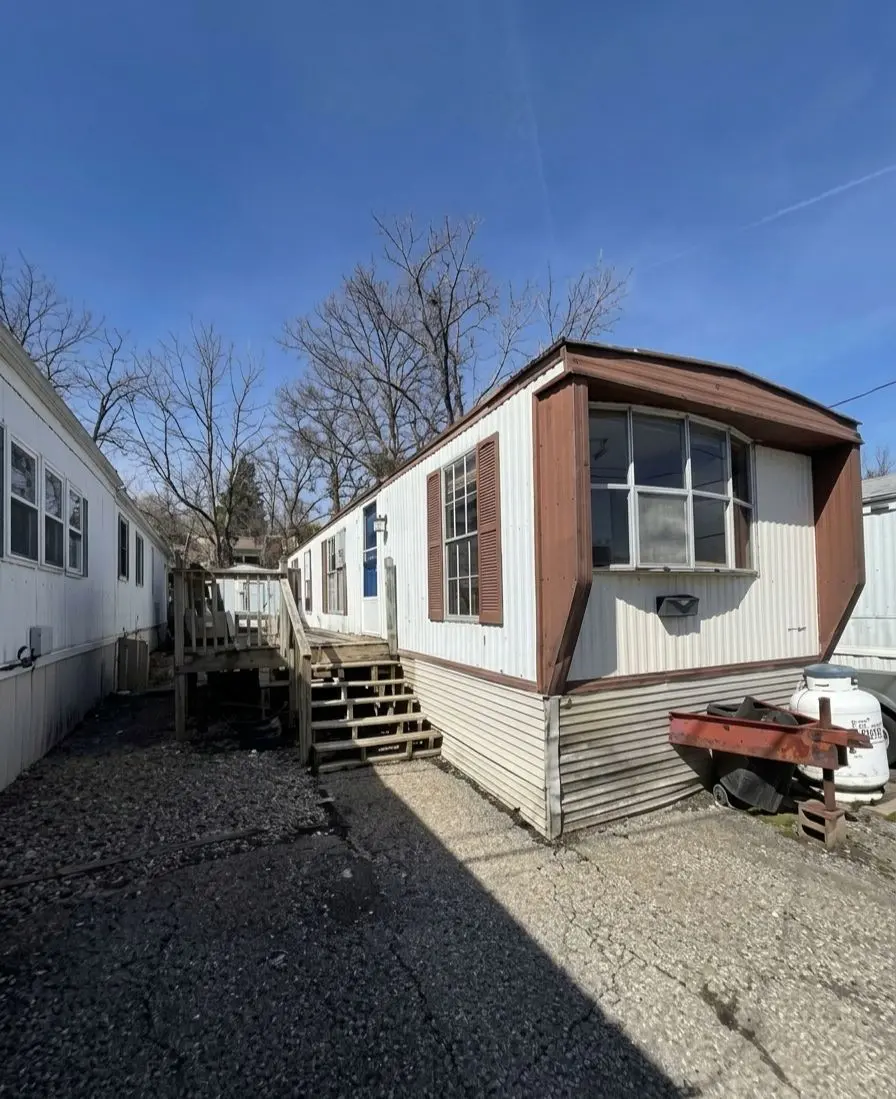
Bendix Plan · West Mifflin, PA
Flood risk 1/10 · Minimal
- FEMA flood zone
- X (unshaded)
- Chance of flooding over 30 yrs
- 0.0%
- Est. flood insurance / yr
- $507 – $1,088
Fire risk 1/10 · Minimal
- Est. fire insurance / yr
- $511 – $949
Heat risk 3/10 · Minor
- Hot days now (above 96°F)
- 7 days/yr
- Hot days in 30 yrs
- 15 days/yr
Wind risk 2/10 · Minimal
- Chance of severe wind over 30 yrs
- —
Air-quality risk 3/10 · Minor
- Unhealthy air days now
- 2 days/yr
- Unhealthy air days in 30 yrs
- 4 days/yr
Risk factors via First Street. Map © Google.
Why this score? — see what drove the D+ grade
The composite is a weighted blend of 9 inputs, each scored 0–100. Each bar is that input's sub-score; the figure is the points it added to the 100-point composite (weight × sub-score).
- Cash flow +15.0/30.0
- ARV discount +7.5/15.0
- 1% rule +5.0/10.0
- DSCR +5.0/10.0
- Rent growth +3.9/5.0
- Livability +3.7/5.0
- Schools +2.6/10.0
- Condition / age +2.5/5.0
- Appreciation +0.0/10.0
$2,500
🖨 Deal sheet 📄 Offer letter ✓ Due diligence
Listing remarks
This 2-bedroom, 1-bath home located in Charter Oaks Community in Pittsburgh, PA offers a great opportunity for buyers looking to customize a home to their liking. Built in 1974, this single-wide layout provides a functional footprint with defined living spaces and plenty of potential. The home is being offered at an affordable price point, making it ideal for renovation-minded buyers or those seeking a budget-friendly housing option. With some updates and improvements, this property can be transformed into a comfortable and personalized living space. Conveniently situated within the Charter Oaks community, residents enjoy easy access to local shopping, dining, and major roadways. This is a
Key facts
- Listed 37 days
Neighborhood map
What this means for you Summary
Snapshot
- This is a 2-bed/1.0-bath manufactured listed at $2k.
Deal economics
- At list price, monthly cash flow is $815 ($10k/yr) — positive.
- The deal already cash-flows at list — no discount required.
- Meets the 1% rule at list price ($1k rent vs $2k).
- Recommended offer: $2k (3.0% below list) — sets the bar for market timing.
- Cap rate 112.3% vs local median 5.2% in West Mifflin — top-decile yield for the area; either an underpriced asset or a hidden risk that comps aren't pricing in. Stress-test before assuming the spread holds.
Location & tenants
- Location reads 73/100 on livability (#539 in PA) — a middle-class / working-renter tenant base. Strengths: cost of living A+, housing A+, schools B+; Watch: health & safety D, crime D-, amenities F.
- West Mifflin Area SD (suburban): math 19% / reading 41% proficiency, ranked #443 of 539 in PA (top 82%) — families likely to look elsewhere, expect single-tenant / working-renter base with shorter leases.
- Market conditions: Rents rising fast (+5.7%/yr); 115 active listings in the ZIP; 7 comparable units currently listed for rent nearby; rentals leasing fast (median 11d on market — plan ~1-2 weeks tenant-placement turnaround); 43% of comp listings sitting > 30 days — soft ceiling on asking rent; solid renter incomes; 2,996 units permitted in Allegheny County in 2024 (1,588 in 5+ unit buildings).
- This rent is only 15% of the median local income ($91k/yr) — well below the 30% rent-burden line; pricing power to push rent on renewal without tenant pushback.
Forward outlook
- Local home prices are declining (-3.0%/yr); year-one equity from $64 of loan paydown is wiped out by about $276 of value loss. Plan a longer hold.
- At projected returns (-3.0% appreciation + 5.7% rent growth), your $3k cash investment doubles in ~1 year — after that, you're playing with house money.
Negotiation context
- It's been on market 38 days — a 3% lower offer ($2k) is reasonable based on typical stale-listing flexibility.
Risks & watch-outs
- Watch-outs: property tax is 5.5% of price.
Questions for the listing agent
- It's been on market 38 days. Have you received any prior offers? Is the seller open to a 3% concession, seller financing, or rate buy-down credit?
- Property tax is high relative to price — has the assessment been appealed recently, and will the sale trigger a re-assessment?
- Is there a deadline driving the sale (1031 exchange, divorce, estate, relocation)? That informs how much negotiation room exists.
- Schools are B-rated — typically a magnet for longer-tenancy family renters. What's the average tenant stay here, and is there a school-zone premium baked into asking?
- Crime grade is D in this area — have there been break-ins, vandalism, or insurance claims at this property in the last 3 years? What carrier currently insures it and at what premium?
- The area grade is low — what's the realistic commute time and amenity access for the typical tenant pool here? Any planned neighborhood developments (good or bad) we should know about?
- What's the average days-on-market for RENTAL listings here right now (not sales)? A rising rental-DOM trend means longer vacancies and softer asking-rent achievability than the comps imply.
- What's the recent tenant-quality profile in this submarket — average credit score on applications, eviction rate, late-payment / NSF rate, and stable-employment percentage? A property-management company in the area should have these aggregated.
- How much new for-sale + rental construction is in the pipeline within 1–3 miles? Heavy new supply typically softens prices + rents 12–24 months out; constrained supply supports both.
Investment metrics
- 1% rule
- 12.06% ✓
- Cap rate
- 112.33%
- Cash-on-cash
- 378.72%
- DSCR
- 17.85
- GRM
- 0.7
CMA / ARV
- ARV (median comp)
- $9,218
- List price
- $2,500
- Delta
- -72.88%
- Verdict
- UNDERPRICED
- Comps
- 1 within 2.0 mi
Show comp detail 2 sales within ~0.75 mi
| Address | Dist | Beds/Ba | Sqft | Sold | Price | $/sf | Match |
|---|---|---|---|---|---|---|---|
| 504 Will Ln | 0.05mi | 1/1.0 (-1) | 720 (-8%) | 8mo | $10,000 | $14 | 74 |
| 36 Cheryl Ln Lot 18 | 0.03mi | 2/2.0 | 827 (+6%) | 14mo | $49,900 | $60 | 72 |
Match score weights: distance 35% · size 25% · config 20% · recency 20%. Top-matched comps best support the ARV.
Projected returns pro-forma
-3.0% appreciation · 5.74% rent growth · sell at horizon
- IRR
- —
- Equity multiple
- 21.75×
- Total profit
- $53,553
- Equity at exit
- $1,374
- IRR
- —
- Equity multiple
- 50.27×
- Total profit
- $127,176
- Equity at exit
- $797
Cash invested: $2,581 (down + closing). Projections, not guarantees.
Landlord ↔ Tenant lean methodology
- Overall (STATE)
- 62 Landlord-Friendly
- State Pennsylvania
- 62 Landlord-Friendly · EVEN
- County
- — inherits STATE
- City
- — inherits STATE
ZIP-level market 15236
- Rents YoY
- 5.7%
- Active inventory
- 115
- Price-to-rent
- 0.2×
Monthly cashflow live
- Estimated rent
- $1,112 high interval (Pro) →
- Mortgage (P&I)
- −$48
- Tax est. 1.5%
- −$12 /mo · $138/yr
- Insurance
- −$4
- HOA
- −$0
- Vacancy / Maint / Mgmt
- −$233
- Net cashflow
- $815
Break-even live
UW: 25.0% down · 7.5% · 30yr · 1.5% tax · 5.0% vac · 8.0% maint · 8.0% mgmt
Financing live
Cash to close
- Down payment
- $2,305
- Closing costs
- $277
- Reserves months
- —
- Total cash needed
- —
Loan-product check · same deal, 3 products live
Conventional
25% down · 7.5% · 30yr
- Down + closing
- —
- Monthly P&I
- —
- Monthly cashflow
- —
- DSCR
- —
- Eligible?
- —
Personal DTI + credit; lowest rate.
DSCR
20% down · 8.5% · 30yr
- Down + closing
- —
- Monthly P&I
- —
- Monthly cashflow
- —
- DSCR
- —
- Eligible?
- —
No personal income docs; deal must DSCR.
Hard money
10% down · 12.0% · 12mo
- Down + closing
- —
- Monthly P&I
- —
- Monthly cashflow
- —
- DSCR
- —
- Eligible?
- —
Short-term bridge; refi at stabilization.
Rent comps 7 comps
| Address | Beds | Baths | Sqft | Rent | $/sqft | DOM | Units | Dist |
|---|---|---|---|---|---|---|---|---|
| 3 Marhoefer Dr Pleasant Hills, PA | 3.0 | 1.0 | 910 | $1,100 | $1.21 | 43d | 1 | 0.59mi |
| 5050 Doyle Rd Pittsburgh, PA | 2.0 | 1.0 | 850 | $1,100 | $1.29 | 43d | 1 | 0.76mi |
| 5050 Doyle Rd Unit ROAD207 Pittsburgh, PA | 2.0 | 1.0 | 850 | $1,059 | $1.25 | 43d | 1 | 0.76mi |
| 5492 Youngridge Dr Pittsburgh, PA | 3.0 | 1.0 | 591 | $1,109 | $1.87 | 1d | 45 | 1.15mi |
| 1526 Parkline Dr Pittsburgh, PA | 3.0 | 1.0 | 942 | $1,214 | $1.29 | 7d | 44 | 1.34mi |
| 1575 Bevan Rd Pittsburgh, PA | 2.0 | 1.0 | 515 | $1,085 | $2.10 | 10d | 7 | 1.42mi |
| 1661 Skyline Dr Pittsburgh, PA | 1.0–2.0 | 1.0 | 637 | $1,210 | $1.90 | 4d | 7 | 1.43mi |
Listing history 3 events
-
2026-06-01days on market $2,500 Active 38 DOM
-
2026-05-31days on market $2,500 Active 37 DOM
-
2026-04-25$2,500 Active 747-char remark
ⓘ Source: listings_history table (triggers on properties + properties_extension) + one-shot
backfill from property_details.listing_events for pre-trigger history.
Climate risk First Street
- Flood 1/10 Low FEMA zone X (unshaded) · 0% chance over 30 yrs
- Wildfire 1/10 Low
- Heat 3/10 Moderate 7 d/yr ≥96°F today · 15 d/yr by 30 yrs out
- Wind 2/10 Low
- Air quality 3/10 Moderate 2 unhealthy d/yr today · 4 by 30 yrs out
Nearby sold comps map
Loading sold comps map…
Walkable amenities ~0.75 mi
Loading nearby amenities…
Taxation est. · year 1
- Rental income
- $13,341
- − Mortgage interest
- −$516
- − Property taxes
- −$138
- − Insurance
- −$46
- − Repairs & maintenance
- −$1,067
- − Management
- −$1,067
- − Depreciation
- −$268
- Taxable income
- $10,238
- Est. tax owed @ 24.0%
- −$2,457
- After-tax cash flow
- $7,318/yr
For passive investors: Depreciation is non-cash, so a rental often shows a tax loss while cash-flowing — sheltering income. Rental losses are passive: they offset passive income freely, and up to $25,000/yr can offset ordinary (W-2) income if you actively participate and your MAGI is under $100k (phasing out to $0 by $150k); unused losses carry forward. On sale, claimed depreciation is recaptured at up to 25%, and gains may owe capital-gains tax (a 1031 exchange can defer both). Figures are a year-1 estimate at your 24.0% rate — not tax advice; consult a CPA.
Schools (NCES district)
- District
- West Mifflin Area SD
- NCES district ID
- 4225680
- Math proficiency
- 19% ▼ -19.00%
- Reading proficiency
- 41% ▼ -14.00%
- Median HH income
- $46,532
- Composite
- 25.78/100
- National rank
- #7371
- State rank
- #443 of 539 in PA
Livability — West Mifflin
- Score
- 73/100
- State rank
- #539
- US rank
- #5042
Category grades
Schools grade is shown separately in the Schools card above.
Census & demographics
- Census place
- West Mifflin, PA
- County
- Allegheny County · 1,022,028 people
- City population
- 18,816
- Metro
- Pittsburgh, PA
- Population (ZIP)
- 31,313
- Household income
- $90,767
- Rent vs Own
- Severe rent burden
- 732.0
Population outlook (Allegheny County) Hauer SSP2
- Today (2025)
- 1,250,282 people
- By 2030
- 1,256,482 · +0.5%
- By 2040
- 1,256,318 · +0.5%
- By 2050
- 1,244,169 · -0.5%
- By 2075
- 1,197,693 · -4.2%
- By 2100
- 1,093,187 · -12.6%
Race, ethnicity, and origin ACS 2023
- Neighborhood character
- Predominantly White (83%)
- Race & ethnicity
- White 83% Asian 9% Black 3% Two or more races 3% Hispanic / Latino 2%
- Common ancestry
- Romanian 8% Scotch-Irish 1% Italian 1%
- Foreign-born
- 11% · India, Canada
- Languages at home
- 88% English-only · Other Indo-European 8% Spanish 1% Other Asian/Pacific 1%
Political lean MEDSL · Allegheny
- 2024 margin
- Strong D (+20.3) · D 59.7% · R 39.4%
- 2008→2024 swing
- +4.8pp toward D · 2008: 15.5pp · 2024: 20.3pp
- All cycles
- 2024: D+20.3 2020: D+20.4 2016: D+16.4 2012: D+14.4 2008: D+15.5
Not yet ingested
- Civics
- —
Market trends
- HPI YoY
- ▼ -194.15%
- Current HPI
- 255.0278
- Rent YoY
- ▲ 5.74%
- Metro
- Pittsburgh, PA
- State GDP YoY
- ▲ 1.68%
- F500 in state
- 34
Industry mix (Fortune 500 HQ in PA)
| Industry | F500 HQs | Revenue |
|---|---|---|
| Healthcare | 2 | $309B |
|
||
| Insurance | 2 | $27B |
|
||
| Telecommunications / Media | 1 | $124B |
|
||
| Industrial Distribution | 1 | $22B |
|
||
| Financial Services | 1 | $20B |
|
||
| Chemicals / Materials | 1 | $18B |
|
||
Cash-flow waterfall
monthlySold comps — $/sqft
last 12 mo · ≤1 miLoading sold comps…