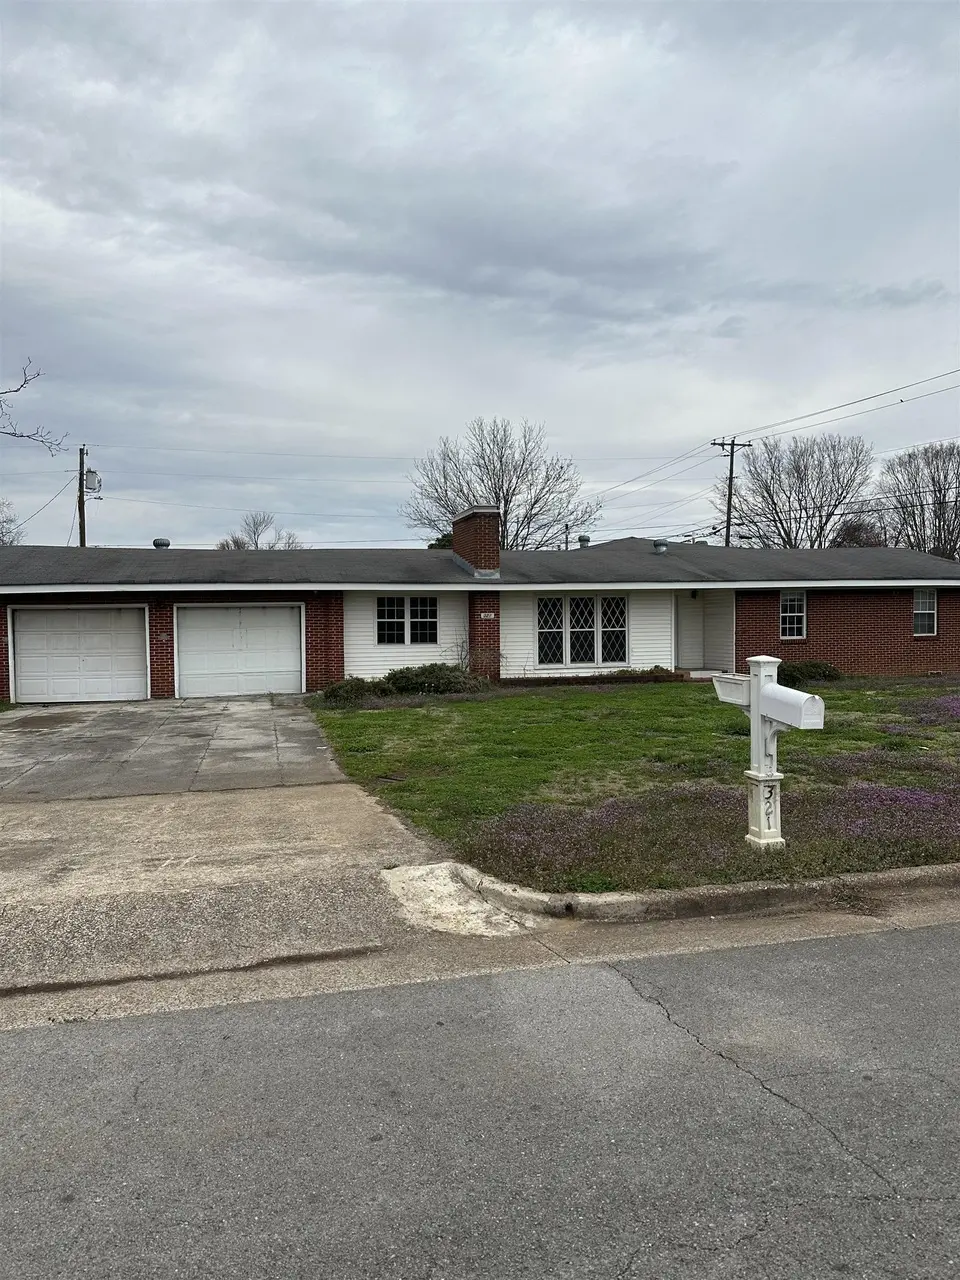
321 Richton Ave · Muscle Shoals, AL
Flood risk 1/10 · Minimal
- FEMA flood zone
- X (unshaded)
- Chance of flooding over 30 yrs
- 0.0%
- Est. flood insurance / yr
- $507 – $1,088
Fire risk 1/10 · Minimal
- Est. fire insurance / yr
- $916 – $1,700
Heat risk 6/10 · Moderate
- Hot days now (above 107°F)
- 7 days/yr
- Hot days in 30 yrs
- 20 days/yr
Wind risk 4/10 · Minor
- Chance of severe wind over 30 yrs
- 22.0%
Air-quality risk 1/10 · Minimal
- Unhealthy air days now
- 0 days/yr
- Unhealthy air days in 30 yrs
- 0 days/yr
Risk factors via First Street. Map © Google.
Why this score? — see what drove the C grade
The composite is a weighted blend of 9 inputs, each scored 0–100. Each bar is that input's sub-score; the figure is the points it added to the 100-point composite (weight × sub-score).
- Cash flow +18.8/30.0
- ARV discount +15.0/15.0
- DSCR +5.9/10.0
- Schools +4.4/10.0
- 1% rule +4.0/10.0
- Livability +3.4/5.0
- Rent growth +2.5/5.0
- Condition / age +2.5/5.0
- Appreciation +0.0/10.0
$199,000
🖨 Deal sheet 📄 Offer letter ✓ Due diligence
Listing remarks MLS
Spacious home in Muscle Shoals with great potential! This property offers plenty of room for living and entertaining with generous size bedrooms. While the house needs some updates and TLC, it’s a fantastic opportunity to customize and make it your own. Conveniently located with easy access to local amenities, this home is perfect for buyers looking to invest and create their dream space. Buyer to verify all information.
Key facts
- 0.29 acre lot
- 2 garage spots
- Built 1965
Tags
Neighborhood map
What this means for you Summary
Snapshot
- This is a 4-bed/1.0-bath single-family listed at $199k.
Deal economics
- At list price, monthly cash flow is $201 ($2k/yr) — positive.
- The deal already cash-flows at list — no discount required.
- To meet the 1% rule (rent ≥ 1% of price), the offer needs to be $180k (9.5% below list).
- Recommended offer: $180k (9.5% below list) — sets the bar for 1% rule.
- Cap rate 7.5% vs local median 2.8% in Muscle Shoals — top-decile yield for the area; either an underpriced asset or a hidden risk that comps aren't pricing in. Stress-test before assuming the spread holds.
Location & tenants
- Location reads 68/100 on livability (#68 in AL) — a middle-class / working-renter tenant base. Strengths: cost of living A+, housing A+, health & safety A; Watch: amenities F, commute F.
- Muscle Shoals City (urban): math 42% / reading 60% proficiency, ranked #11 of 129 in AL (top 8%) — acceptable for families but not a draw, mixed tenant base, ~2y average lease.
- Market conditions: 254 active listings in the ZIP; 1 comparable units currently listed for rent nearby; 91 units permitted in Colbert County in 2024 (0 in 5+ unit buildings).
Forward outlook
- Local home prices are declining (-3.0%/yr); year-one equity from $1k of loan paydown is wiped out by about $6k of value loss. Plan a longer hold.
- Colbert County population projected to shrink 7% by 2050 — rents likely to lag national; underwrite the cash flow, not the appreciation.
Negotiation context
- It's been on market 91 days — a 9% lower offer ($181k) is reasonable based on typical stale-listing flexibility.
- 2 sale attempts since 6y ago; this cycle's ask has dropped $41k (17%) from the opening price — seller is motivated, your offer sets the floor, not the list.
- Current owner paid $145k; 37% above their basis — modest negotiation headroom, anchor on the comps not their cost.
Risks & watch-outs
- Climate carrying-cost: extreme-heat days projected 7→20/yr by 2055 (HVAC capex compounding) — expect insurance premiums to compound above CPI over the hold.
Questions for the listing agent
- It's been on market 91 days. Have you received any prior offers? Is the seller open to a 10% concession, seller financing, or rate buy-down credit?
- Built in 1965 — when were the roof, HVAC, electrical panel, plumbing, and water heater last replaced?
- Why hasn't it sold? Are there any deal-killer items the seller is aware of (foundation, flood, title, zoning, code violations)?
- Is there a deadline driving the sale (1031 exchange, divorce, estate, relocation)? That informs how much negotiation room exists.
- Schools are B-rated — typically a magnet for longer-tenancy family renters. What's the average tenant stay here, and is there a school-zone premium baked into asking?
- What's the average days-on-market for RENTAL listings here right now (not sales)? A rising rental-DOM trend means longer vacancies and softer asking-rent achievability than the comps imply.
- What's the recent tenant-quality profile in this submarket — average credit score on applications, eviction rate, late-payment / NSF rate, and stable-employment percentage? A property-management company in the area should have these aggregated.
- How much new for-sale + rental construction is in the pipeline within 1–3 miles? Heavy new supply typically softens prices + rents 12–24 months out; constrained supply supports both.
Investment metrics
- 1% rule
- 0.90% ✗
- Cap rate
- 7.51%
- Cash-on-cash
- 4.34%
- DSCR
- 1.19
- GRM
- 9.2
CMA / ARV
- ARV (median comp)
- $262,172
- List price
- $199,000
- Delta
- -24.10%
- Verdict
- UNDERPRICED
- Comps
- 20 within 1.0 mi
Projected returns pro-forma
-3.0% appreciation · 3.0% rent growth · sell at horizon
- IRR
- -9.6%
- Equity multiple
- 0.65×
- Total profit
- $-19,486
- Equity at exit
- $29,672
- IRR
- -0.2%
- Equity multiple
- 0.99×
- Total profit
- $-726
- Equity at exit
- $17,206
Cash invested: $55,720 (down + closing). Projections, not guarantees.
Landlord ↔ Tenant lean methodology
- Overall (STATE)
- 90 Strongly Landlord-Friendly
- State Alabama
- 90 Strongly Landlord-Friendly · R+15
- County
- — inherits STATE
- City
- — inherits STATE
ZIP-level market 35661
- Active inventory
- 254
- Price-to-rent
- 9.2×
Monthly cashflow live
- Estimated rent
- $1,800 medium interval (Pro) →
- Mortgage (P&I)
- −$1,044
- Tax from tax record
- −$94 /mo · $1,129/yr
- Insurance
- −$83
- HOA
- −$0
- Vacancy / Maint / Mgmt
- −$378
- Net cashflow
- $201
Break-even live
UW: 25.0% down · 7.5% · 30yr · 1.5% tax · 5.0% vac · 8.0% maint · 8.0% mgmt
Financing live
Cash to close
- Down payment
- $49,750
- Closing costs
- $5,970
- Reserves months
- —
- Total cash needed
- —
Loan-product check · same deal, 3 products live
Conventional
25% down · 7.5% · 30yr
- Down + closing
- —
- Monthly P&I
- —
- Monthly cashflow
- —
- DSCR
- —
- Eligible?
- —
Personal DTI + credit; lowest rate.
DSCR
20% down · 8.5% · 30yr
- Down + closing
- —
- Monthly P&I
- —
- Monthly cashflow
- —
- DSCR
- —
- Eligible?
- —
No personal income docs; deal must DSCR.
Hard money
10% down · 12.0% · 12mo
- Down + closing
- —
- Monthly P&I
- —
- Monthly cashflow
- —
- DSCR
- —
- Eligible?
- —
Short-term bridge; refi at stabilization.
Rent comps 1 comps
| Address | Beds | Baths | Sqft | Rent | $/sqft | DOM | Units | Dist |
|---|---|---|---|---|---|---|---|---|
| 701 E 18th St Sheffield, AL | 4.0 | 2.5 | 2000 | $1,800 | $0.90 | 43d | 1 | 1.14mi |
Listing history 22 events
-
2026-06-19days on market $199,000 Active 91 DOM
-
2026-06-18days on market $199,000 Active 90 DOM
-
2026-06-17days on market $199,000 Active 89 DOM
-
2026-06-16days on market $199,000 Active 88 DOM
-
2026-06-15days on market $199,000 Active 87 DOM
-
2026-06-14days on market $199,000 Active 85 DOM
-
2026-06-13days on market $199,000 Active 84 DOM
-
2026-06-10days on market $199,000 Active 82 DOM
-
2026-06-09days on market $199,000 Active 81 DOM
-
2026-06-08days on market $199,000 Active 80 DOM
-
2026-06-07days on market $199,000 Active 79 DOM
-
2026-06-05days on market $199,000 Active 76 DOM
-
2026-06-03days on market $199,000 Active 75 DOM
-
2026-06-02days on market $199,000 Active 74 DOM
-
2026-06-01days on market $199,000 Active 73 DOM
-
2026-05-31days on market $199,000 Active 72 DOM
-
2026-05-30days on market $199,000 Active 71 DOM
-
2026-03-19$240,000 Active 430-char remark
Show marketing remark (430 chars)
Spacious home in Muscle Shoals with great potential! This property offers plenty of room for living and entertaining with generous size bedrooms. While the house needs some updates and TLC, it’s a fantastic opportunity to customize and make it your own. Conveniently located with easy access to local amenities, this home is perfect for buyers looking to invest and create their dream space. Buyer to verify all information.
-
2021-04-09soldstatus $145,000
-
2021-04-02soldstatus $145,000 210-char remark
Show marketing remark (210 chars)
This spacious home in the heart of Muscle Shoals boasts two living spaces, a large kitchen, 4 bedrooms and 3 full baths. With a little TLC, this home can be a beautiful showplace. This home is being sold AS-IS.
-
2020-10-20$149,900 210-char remark
Show marketing remark (210 chars)
This spacious home in the heart of Muscle Shoals boasts two living spaces, a large kitchen, 4 bedrooms and 3 full baths. With a little TLC, this home can be a beautiful showplace. This home is being sold AS-IS.
-
2020-09-03soldstatus $158,000
ⓘ Source: listings_history table (triggers on properties + properties_extension) + one-shot
backfill from property_details.listing_events for pre-trigger history.
Tax reassessment forecast AL · Resets to sale price
- Current annual tax
- $1,129 · $94/mo
- Projected year-2 tax
- $1,129 · $94/mo
- Expected delta
- $0/yr ($0/mo · 0.0%)
ⓘ Screening estimate from a state-policy table — verify with the county assessor before closing.
Climate risk First Street
- Flood 1/10 Low FEMA zone X (unshaded) · 0% chance over 30 yrs
- Wildfire 1/10 Low
- Heat 6/10 Major 7 d/yr ≥107°F today · 20 d/yr by 30 yrs out
- Wind 4/10 Moderate 22% chance of damaging wind over 30 yrs
- Air quality 1/10 Low 0 unhealthy d/yr today · 0 by 30 yrs out
Nearby sold comps map
Loading sold comps map…
Walkable amenities ~0.75 mi
Loading nearby amenities…
Taxation est. · year 1
- Rental income
- $21,600
- − Mortgage interest
- −$11,147
- − Property taxes
- −$1,129
- − Insurance
- −$995
- − Repairs & maintenance
- −$1,728
- − Management
- −$1,728
- − Depreciation
- −$5,789
- Taxable loss
- −$916
- Est. tax savings @ 24.0%
- +$220
- After-tax cash flow
- $2,637/yr
For passive investors: Depreciation is non-cash, so a rental often shows a tax loss while cash-flowing — sheltering income. Rental losses are passive: they offset passive income freely, and up to $25,000/yr can offset ordinary (W-2) income if you actively participate and your MAGI is under $100k (phasing out to $0 by $150k); unused losses carry forward. On sale, claimed depreciation is recaptured at up to 25%, and gains may owe capital-gains tax (a 1031 exchange can defer both). Figures are a year-1 estimate at your 24.0% rate — not tax advice; consult a CPA.
Schools (NCES district)
- District
- Muscle Shoals City
- NCES district ID
- 0102520
- Math proficiency
- 42% ▼ -28.00%
- Reading proficiency
- 60% ▼ -1.00%
- Median HH income
- $50,688
- Composite
- 43.61/100
- National rank
- #2969
- State rank
- #11 of 129 in AL
Livability — Muscle Shoals
- Score
- 68/100
- State rank
- #68
- US rank
- #9422
Category grades
Schools grade is shown separately in the Schools card above.
Census & demographics
- Census place
- Muscle Shoals, AL
- Population (ZIP)
- 18,957
Population outlook (Colbert County) Hauer SSP2
- Today (2025)
- 54,154 people
- By 2030
- 53,746 · -0.8%
- By 2040
- 52,431 · -3.2%
- By 2050
- 50,303 · -7.1%
- By 2075
- 44,789 · -17.3%
- By 2100
- 36,676 · -32.3%
Race, ethnicity, and origin ACS 2023
- Neighborhood character
- Predominantly White (78%)
- Race & ethnicity
- White 78% Black 14% Two or more races 5% Hispanic / Latino 5%
- Common ancestry
- Slovak 2% Serbian 1% Iranian 1%
- Foreign-born
- 2% · Canada
- Languages at home
- 97% English-only · Spanish 2% Other Indo-European 1%
Political lean MEDSL · Colbert
- 2024 margin
- Solid R (+46.4) · D 26.4% · R 72.8%
- 2008→2024 swing
- -26.2pp toward R · 2008: -20.3pp · 2024: -46.4pp
- All cycles
- 2024: R+46.4 2020: R+38.9 2016: R+38.3 2012: R+20.4 2008: R+20.3
Not yet ingested
- Civics
- —
Market trends
- HPI YoY
- ▼ -103.94%
- Current HPI
- 174.6414
- Rent YoY
- —
- Metro
- —
- State GDP YoY
- ▲ 2.94%
- F500 in state
- 4
Industry mix (Fortune 500 HQ in AL)
| Industry | F500 HQs | Revenue |
|---|---|---|
| Financial Services | 1 | $8B |
|
||
| Healthcare | 1 | $5B |
|
||
Price history
+51.9% since first listed5 events — show timeline
- 2026-03-19 Listed $240,000 SAARMLS
- 2021-04-09 Sold (Public Records) $145,000 Public Records
- 2021-04-02 Sold (MLS) $145,000 SAARMLS
- 2020-10-20 Listed $149,900 SAARMLS
- 2020-09-03 Sold (Public Records) $158,000 Public Records
Property tax history
+10.6%/yrLatest (2025): $1,129 · +7.0% YoY. Source: county tax records.
Cash-flow waterfall
monthlySold comps — $/sqft
last 12 mo · ≤1 miLoading sold comps…