133 Shelton Cir · Wadesboro, NC
Flood risk 1/10 · Minimal
- FEMA flood zone
- X (unshaded)
- Chance of flooding over 30 yrs
- 0.0%
- Est. flood insurance / yr
- $473 – $860
Fire risk 3/10 · Minor
- Est. fire insurance / yr
- $906 – $1,684
Heat risk 6/10 · Moderate
- Hot days now (above 106°F)
- 7 days/yr
- Hot days in 30 yrs
- 16 days/yr
Wind risk 6/10 · Moderate
- Chance of severe wind over 30 yrs
- 56.0%
Air-quality risk 2/10 · Minimal
- Unhealthy air days now
- 1 days/yr
- Unhealthy air days in 30 yrs
- 2 days/yr
Risk factors via First Street. Map © Google.
Why this score? — see what drove the C+ grade
The composite is a weighted blend of 9 inputs, each scored 0–100. Each bar is that input's sub-score; the figure is the points it added to the 100-point composite (weight × sub-score).
- Cash flow +20.0/30.0
- ARV discount +14.9/15.0
- Appreciation +10.0/10.0
- DSCR +6.4/10.0
- 1% rule +4.4/10.0
- Rent growth +2.5/5.0
- Condition / age +2.5/5.0
- Schools +2.1/10.0
- Livability +2.1/5.0
$184,900
🖨 Deal sheet 📄 Offer letter ✓ Due diligence
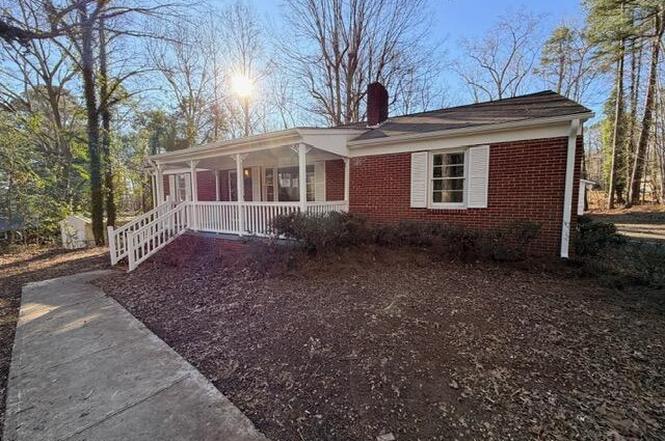
Listing remarks
Newly Listed Brick Ranch with Modern Updates. This Home Offers Fresh Paint, New Carpet throughout the living room, dining room, hallway and bedrooms and New Flooring in the Kitchen/Dining Area. Updated Cabinets and Countertops in The Kitchen. Newly Installed HVAC System and Gutters with Downspouts. Home is Nestled on 0.50 Acres and Secluded While Still being conveniently located Close to Town. Enjoy Front Porch Sitting on the Covered Front Porch or Cook Outs on The Spacious Back Deck, This Home also Offers A Walk Out Basement That Would be Perfect for Storage or A Man-Cave. 1 Car Garage Detached Garage Could also be used as a workshop. Put this on your MUST-SEE LIST!!
Key facts
- Covered front porch
- Spacious back deck
- Updated cabinets
Tags
Neighborhood map
What this means for you Summary
Snapshot
- This is a 3-bed/1.5-bath single-family listed at $185k.
Deal economics
- At list price, monthly cash flow is $228 ($3k/yr) — positive.
- The deal already cash-flows at list — no discount required.
- To meet the 1% rule (rent ≥ 1% of price), the offer needs to be $174k (5.9% below list).
- Recommended offer: $168k (9.0% below list) — sets the bar for market timing.
- Cap rate 7.8% vs local median 6.3% in Wadesboro — meaningfully above typical; check what's discounted (condition, days-on-market, listing class) to confirm the premium yield is real.
Location & tenants
- Location reads 41/100 on livability (#728 in NC) — a working-class tenant base; expect higher turnover. Strengths: cost of living A+; Watch: housing C-, crime F, amenities F.
- Anson County Schools (rural): math 20% / reading 32% proficiency, ranked #159 of 178 in NC (top 89%) — low school quality limits family demand, transient renter base, plan for 1-2y turnover; 67% free/reduced lunch — lower-income household profile, screen leases tightly.
- Zoned schools: Morven Elementary (math 8% / reading 17%, grade F, #1,362 of 1,410 statewide, top 97%, 155 students, 98% FRL); Anson Middle (math 16% / reading 31%, grade F, #402 of 475 statewide, top 85%, 701 students, 100% FRL); Anson High School (math 22% / reading 22%, grade F, #484 of 535 statewide, top 91%, 655 students, 98% FRL) — zoned schools average 99% FRL vs 67% district-wide (32 pts higher); higher-poverty schools than district average — tighter screening recommended.
- Market conditions: 85 active listings in the ZIP; 55 units permitted in Anson County in 2024 (0 in 5+ unit buildings).
Forward outlook
- In year one you build about $20k of equity ($1k loan paydown + $18k appreciation (10.0% local appreciation)).
- Anson County population projected at -24% by 2050 — secular population decline; favor cash flow + early exit over multi-decade hold.
- At projected returns (10.0% appreciation + 3.0% rent growth), your $52k cash investment doubles in ~3 years — after that, you're playing with house money.
- By year 2, paydown + projected appreciation supports a ~$32k cash-out refi (75% LTV) — recoverable capital for the next deal without selling this one.
Negotiation context
- It's been on market 120 days — a 9% lower offer ($168k) is reasonable based on typical stale-listing flexibility.
Risks & watch-outs
- Climate carrying-cost: major wind risk, 56% chance of damaging wind over 30y; extreme-heat days projected 7→16/yr by 2055 (HVAC capex compounding) — expect insurance premiums to compound above CPI over the hold.
Questions for the listing agent
- It's been on market 120 days. Have you received any prior offers? Is the seller open to a 9% concession, seller financing, or rate buy-down credit?
- Built in 1960 — when were the roof, HVAC, electrical panel, plumbing, and water heater last replaced?
- Why hasn't it sold? Are there any deal-killer items the seller is aware of (foundation, flood, title, zoning, code violations)?
- Is there a deadline driving the sale (1031 exchange, divorce, estate, relocation)? That informs how much negotiation room exists.
- Schools are F-rated, which usually means shorter tenancies and higher turnover. Who's the typical renter profile here, and what's been the actual vacancy rate?
- Crime grade is F in this area — have there been break-ins, vandalism, or insurance claims at this property in the last 3 years? What carrier currently insures it and at what premium?
- What's the average days-on-market for RENTAL listings here right now (not sales)? A rising rental-DOM trend means longer vacancies and softer asking-rent achievability than the comps imply.
- What's the recent tenant-quality profile in this submarket — average credit score on applications, eviction rate, late-payment / NSF rate, and stable-employment percentage? A property-management company in the area should have these aggregated.
- How much new for-sale + rental construction is in the pipeline within 1–3 miles? Heavy new supply typically softens prices + rents 12–24 months out; constrained supply supports both.
Investment metrics
- 1% rule
- 0.94% ✗
- Cap rate
- 7.77%
- Cash-on-cash
- 5.29%
- DSCR
- 1.24
- GRM
- 8.9
CMA / ARV
- ARV (on-the-fly)
- $221,116
- Comps found
- 4
Show comp detail 4 sales within ~0.75 mi
| Address | Dist | Beds/Ba | Sqft | Sold | Price | $/sf | Match |
|---|---|---|---|---|---|---|---|
| 503 Breslin St | 0.18mi | 3/2.0 | 1,590 (+7%) | 11mo | $220,000 | $138 | 69 |
| 311 Breslin St | 0.31mi | 3/2.0 | 1,445 (-3%) | 23mo | $215,000 | $149 | 60 |
| 200 Breslin St | 0.23mi | 3/2.0 | 1,310 (-12%) | 10mo | $199,900 | $153 | 60 |
| 506 E Wade St E | 0.29mi | 3/2.0 | 1,568 (+6%) | 23mo | $151,620 | $97 | 56 |
Match score weights: distance 35% · size 25% · config 20% · recency 20%. Top-matched comps best support the ARV.
Projected returns pro-forma
10.0% appreciation · 3.0% rent growth · sell at horizon
- IRR
- 28.1%
- Equity multiple
- 3.22×
- Total profit
- $115,183
- Equity at exit
- $166,573
- IRR
- 24.5%
- Equity multiple
- 7.33×
- Total profit
- $327,656
- Equity at exit
- $359,220
Cash invested: $51,772 (down + closing). Projections, not guarantees.
Landlord ↔ Tenant lean methodology
- Overall (STATE)
- 85 Strongly Landlord-Friendly
- State North Carolina
- 85 Strongly Landlord-Friendly · R+3
- County
- — inherits STATE
- City
- — inherits STATE
ZIP-level market 28170
- Home prices YoY
- 5.8%
- Active inventory
- 85
- Price-to-rent
- 8.9×
Monthly cashflow live
- Estimated rent
- $1,740 medium interval (Pro) →
- Mortgage (P&I)
- −$970
- Tax from tax record
- −$100 /mo · $1,195/yr
- Insurance
- −$77
- HOA
- −$0
- Vacancy / Maint / Mgmt
- −$365
- Net cashflow
- $228
Break-even live
Sensitivity live
| Price | -10% $333 | -5% $281 | +0% $228 | +5% $176 | +10% $124 |
|---|---|---|---|---|---|
| Rent | -10% $91 | -5% $160 | +0% $228 | +5% $297 | +10% $366 |
| Rate | -1.0pp $321 | -0.5pp $275 | base $228 | +0.5pp $180 | +1.0pp $132 |
UW: 25.0% down · 7.5% · 30yr · 1.5% tax · 5.0% vac · 8.0% maint · 8.0% mgmt
Financing live
Cash to close
- Down payment
- $46,225
- Closing costs
- $5,547
- Reserves months
- —
- Total cash needed
- —
Loan-product check · same deal, 3 products live
Conventional
25% down · 7.5% · 30yr
- Down + closing
- —
- Monthly P&I
- —
- Monthly cashflow
- —
- DSCR
- —
- Eligible?
- —
Personal DTI + credit; lowest rate.
DSCR
20% down · 8.5% · 30yr
- Down + closing
- —
- Monthly P&I
- —
- Monthly cashflow
- —
- DSCR
- —
- Eligible?
- —
No personal income docs; deal must DSCR.
Hard money
10% down · 12.0% · 12mo
- Down + closing
- —
- Monthly P&I
- —
- Monthly cashflow
- —
- DSCR
- —
- Eligible?
- —
Short-term bridge; refi at stabilization.
Listing history 16 events
-
2026-06-18days on market $184,900 Active 120 DOM
-
2026-06-17days on market $184,900 Active 119 DOM
-
2026-06-16days on market $184,900 Active 118 DOM
-
2026-06-15days on market $184,900 Active 117 DOM
-
2026-06-13days on market $184,900 Active 115 DOM
-
2026-06-12days on market $184,900 Active 114 DOM
-
2026-06-09days on market $184,900 Active 111 DOM
-
2026-06-08days on market $184,900 Active 110 DOM
-
2026-06-07days on market $184,900 Active 109 DOM
-
2026-06-07days on market $184,900 Active 108 DOM
-
2026-06-04days on market $184,900 Active 105 DOM
-
2026-06-02days on market $184,900 Active 104 DOM
-
2026-06-01days on market $184,900 Active 103 DOM
-
2026-05-31days on market $184,900 Active 102 DOM
-
2026-03-24price $194,900
-
2026-02-18$199,000 Active
ⓘ Source: listings_history table (triggers on properties + properties_extension) + one-shot
backfill from property_details.listing_events for pre-trigger history.
Tax reassessment forecast NC · Resets to sale price
- Current annual tax
- $1,195 · $100/mo
- Projected year-2 tax
- $1,516 · $126/mo
- Expected delta
- +$321/yr (+$27/mo · 26.9%)
ⓘ Screening estimate from a state-policy table — verify with the county assessor before closing.
Climate risk First Street
- Flood 1/10 Low FEMA zone X (unshaded) · 0% chance over 30 yrs
- Wildfire 3/10 Moderate
- Heat 6/10 Major 7 d/yr ≥106°F today · 16 d/yr by 30 yrs out
- Wind 6/10 Major 56% chance of damaging wind over 30 yrs
- Air quality 2/10 Low 1 unhealthy d/yr today · 2 by 30 yrs out
Nearby sold comps map
Loading sold comps map…
Walkable amenities ~0.75 mi
Loading nearby amenities…
Taxation est. · year 1
- Rental income
- $20,879
- − Mortgage interest
- −$10,357
- − Property taxes
- −$1,195
- − Insurance
- −$924
- − Repairs & maintenance
- −$1,670
- − Management
- −$1,670
- − Depreciation
- −$5,379
- Taxable loss
- −$318
- Est. tax savings @ 24.0%
- +$76
- After-tax cash flow
- $2,815/yr
For passive investors: Depreciation is non-cash, so a rental often shows a tax loss while cash-flowing — sheltering income. Rental losses are passive: they offset passive income freely, and up to $25,000/yr can offset ordinary (W-2) income if you actively participate and your MAGI is under $100k (phasing out to $0 by $150k); unused losses carry forward. On sale, claimed depreciation is recaptured at up to 25%, and gains may owe capital-gains tax (a 1031 exchange can defer both). Figures are a year-1 estimate at your 24.0% rate — not tax advice; consult a CPA.
Schools (NCES district)
- District
- Anson County Schools
- NCES district ID
- 3700180
- Math proficiency
- 20% ▼ -7.00%
- Reading proficiency
- 32% ▼ -1.00%
- Median HH income
- $34,961
- Composite
- 21.41/100
- National rank
- #8348
- State rank
- #159 of 178 in NC
Livability — Wadesboro
- Score
- 41/100
- State rank
- #728
- US rank
- #27112
Category grades
Schools grade is shown separately in the Schools card above.
Census & demographics
- Census place
- Wadesboro, NC
- Population (ZIP)
- 9,595
Population outlook (Anson County) Hauer SSP2
- Today (2025)
- 23,572 people
- By 2030
- 22,384 · -5.0%
- By 2040
- 19,976 · -15.3%
- By 2050
- 17,803 · -24.5%
- By 2075
- 13,839 · -41.3%
- By 2100
- 10,890 · -53.8%
Race, ethnicity, and origin ACS 2023
- Neighborhood character
- Diverse neighborhood (Simpson 0.57)
- Race & ethnicity
- Black 53% White 38% Two or more races 4% Asian 3% Hispanic / Latino 2%
- Common ancestry
- Slovak 1% Russian 1% Serbian 1%
- Foreign-born
- 4% · Canada, South Korea
- Languages at home
- 95% English-only · Spanish 2% Other Asian/Pacific 1% Korean 1%
Political lean MEDSL · Anson
- 2024 margin
- Toss-up / Even · D 48.4% · R 50.9%
- 2008→2024 swing
- -23.5pp toward R · 2008: 20.9pp · 2024: -2.5pp
- All cycles
- 2024: R+2.5 2020: D+4.2 2016: D+12.6 2012: D+25.0 2008: D+20.9
Not yet ingested
- Civics
- —
Market trends
- HPI YoY
- ▲ 12.62%
- Current HPI
- 228.7798
- Rent YoY
- —
- Metro
- —
- State GDP YoY
- ▲ 3.28%
- F500 in state
- 26
Industry mix (Fortune 500 HQ in NC)
| Industry | F500 HQs | Revenue |
|---|---|---|
| Financial Services | 2 | $213B |
|
||
| Retail | 2 | $95B |
|
||
| Industrial Conglomerate | 1 | $38B |
|
||
| Metals / Steel | 1 | $35B |
|
||
| Utilities | 1 | $30B |
|
||
| Industrial Machinery | 1 | $19B |
|
||
Price history
-2.1% since first listed2 events — show timeline
- 2026-03-24 Price Changed $194,900 Hive MLS
- 2026-02-18 Listed $199,000 Hive MLS
Property tax history
+4.7%/yrLatest (2025): $1,195 · +4.5% YoY. Source: county tax records.
Cash-flow waterfall
monthlySold comps — $/sqft
last 12 mo · ≤1 miLoading sold comps…