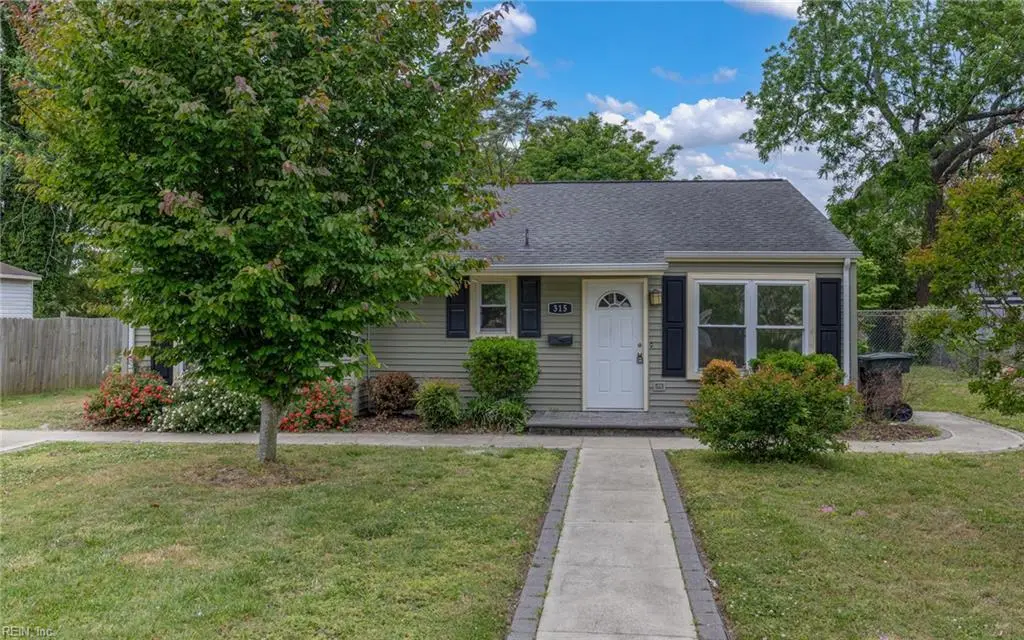
315 Mary St · Hampton, VA
Flood risk 5/10 · Moderate
- FEMA flood zone
- X (unshaded)
- Chance of flooding over 30 yrs
- 0.43%
- Est. flood insurance / yr
- $507 – $1,088
Fire risk 1/10 · Minimal
- Est. fire insurance / yr
- $666 – $1,236
Heat risk 9/10 · Severe
- Hot days now (above 105°F)
- 7 days/yr
- Hot days in 30 yrs
- 17 days/yr
Wind risk 8/10 · Major
- Chance of severe wind over 30 yrs
- 80.0%
Air-quality risk 2/10 · Minimal
- Unhealthy air days now
- 2 days/yr
- Unhealthy air days in 30 yrs
- 2 days/yr
Risk factors via First Street. Map © Google.
Why this score? — see what drove the D+ grade
The composite is a weighted blend of 9 inputs, each scored 0–100. Each bar is that input's sub-score; the figure is the points it added to the 100-point composite (weight × sub-score).
- Cash flow +13.5/30.0
- ARV discount +11.8/15.0
- Schools +5.5/10.0
- DSCR +4.1/10.0
- Livability +3.8/5.0
- 1% rule +3.2/10.0
- Rent growth +2.5/5.0
- Condition / age +2.5/5.0
- Appreciation +0.0/10.0
$250,000
🖨 Deal sheet (PDF) 📄 Offer letter ✓ Due diligence
Listing remarks
Located in the Buckroe/Lochaven area of Hampton, this updated ranch-style home offers convenient single-level living with a functional floor plan and spacious living areas. The kitchen has been updated with modern cabinetry, countertops, fixtures, and appliances, creating a clean and inviting space for everyday living. Additional interior updates completed over the years include refreshed flooring, paint, trim, windows, and remodeled bathrooms with updated vanities and fixtures. The primary bedroom includes an attached bath, while the additional bedrooms offer flexibility for guests, a home office, or hobbies. Outside, enjoy a quiet no exit street and a low-maintenance exterior.
Key facts
- Modern cabinetry
- Updated vanities
- Cul-de-sac setting
Tags
Property features AI
Finance
- HOA & community: No HOA fees reported
Exterior
- Parking: Off-street parking; Driveway space
- Utilities: City/County water; City/County sewer; Electric water heater
- Home design: Detached ranch-style home; Single-story
- Construction: Slab foundation; Asphalt shingle roof
- Exterior features: Vinyl siding; Back yard fenced with chain-link fence; Lot dimensions approximately 70' x 100' (0.1607 acres)
Interior
- Kitchen: Electric range; Microwave; Breakfast area
- Bedrooms: Master bedroom (1st floor); First floor bedroom; Total rooms: 7; Attic; Master bedroom with bath
- Flooring: Carpet; Vinyl
- Bathrooms: 1 full bathroom; 1 half bathroom
- Heating & cooling: Heat pump with electric backup; Forced hot air; Central air
- Interior features: Cable hookup; Scuttle access
- Laundry & utility: Washer hookup; Dryer hookup; Washer; Dryer; Utility room
Neighborhood map
What this means for you Summary
Snapshot
- This is a 3-bed/1.5-bath single-family listed at $250k.
Deal economics
- At list price, monthly cash flow is $8 ($99/yr) — positive.
- The deal already cash-flows at list — no discount required.
- To meet the 1% rule (rent ≥ 1% of price), the offer needs to be $206k (17.5% below list).
- Recommended offer: $206k (17.5% below list) — sets the bar for 1% rule.
- Cap rate 6.3% vs local median 4.5% in Hampton — top-decile yield for the area; either an underpriced asset or a hidden risk that comps aren't pricing in. Stress-test before assuming the spread holds.
Location & tenants
- Location reads 75/100 on livability (#133 in VA, #4,302 nationally) — a middle-class / working-renter tenant base. Strengths: housing A+, health & safety A+, cost of living A; Watch: crime C-, amenities D+, commute F.
- Hampton City Public School District (urban): math 60% / reading 70% proficiency, ranked #40 of 131 in VA (top 30%) — acceptable for families but not a draw, mixed tenant base, ~2y average lease.
- Zoned schools: Captain John Smith Elementary (math 42% / reading 57%, grade D, #742 of 1,108 statewide, top 70%, 393 students, 82% FRL); Benjamin Syms Middle (math 62% / reading 64%, grade B+, #134 of 342 statewide, top 40%, 897 students, 69% FRL); Phoebus High (math 57% / reading 76%, grade B, #195 of 319 statewide, top 62%, 1,365 students, 86% FRL) — zoned schools average 79% FRL vs 49% district-wide (30 pts higher); higher-poverty schools than district average — tighter screening recommended.
- Market conditions: 97 active listings in the ZIP; 22 comparable units currently listed for rent nearby; rentals at typical pace (median 26d on market — plan ~3-4 weeks tenant-placement turnaround); 45% of comp listings sitting > 30 days — soft ceiling on asking rent; solid renter incomes; 68 units permitted in Hampton city in 2024 (0 in 5+ unit buildings).
Forward outlook
- Local home prices are declining (-3.0%/yr); year-one equity from $2k of loan paydown is wiped out by about $8k of value loss. Plan a longer hold.
- Hampton County population projected at -13% by 2050 — secular population decline; favor cash flow + early exit over multi-decade hold.
Negotiation context
- It's been on market 17 days — a 2% lower offer ($246k) is reasonable based on typical stale-listing flexibility.
- Current owner paid $83k; list at $250k implies a 201% gain — meaningful room to come down on a strong offer.
Risks & watch-outs
- Climate carrying-cost: moderate flood risk; severe wind risk, 80% chance of damaging wind over 30y; extreme-heat days projected 7→17/yr by 2055 (HVAC capex compounding) — expect insurance premiums to compound above CPI over the hold.
Questions for the listing agent
- Is there a deadline driving the sale (1031 exchange, divorce, estate, relocation)? That informs how much negotiation room exists.
- Schools are B-rated — typically a magnet for longer-tenancy family renters. What's the average tenant stay here, and is there a school-zone premium baked into asking?
- The area grade is low — what's the realistic commute time and amenity access for the typical tenant pool here? Any planned neighborhood developments (good or bad) we should know about?
- What's the average days-on-market for RENTAL listings here right now (not sales)? A rising rental-DOM trend means longer vacancies and softer asking-rent achievability than the comps imply.
- What's the recent tenant-quality profile in this submarket — average credit score on applications, eviction rate, late-payment / NSF rate, and stable-employment percentage? A property-management company in the area should have these aggregated.
- How much new for-sale + rental construction is in the pipeline within 1–3 miles? Heavy new supply typically softens prices + rents 12–24 months out; constrained supply supports both.
Investment metrics
- 1% rule
- 0.82% ✗
- Cap rate
- 6.33%
- Cash-on-cash
- 0.14%
- DSCR
- 1.01
- GRM
- 10.1
CMA / ARV
- ARV (on-the-fly)
- $276,100
- Comps found
- 12
Show comp detail 12 sales within ~0.75 mi
| Address | Dist | Beds/Ba | Sqft | Sold | Price | $/sf | Match |
|---|---|---|---|---|---|---|---|
| 731 Burgess Ave | 0.28mi | 3/1.5 | 1,300 (+4%) | 3mo | $268,300 | $206 | 78 |
| 405 Buckroe Ave | 0.35mi | 3/2.0 | 1,200 (-4%) | 2mo | $342,000 | $285 | 73 |
| 532 Slater Ave | 0.04mi | 3/2.0 | 1,100 (-12%) | 4mo | $257,000 | $234 | 72 |
| 733 Burgess Ave | 0.28mi | 3/2.0 | 1,161 (-8%) | 3mo | $170,000 | $146 | 70 |
| 1938 Long Green Ln | 0.62mi | 3/2.0 | 1,250 (-0%) | 2mo | $289,500 | $232 | 67 |
| 112 S 2nd St | 0.41mi | 3/1.0 | 1,166 (-7%) | 0mo | $345,000 | $296 | 67 |
| 9 Rust St | 0.27mi | 3/2.0 | 1,391 (+11%) | 2mo | $305,500 | $220 | 66 |
| 1914 Zinzer Rd | 0.68mi | 3/2.0 | 1,250 (-0%) | 4mo | $292,000 | $234 | 62 |
| 220 N Fifth St | 0.53mi | 4/2.5 (+1) | 1,307 (+4%) | 1mo | $100,000 | $77 | 58 |
| 7 Farrington Pl | 0.70mi | 3/1.0 | 1,200 (-4%) | 1mo | $150,000 | $125 | 57 |
| 231 N Fifth St | 0.58mi | 3/1.0 | 1,339 (+7%) | 3mo | $275,000 | $205 | 57 |
| 2006 Rawood Dr | 0.65mi | 3/2.0 | 1,400 (+12%) | 4mo | $279,000 | $199 | 44 |
Match score weights: distance 35% · size 25% · config 20% · recency 20%. Top-matched comps best support the ARV.
Projected returns pro-forma
-3.0% appreciation · 3.0% rent growth · sell at horizon
- IRR
- -16.1%
- Equity multiple
- 0.43×
- Total profit
- $-40,022
- Equity at exit
- $37,276
- IRR
- -7.8%
- Equity multiple
- 0.51×
- Total profit
- $-34,317
- Equity at exit
- $21,615
Cash invested: $70,000 (down + closing). Projections, not guarantees.
Landlord ↔ Tenant lean methodology
- Overall (STATE)
- 55 Moderately Landlord-Leaning
- State Virginia
- 55 Moderately Landlord-Leaning · D+2
- County
- — inherits STATE
- City
- — inherits STATE
ZIP-level market 23664
- Home prices YoY
- -23.6%
- Active inventory
- 97
- Price-to-rent
- 10.1×
Monthly cashflow live
- Estimated rent
- $2,062 high interval (Pro) →
- Mortgage (P&I)
- −$1,311
- Tax from tax record
- −$205 /mo · $2,462/yr
- Insurance
- −$104
- HOA
- −$0
- Vacancy / Maint / Mgmt
- −$433
- Net cashflow
- $8
Break-even live
Sensitivity live
| Price | -10% $150 | -5% $79 | +0% $8 | +5% $-63 | +10% $-133 |
|---|---|---|---|---|---|
| Rent | -10% $-155 | -5% $-73 | +0% $8 | +5% $90 | +10% $171 |
| Rate | -1.0pp $134 | -0.5pp $72 | base $8 | +0.5pp $-57 | +1.0pp $-122 |
UW: 25.0% down · 7.5% · 30yr · 1.5% tax · 5.0% vac · 8.0% maint · 8.0% mgmt
Financing live
Cash to close
- Down payment
- $62,500
- Closing costs
- $7,500
- Reserves months
- —
- Total cash needed
- —
Loan-product check · same deal, 3 products live
Conventional
25% down · 7.5% · 30yr
- Down + closing
- —
- Monthly P&I
- —
- Monthly cashflow
- —
- DSCR
- —
- Eligible?
- —
Personal DTI + credit; lowest rate.
DSCR
20% down · 8.5% · 30yr
- Down + closing
- —
- Monthly P&I
- —
- Monthly cashflow
- —
- DSCR
- —
- Eligible?
- —
No personal income docs; deal must DSCR.
Hard money
10% down · 12.0% · 12mo
- Down + closing
- —
- Monthly P&I
- —
- Monthly cashflow
- —
- DSCR
- —
- Eligible?
- —
Short-term bridge; refi at stabilization.
Rent comps 22 comps
| Address | Beds | Baths | Sqft | Rent | $/sqft | DOM | Units | Dist |
|---|---|---|---|---|---|---|---|---|
| 311 Atlantic Ave Unit 1533635P Hampton, VA | 4.0 | 2.5 | 1506 | $6,554 | $4.35 | 9d | 1 | 0.13mi |
| 1665 N Mallory St Hampton, VA | 2.0 | 1.0 | 1250 | $1,785 | $1.43 | 45d | 1 | 0.13mi |
| 229 Atlantic Ave Hampton, VA | 2.0 | 1.0 | 1170 | $1,600 | $1.37 | 14d | 1 | 0.19mi |
| 2010 E Pembroke Ave Hampton, VA | 2.0 | 1.0 | 900 | $1,150 | $1.28 | 5d | 1 | 0.26mi |
| 216 S 2nd St Hampton, VA | 2.0 | 2.0 | 1429 | $2,395 | $1.68 | 23d | 1 | 0.30mi |
| 1805 Nickerson Blvd Hampton, VA | 3.0 | 1.5 | 1393 | $1,695 | $1.22 | 45d | 1 | 0.45mi |
| 2304 Burnette Dr Hampton, VA | 4.0 | 2.0 | 1322 | $2,100 | $1.59 | 16d | 1 | 0.52mi |
| 203 N First St Unit A Hampton, VA | 2.0 | 1.5 | 1406 | $2,900 | $2.06 | 45d | 1 | 0.58mi |
| 334 N 1st St Hampton, VA | 2.0 | 1.5 | 1200 | $2,495 | $2.08 | 16d | 1 | 0.68mi |
| 2109 Newton Rd Hampton, VA | 2.0–4.0 | 1.0–1.5 | 1700 | $2,065 | $1.21 | 3d | 3 | 0.79mi |
| 1210 Pansy St Hampton, VA | 2.0 | 2.0 | 1409 | $2,000 | $1.42 | 45d | 1 | 0.94mi |
| 2000 Neville Cir Hampton, VA | 3.0 | 1.0 | 1100 | $1,750 | $1.59 | 45d | 1 | 0.97mi |
| 10 Whipple Dr Hampton, VA | 4.0 | 2.5 | 1564 | $2,300 | $1.47 | 45d | 1 | 1.08mi |
| 29 Glascow Way Hampton, VA | 3.0 | 1.5 | 1382 | $2,200 | $1.59 | 16d | 1 | 1.11mi |
| 1802 Moger Dr Hampton, VA | 3.0 | 1.0 | 900 | $1,700 | $1.89 | 14d | 1 | 1.13mi |
| 1026 High Dunes Quay Hampton, VA | 3.0 | 2.0 | 1216 | $2,100 | $1.73 | 25d | 1 | 1.14mi |
| 2001 Grimes Rd Hampton, VA | 4.0 | 2.0 | 1430 | $2,100 | $1.47 | 4d | 1 | 1.16mi |
| 11 Camellia Ln Hampton, VA | 3.0 | 2.5 | 1650 | $2,400 | $1.45 | 45d | 1 | 1.18mi |
| 244 Loch Cir Hampton, VA | 3.0 | 2.5 | 1440 | $1,850 | $1.28 | 45d | 1 | 1.19mi |
| 949 N Mallory St Hampton, VA | 2.0 | 1.5 | 1054 | $1,250 | $1.19 | 3d | 1 | 1.23mi |
| 5 Lacrosse St Hampton, VA | 3.0 | 2.5 | 1612 | $2,500 | $1.55 | 45d | 1 | 1.39mi |
| 102 Silver Isles Blvd Hampton, VA | 3.0 | 2.0 | 1025 | $1,900 | $1.85 | 45d | 1 | 1.41mi |
Listing history 5 events
-
2026-05-13historical Active Under Contract
-
2026-05-09$250,000 Active
-
2008-02-21soldstatus $83,000
-
2003-05-01soldstatus $71,000
-
1982-04-01soldstatus $42,953
ⓘ Source: listings_history table (triggers on properties + properties_extension) + one-shot
backfill from property_details.listing_events for pre-trigger history.
Tax reassessment forecast VA · Resets to sale price
- Current annual tax
- $2,462 · $205/mo
- Projected year-2 tax
- $2,462 · $205/mo
- Expected delta
- $0/yr ($0/mo · 0.0%)
ⓘ Screening estimate from a state-policy table — verify with the county assessor before closing.
Climate risk First Street
- Flood 5/10 Major FEMA zone X (unshaded) · 43% chance over 30 yrs
- Wildfire 1/10 Low
- Heat 9/10 Extreme 7 d/yr ≥105°F today · 17 d/yr by 30 yrs out
- Wind 8/10 Severe 80% chance of damaging wind over 30 yrs
- Air quality 2/10 Low 2 unhealthy d/yr today · 2 by 30 yrs out
Nearby sold comps map
Loading sold comps map…
Walkable amenities ~0.75 mi
Loading nearby amenities…
Taxation est. · year 1
- Rental income
- $24,738
- − Mortgage interest
- −$14,004
- − Property taxes
- −$2,462
- − Insurance
- −$1,250
- − Repairs & maintenance
- −$1,979
- − Management
- −$1,979
- − Depreciation
- −$7,273
- Taxable loss
- −$4,209
- Est. tax savings @ 24.0%
- +$1,010
- After-tax cash flow
- $1,109/yr
For passive investors: Depreciation is non-cash, so a rental often shows a tax loss while cash-flowing — sheltering income. Rental losses are passive: they offset passive income freely, and up to $25,000/yr can offset ordinary (W-2) income if you actively participate and your MAGI is under $100k (phasing out to $0 by $150k); unused losses carry forward. On sale, claimed depreciation is recaptured at up to 25%, and gains may owe capital-gains tax (a 1031 exchange can defer both). Figures are a year-1 estimate at your 24.0% rate — not tax advice; consult a CPA.
Schools (NCES district)
- District
- Hampton City Public School District
- NCES district ID
- 5101800
- Math proficiency
- 60% ▼ -21.00%
- Reading proficiency
- 70% ▼ -4.00%
- Median HH income
- $50,089
- Composite
- 55.19/100
- National rank
- #1272
- State rank
- #40 of 131 in VA
Livability — Hampton
- Score
- 75/100
- State rank
- #133
- US rank
- #4302
Category grades
Schools grade is shown separately in the Schools card above.
Census & demographics
- Census place
- Hampton, VA
- County
- Hampton City · 132,421 people
- City population
- 132,421
- Metro
- Virginia Beach-Norfolk-Newport News, VA-NC
- Population (ZIP)
- 9,643
- Household income
- $87,412
- Rent vs Own
- Severe rent burden
- 394.0
Population outlook (Hampton County) Hauer SSP2
- Today (2025)
- 134,055 people
- By 2030
- 131,753 · -1.7%
- By 2040
- 125,017 · -6.7%
- By 2050
- 116,825 · -12.9%
- By 2075
- 97,033 · -27.6%
- By 2100
- 76,188 · -43.2%
Race, ethnicity, and origin ACS 2023
- Neighborhood character
- Predominantly White (67%)
- Race & ethnicity
- White 67% Black 24% Two or more races 4% Hispanic / Latino 3%
- Common ancestry
- Slovak 2% Lithuanian 2% Italian 2%
- Foreign-born
- 3% · Canada, Guatemala
- Languages at home
- 97% English-only · Arabic 1% Spanish 1%
Political lean MEDSL · Hampton
- 2024 margin
- Solid D (+39.9) · D 69.2% · R 29.4% · Other 1.4%
- 2008→2024 swing
- +1.0pp no change · 2008: 38.9pp · 2024: 39.9pp
- All cycles
- 2024: D+39.9 2020: D+42.2 2016: D+37.8 2012: D+45.4 2008: D+38.9
Not yet ingested
- Civics
- —
Market trends
- HPI YoY
- ▼ -73.71%
- Current HPI
- 238.491
- Rent YoY
- —
- Metro
- Virginia Beach-Norfolk-Newport News, VA-NC
- State GDP YoY
- ▲ 2.40%
- F500 in state
- 50
Industry mix (Fortune 500 HQ in VA)
| Industry | F500 HQs | Revenue |
|---|---|---|
| Aerospace / Defense | 4 | $236B |
|
||
| Technology / Defense | 3 | $32B |
|
||
| Financial Services | 2 | $176B |
|
||
| Utilities | 2 | $27B |
|
||
| Insurance | 2 | $25B |
|
||
| Technology | 2 | $15B |
|
||
Price history
+482.0% since first listed5 events — show timeline
- 2026-05-13 Contingent — REINMLS
- 2026-05-09 Listed $250,000 REINMLS
- 2008-02-21 Sold (Public Records) $83,000 Public Records
- 2003-05-01 Sold (Public Records) $71,000 Public Records
- 1982-04-01 Sold (Public Records) $42,953 Public Records
Property tax history
+9.1%/yrLatest (2025): $2,462 · -0.9% YoY. Source: county tax records.
Cash-flow waterfall
monthlySold comps — $/sqft
last 12 mo · ≤1 miLoading sold comps…