 🏷️ Likely Rental
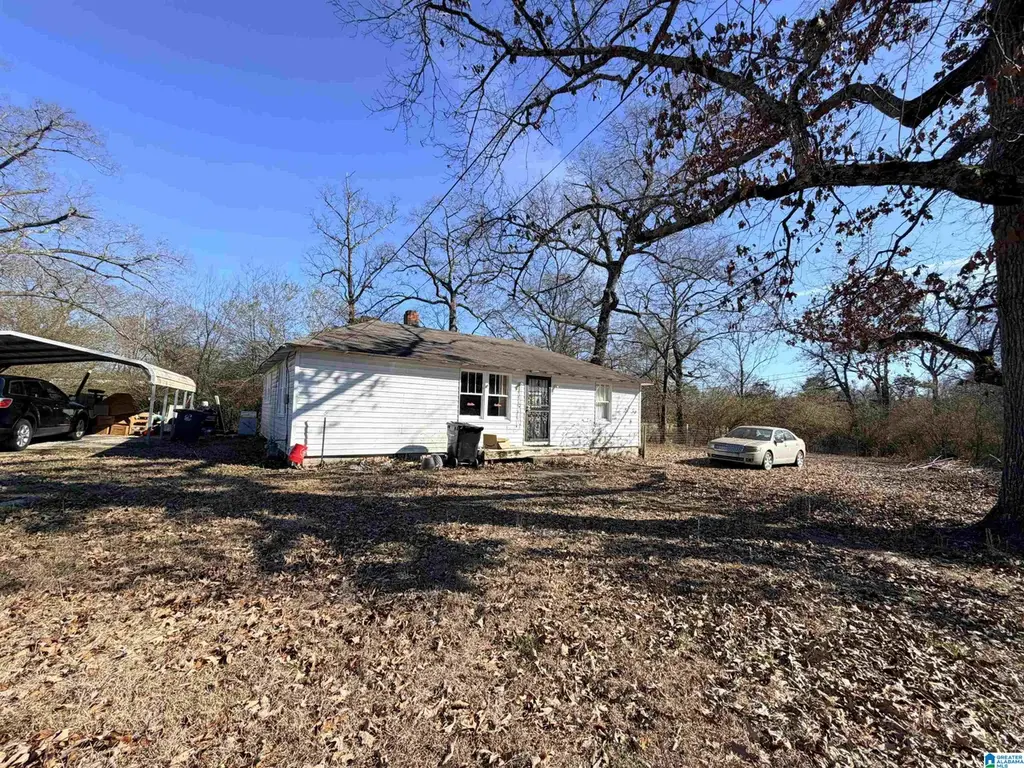
6416 Woodberry Ln · McCalla, AL
Flood risk 1/10 · Minimal
- FEMA flood zone
- X (unshaded)
- Chance of flooding over 30 yrs
- 0.0%
- Est. flood insurance / yr
- $507 – $1,088
Fire risk 4/10 · Minor
- Est. fire insurance / yr
- $916 – $1,700
Heat risk 6/10 · Moderate
- Hot days now (above 108°F)
- 7 days/yr
- Hot days in 30 yrs
- 19 days/yr
Wind risk 6/10 · Moderate
- Chance of severe wind over 30 yrs
- 55.0%
Air-quality risk 2/10 · Minimal
- Unhealthy air days now
- 2 days/yr
- Unhealthy air days in 30 yrs
- 2 days/yr
Risk factors via First Street. Map © Google.
Why this score? — see what drove the B- grade
The composite is a weighted blend of 9 inputs, each scored 0–100. Each bar is that input's sub-score; the figure is the points it added to the 100-point composite (weight × sub-score).
- Cash flow +30.0/30.0
- 1% rule +10.0/10.0
- DSCR +10.0/10.0
- ARV discount +7.5/15.0
- Rent growth +5.0/5.0
- Livability +2.5/5.0
- Condition / age +2.5/5.0
- Schools +1.8/10.0
- Appreciation +0.0/10.0
$90,000
🖨 Deal sheet (PDF) 📄 Offer letter ✓ Due diligence
Listing remarks MLS
Investor opportunity! This 3 bed, 1 bath property offers strong value-add potential. Currently tenant-occupied, with tenant expected to vacate prior to closing. Great opportunity for a flip or rental addition. Being sold as-is.
Key facts
- 1 acre lot
- Parking
- Built 1950
Neighborhood map
What this means for you Summary
Snapshot
- This is a 3-bed/1.0-bath single-family listed at $90k.
Deal economics
- At list price, monthly cash flow is $918 ($11k/yr) — positive.
- The deal already cash-flows at list — no discount required.
- Meets the 1% rule at list price ($2k rent vs $90k).
- Recommended offer: $82k (9.0% below list) — sets the bar for market timing.
- Cap rate 18.5% vs local median 4.5% in McCalla — top-decile yield for the area; either an underpriced asset or a hidden risk that comps aren't pricing in. Stress-test before assuming the spread holds.
Location & tenants
- Location reads: area grade B — affects rentability + tenant quality, not the cash-flow math above.
- Jefferson County (suburban): math 9% / reading 32% proficiency, ranked #104 of 129 in AL (top 81%) — low school quality limits family demand, transient renter base, plan for 1-2y turnover.
- Market conditions: Rents rising fast (+14.8%/yr); 311 active listings in the ZIP; 1 comparable units currently listed for rent nearby; solid renter incomes; 2,114 units permitted in Jefferson County in 2024 (556 in 5+ unit buildings).
Forward outlook
- Local home prices are declining (-3.0%/yr); year-one equity from $622 of loan paydown is wiped out by about $3k of value loss. Plan a longer hold.
- Jefferson County population projected to shrink 4% by 2050 — rents likely to lag national; underwrite the cash flow, not the appreciation.
- At projected returns (-3.0% appreciation + 8.0% rent growth), your $25k cash investment doubles in ~3 years — after that, you're playing with house money.
Negotiation context
- It's been on market 100 days — a 9% lower offer ($82k) is reasonable based on typical stale-listing flexibility.
- 2 sale attempts with the ask held roughly flat each time — persistent listings suggest the price (not the market) is what's stuck; bring a comps-based counter.
- Current owner paid $69k; 30% above their basis — modest negotiation headroom, anchor on the comps not their cost.
Risks & watch-outs
- Watch-outs: built in 1950 — expect roof / HVAC / electrical / plumbing capex.
- Climate carrying-cost: major wind risk, 55% chance of damaging wind over 30y; extreme-heat days projected 7→19/yr by 2055 (HVAC capex compounding) — expect insurance premiums to compound above CPI over the hold.
Questions for the listing agent
- It's been on market 100 days. Have you received any prior offers? Is the seller open to a 9% concession, seller financing, or rate buy-down credit?
- Built in 1950 — when were the roof, HVAC, electrical panel, plumbing, and water heater last replaced?
- Why hasn't it sold? Are there any deal-killer items the seller is aware of (foundation, flood, title, zoning, code violations)?
- Is there a deadline driving the sale (1031 exchange, divorce, estate, relocation)? That informs how much negotiation room exists.
- What's the average days-on-market for RENTAL listings here right now (not sales)? A rising rental-DOM trend means longer vacancies and softer asking-rent achievability than the comps imply.
- What's the recent tenant-quality profile in this submarket — average credit score on applications, eviction rate, late-payment / NSF rate, and stable-employment percentage? A property-management company in the area should have these aggregated.
- How much new for-sale + rental construction is in the pipeline within 1–3 miles? Heavy new supply typically softens prices + rents 12–24 months out; constrained supply supports both.
Investment metrics
- 1% rule
- 2.09% ✓
- Cap rate
- 18.54%
- Cash-on-cash
- 43.73%
- DSCR
- 2.95
- GRM
- 4.0
CMA / ARV
- ARV (median comp)
- $282,659
- List price
- $90,000
- Delta
- -68.16%
- Verdict
- UNDERPRICED
- Comps
- 20 within 1.0 mi
Show comp detail 12 sales within ~0.75 mi
| Address | Dist | Beds/Ba | Sqft | Sold | Price | $/sf | Match |
|---|---|---|---|---|---|---|---|
| 6619 Loveless Park Loop | 0.17mi | 2/1.0 (-1) | 1,036 (-10%) | 9mo | $145,000 | $140 | 63 |
| 6645 Loveless Park Loop | 0.21mi | 3/1.5 | 1,296 (+13%) | 10mo | $325,000 | $251 | 58 |
| 4729 Newbridge Cir | 0.29mi | 3/2.0 | 1,272 (+11%) | 8mo | $279,900 | $220 | 58 |
| 4730 Newbridge Cir | 0.29mi | 3/2.0 | 1,272 (+11%) | 11mo | $287,400 | $226 | 55 |
| 4722 Newbridge Cir | 0.29mi | 3/2.0 | 1,272 (+11%) | 11mo | $284,000 | $223 | 55 |
| 4914 Newbridge Blvd | 0.46mi | 3/2.0 | 1,272 (+11%) | 4mo | $287,000 | $226 | 54 |
| 4901 Newbridge Blvd | 0.58mi | 3/2.0 | 1,272 (+11%) | 0mo | $291,000 | $229 | 51 |
| 6676 Newbridge Cv | 0.43mi | 3/2.0 | 1,272 (+11%) | 12mo | $269,900 | $212 | 48 |
| 4954 Newbridge Blvd | 0.37mi | 3/2.0 | 1,272 (+11%) | 16mo | $279,900 | $220 | 47 |
| 6824 Newbridge Cv | 0.37mi | 3/2.0 | 1,272 (+11%) | 18mo | $279,900 | $220 | 46 |
| 6124 Letson Farms Dr | 0.71mi | 2/2.0 (-1) | 1,231 (+7%) | 5mo | $234,000 | $190 | 42 |
| 6108 Letson Farms Dr | 0.75mi | 2/2.0 (-1) | 1,230 (+7%) | 7mo | $245,000 | $199 | 38 |
Match score weights: distance 35% · size 25% · config 20% · recency 20%. Top-matched comps best support the ARV.
Projected returns pro-forma
-3.0% appreciation · 8.0% rent growth · sell at horizon
- IRR
- 46.0%
- Equity multiple
- 3.14×
- Total profit
- $53,860
- Equity at exit
- $13,419
- IRR
- 53.9%
- Equity multiple
- 7.65×
- Total profit
- $167,504
- Equity at exit
- $7,782
Cash invested: $25,200 (down + closing). Projections, not guarantees.
Landlord ↔ Tenant lean methodology
- Overall (STATE)
- 90 Strongly Landlord-Friendly
- State Alabama
- 90 Strongly Landlord-Friendly · R+15
- County
- — inherits STATE
- City
- — inherits STATE
ZIP-level market 35022
- Home prices YoY
- -20.2%
- Rents YoY
- 14.8%
- Active inventory
- 311
- Price-to-rent
- 4.0×
Monthly cashflow live
- Estimated rent
- $1,883 medium interval (Pro) →
- Mortgage (P&I)
- −$472
- Tax from tax record
- −$60 /mo · $718/yr
- Insurance
- −$38
- HOA
- −$0
- Vacancy / Maint / Mgmt
- −$395
- Net cashflow
- $918
Break-even live
Sensitivity live
| Price | -10% $969 | -5% $944 | +0% $918 | +5% $893 | +10% $867 |
|---|---|---|---|---|---|
| Rent | -10% $770 | -5% $844 | +0% $918 | +5% $993 | +10% $1,067 |
| Rate | -1.0pp $964 | -0.5pp $941 | base $918 | +0.5pp $895 | +1.0pp $871 |
UW: 25.0% down · 7.5% · 30yr · 1.5% tax · 5.0% vac · 8.0% maint · 8.0% mgmt
Financing live
Cash to close
- Down payment
- $22,500
- Closing costs
- $2,700
- Reserves months
- —
- Total cash needed
- —
Loan-product check · same deal, 3 products live
Conventional
25% down · 7.5% · 30yr
- Down + closing
- —
- Monthly P&I
- —
- Monthly cashflow
- —
- DSCR
- —
- Eligible?
- —
Personal DTI + credit; lowest rate.
DSCR
20% down · 8.5% · 30yr
- Down + closing
- —
- Monthly P&I
- —
- Monthly cashflow
- —
- DSCR
- —
- Eligible?
- —
No personal income docs; deal must DSCR.
Hard money
10% down · 12.0% · 12mo
- Down + closing
- —
- Monthly P&I
- —
- Monthly cashflow
- —
- DSCR
- —
- Eligible?
- —
Short-term bridge; refi at stabilization.
Rent comps 1 comps
| Address | Beds | Baths | Sqft | Rent | $/sqft | DOM | Units | Dist |
|---|---|---|---|---|---|---|---|---|
| 4737 Longmeadow Dr Bessemer, AL | 3.0 | 2.0 | 1356 | $1,815 | $1.34 | 11d | 1 | 0.77mi |
Listing history 16 events
-
2026-06-15days on market $90,000 Active 100 DOM
-
2026-06-13days on market $90,000 Active 98 DOM
-
2026-06-10days on market $90,000 Active 95 DOM
-
2026-06-09days on market $90,000 Active 94 DOM
-
2026-06-08days on market $90,000 Active 93 DOM
-
2026-06-07days on market $90,000 Active 92 DOM
-
2026-06-03days on market $90,000 Active 88 DOM
-
2026-06-02days on market $90,000 Active 87 DOM
-
2026-06-01days on market $90,000 Active 86 DOM
-
2026-05-31days on market $90,000 Active 85 DOM
-
2026-04-07status Active 227-char remark
Show marketing remark (227 chars)
Investor opportunity! This 3 bed, 1 bath property offers strong value-add potential. Currently tenant-occupied, with tenant expected to vacate prior to closing. Great opportunity for a flip or rental addition. Being sold as-is.
-
2026-03-27status Pending 227-char remark
Show marketing remark (227 chars)
Investor opportunity! This 3 bed, 1 bath property offers strong value-add potential. Currently tenant-occupied, with tenant expected to vacate prior to closing. Great opportunity for a flip or rental addition. Being sold as-is.
-
2026-02-24$90,000 Active 227-char remark
Show marketing remark (227 chars)
Investor opportunity! This 3 bed, 1 bath property offers strong value-add potential. Currently tenant-occupied, with tenant expected to vacate prior to closing. Great opportunity for a flip or rental addition. Being sold as-is.
-
2024-01-25price $125,000
-
2005-08-05soldstatus $69,000
-
1996-09-30soldstatus $63,500
ⓘ Source: listings_history table (triggers on properties + properties_extension) + one-shot
backfill from property_details.listing_events for pre-trigger history.
Tax reassessment forecast AL · Resets to sale price
- Current annual tax
- $718 · $60/mo
- Projected year-2 tax
- $718 · $60/mo
- Expected delta
- $0/yr ($0/mo · 0.0%)
ⓘ Screening estimate from a state-policy table — verify with the county assessor before closing.
Climate risk First Street
- Flood 1/10 Low FEMA zone X (unshaded) · 0% chance over 30 yrs
- Wildfire 4/10 Moderate
- Heat 6/10 Major 7 d/yr ≥108°F today · 19 d/yr by 30 yrs out
- Wind 6/10 Major 55% chance of damaging wind over 30 yrs
- Air quality 2/10 Low 2 unhealthy d/yr today · 2 by 30 yrs out
Nearby sold comps map
Loading sold comps map…
Walkable amenities ~0.75 mi
Loading nearby amenities…
Taxation est. · year 1
- Rental income
- $22,599
- − Mortgage interest
- −$5,041
- − Property taxes
- −$718
- − Insurance
- −$450
- − Repairs & maintenance
- −$1,808
- − Management
- −$1,808
- − Depreciation
- −$2,618
- Taxable income
- $10,155
- Est. tax owed @ 24.0%
- −$2,437
- After-tax cash flow
- $8,584/yr
For passive investors: Depreciation is non-cash, so a rental often shows a tax loss while cash-flowing — sheltering income. Rental losses are passive: they offset passive income freely, and up to $25,000/yr can offset ordinary (W-2) income if you actively participate and your MAGI is under $100k (phasing out to $0 by $150k); unused losses carry forward. On sale, claimed depreciation is recaptured at up to 25%, and gains may owe capital-gains tax (a 1031 exchange can defer both). Figures are a year-1 estimate at your 24.0% rate — not tax advice; consult a CPA.
Schools (NCES district)
- District
- Jefferson County
- NCES district ID
- 0101920
- Math proficiency
- 9% ▼ -24.00%
- Reading proficiency
- 32% ▼ -5.00%
- Median HH income
- $51,712
- Composite
- 18.4/100
- National rank
- #8937
- State rank
- #104 of 129 in AL
Livability — McCalla
No livability data for this city. (Only ~50 U.S. cities are tracked.)
Census & demographics
- Census place
- McCalla, AL
- County
- Jefferson County · 527,445 people
- Metro
- Birmingham-Hoover, AL
- Population (ZIP)
- 23,126
- Household income
- $81,846
- Rent vs Own
- Severe rent burden
- 554.0
Population outlook (Jefferson County) Hauer SSP2
- Today (2025)
- 669,185 people
- By 2030
- 669,694 · +0.1%
- By 2040
- 661,388 · -1.2%
- By 2050
- 643,086 · -3.9%
- By 2075
- 577,267 · -13.7%
- By 2100
- 474,758 · -29.1%
Race, ethnicity, and origin ACS 2023
- Neighborhood character
- Diverse neighborhood (Simpson 0.56)
- Race & ethnicity
- Black 53% White 41% Hispanic / Latino 3% Two or more races 2% Asian 1%
- Common ancestry
- Italian 1% Slovak 1% Iranian 1%
- Foreign-born
- 4% · Canada, China
- Languages at home
- 96% English-only · Spanish 3% Chinese 1%
Political lean MEDSL · Jefferson
- 2024 margin
- D (+10.4) · D 54.6% · R 44.2% · Other 1.2%
- 2008→2024 swing
- +5.4pp toward D · 2008: 5.1pp · 2024: 10.4pp
- All cycles
- 2024: D+10.4 2020: D+13.2 2016: D+7.2 2012: D+6.0 2008: D+5.1
Not yet ingested
- Civics
- —
Market trends
- HPI YoY
- ▼ -55.40%
- Current HPI
- 219.3839
- Rent YoY
- ▲ 14.80%
- Metro
- Birmingham-Hoover, AL
- State GDP YoY
- ▲ 2.94%
- F500 in state
- 4
Industry mix (Fortune 500 HQ in AL)
| Industry | F500 HQs | Revenue |
|---|---|---|
| Financial Services | 1 | $8B |
|
||
| Healthcare | 1 | $5B |
|
||
Price history
+41.7% since first listed6 events — show timeline
- 2026-04-07 Relisted — Greater Alabama MLS
- 2026-03-27 Pending — Greater Alabama MLS
- 2026-02-24 Listed $90,000 Greater Alabama MLS
- 2024-01-25 Price Changed $125,000 Greater Alabama MLS
- 2005-08-05 Sold (Public Records) $69,000 Public Records
- 1996-09-30 Sold (Public Records) $63,500 Public Records
Property tax history
+0.7%/yrLatest (2025): $718 · -7.1% YoY. Source: county tax records.
Cash-flow waterfall
monthlySold comps — $/sqft
last 12 mo · ≤1 miLoading sold comps…