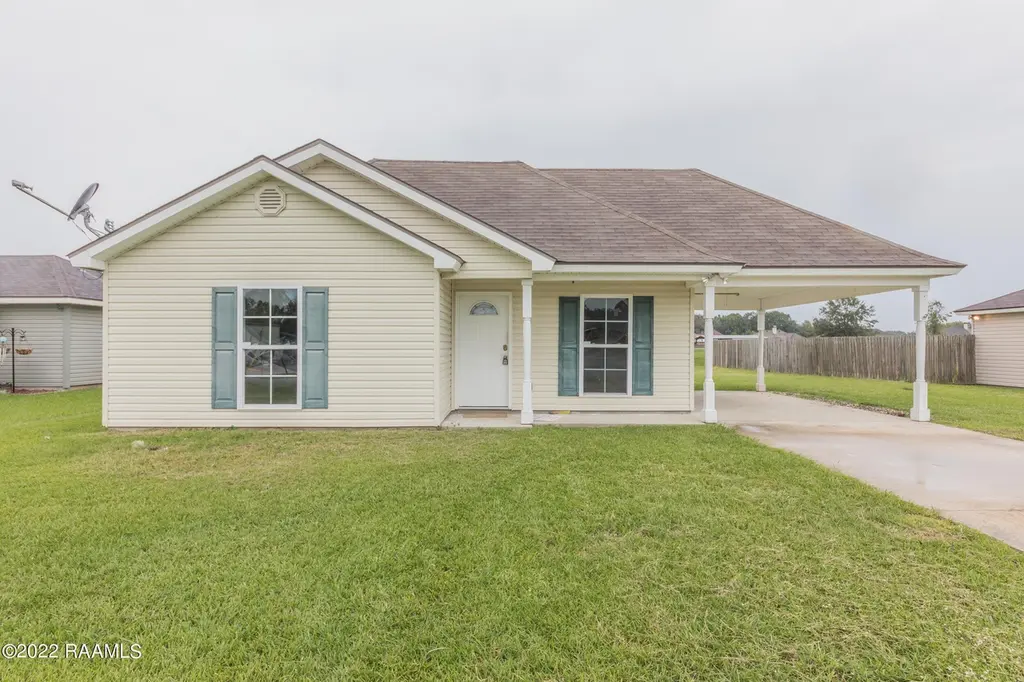
1029 Gary Dr · Breaux Bridge, LA
Flood risk 1/10 · Minimal
- FEMA flood zone
- X
- Chance of flooding over 30 yrs
- 0.0%
- Est. flood insurance / yr
- $507 – $1,088
Fire risk 1/10 · Minimal
- Est. fire insurance / yr
- $1,269 – $2,357
Heat risk 9/10 · Severe
- Hot days now (above 109°F)
- 7 days/yr
- Hot days in 30 yrs
- 20 days/yr
Wind risk 9/10 · Severe
- Chance of severe wind over 30 yrs
- 99.0%
Air-quality risk 2/10 · Minimal
- Unhealthy air days now
- 1 days/yr
- Unhealthy air days in 30 yrs
- 1 days/yr
Risk factors via First Street. Map © Google.
Why this score? — see what drove the D+ grade
The composite is a weighted blend of 9 inputs, each scored 0–100. Each bar is that input's sub-score; the figure is the points it added to the 100-point composite (weight × sub-score).
- Cash flow +17.4/30.0
- ARV discount +12.4/15.0
- DSCR +5.4/10.0
- 1% rule +4.2/10.0
- Livability +3.1/5.0
- Rent growth +2.5/5.0
- Condition / age +2.5/5.0
- Schools +2.3/10.0
- Appreciation +0.0/10.0
$180,000
🖨 Deal sheet 📄 Offer letter ✓ Due diligence
Listing remarks
This home features 3 bedrooms 2 bath cottage style home with an open floor plan including a island bar gives you 1,282 sqft. Large walk-in closets with light and airy color scheme. City water and sewer. Convenient access to Interstate 10, only minutes from Lafayette and a short commute to Baton Rouge. Owners will entertain Lease Purchase Options
Key facts
- Open floor plan
- City water and sewer
- Island bar
Tags
Property features AI
Finance
- HOA & community: Community association with management; Annual association fee of 300 (covers legal)
Exterior
- Parking: Has carport (1 space); 1 total parking space (covered)
- Utilities: Public sewer; Electric service: CLECO
- Home design: Single family residence
- Construction: Vinyl siding construction
- Exterior features: Vinyl siding
Interior
- Kitchen: Dishwasher
- Bathrooms: 2 full bathrooms
- Heating & cooling: Central heating; Central air conditioning
- Interior features: Dishwasher
Neighborhood map
What this means for you Summary
Snapshot
- This is a 3-bed/2.0-bath single-family listed at $180k.
Deal economics
- At list price, monthly cash flow is $134 ($2k/yr) — positive.
- The deal already cash-flows at list — no discount required.
- To meet the 1% rule (rent ≥ 1% of price), the offer needs to be $165k (8.5% below list).
- Recommended offer: $165k (8.5% below list) — sets the bar for 1% rule.
- Cap rate 7.2% vs local median 3.4% in Breaux Bridge — top-decile yield for the area; either an underpriced asset or a hidden risk that comps aren't pricing in. Stress-test before assuming the spread holds.
Location & tenants
- Location reads 62/100 on livability (#210 in LA) — a middle-class / working-renter tenant base. Strengths: cost of living A+, health & safety B+; Watch: crime F, amenities F, commute F.
- St. Martin Parish (rural): math 23% / reading 32% proficiency, ranked #49 of 98 in LA (top 50%) — low school quality limits family demand, transient renter base, plan for 1-2y turnover; 68% free/reduced lunch — lower-income household profile, screen leases tightly.
- Zoned schools: Breaux Bridge Primary School (571 students, 80% FRL); Breaux Bridge Junior High School (math 12% / reading 22%, grade F, #174 of 218 statewide, top 81%, 397 students, 76% FRL); Breaux Bridge High School (math 22% / reading 27%, grade F, #153 of 265 statewide, top 62%, 851 students, 62% FRL) — zoned schools at 73% FRL track the district average.
- Market conditions: 276 active listings in the ZIP; 3 comparable units currently listed for rent nearby; rentals lingering (median 44d on market — plan ~5-8 weeks vacancy on turnover, expect pricing pressure); 67% of comp listings sitting > 30 days — soft ceiling on asking rent; 54 units permitted in St. Martin Parish in 2024 (0 in 5+ unit buildings).
Forward outlook
- Local home prices are declining (-3.0%/yr); year-one equity from $1k of loan paydown is wiped out by about $5k of value loss. Plan a longer hold.
- St. Martin County population projected at +7% by 2050 — modest demand growth; plan on rents tracking national, not racing it.
Negotiation context
- It's been on market 37 days — a 3% lower offer ($175k) is reasonable based on typical stale-listing flexibility.
- 11 sale attempts since 18y ago; this cycle's ask is 11703% above the opening price — seller raised mid-cycle; expect resistance to lowballs.
Risks & watch-outs
- Climate carrying-cost: severe wind risk, 99% chance of damaging wind over 30y; extreme-heat days projected 7→20/yr by 2055 (HVAC capex compounding) — expect insurance premiums to compound above CPI over the hold.
Questions for the listing agent
- It's been on market 37 days. Have you received any prior offers? Is the seller open to a 8% concession, seller financing, or rate buy-down credit?
- What does the HOA fee cover, when was the last increase, and are there any pending special assessments or reserve-fund shortfalls?
- Is there a deadline driving the sale (1031 exchange, divorce, estate, relocation)? That informs how much negotiation room exists.
- Crime grade is F in this area — have there been break-ins, vandalism, or insurance claims at this property in the last 3 years? What carrier currently insures it and at what premium?
- The area grade is low — what's the realistic commute time and amenity access for the typical tenant pool here? Any planned neighborhood developments (good or bad) we should know about?
- What's the average days-on-market for RENTAL listings here right now (not sales)? A rising rental-DOM trend means longer vacancies and softer asking-rent achievability than the comps imply.
- What's the recent tenant-quality profile in this submarket — average credit score on applications, eviction rate, late-payment / NSF rate, and stable-employment percentage? A property-management company in the area should have these aggregated.
- How much new for-sale + rental construction is in the pipeline within 1–3 miles? Heavy new supply typically softens prices + rents 12–24 months out; constrained supply supports both.
Investment metrics
- 1% rule
- 0.92% ✗
- Cap rate
- 7.18%
- Cash-on-cash
- 3.18%
- DSCR
- 1.14
- GRM
- 9.1
CMA / ARV
- ARV (median comp)
- $202,216
- List price
- $180,000
- Delta
- -10.99%
- Verdict
- UNDERPRICED
- Comps
- 20 within 1.0 mi
Show comp detail 12 sales within ~0.75 mi
| Address | Dist | Beds/Ba | Sqft | Sold | Price | $/sf | Match |
|---|---|---|---|---|---|---|---|
| 1042 Lillian Michel Dr | 0.07mi | 3/2.0 | 1,298 (-0%) | 4mo | $162,000 | $125 | 93 |
| 925 Lillian Michel Dr | 0.17mi | 3/2.0 | 1,323 (+2%) | 4mo | $181,500 | $137 | 86 |
| 918 Lillian Michel Dr | 0.17mi | 3/2.0 | 1,360 (+4%) | 8mo | $185,000 | $136 | 78 |
| 1409 Grand Pointe Ave | 0.30mi | 2/1.0 (-1) | 1,235 (-5%) | 2mo | $120,000 | $97 | 67 |
| 114 Van Buren St | 0.61mi | 3/2.0 | 1,267 (-3%) | 2mo | $151,000 | $119 | 65 |
| 1412 St Charles St | 0.27mi | 3/2.0 | 1,403 (+8%) | 18mo | $194,000 | $138 | 60 |
| 744 N Belle Cir | 0.17mi | 3/2.0 | 1,475 (+13%) | 13mo | $225,000 | $153 | 59 |
| 660 St Charles St | 0.29mi | 3/2.0 | 1,450 (+11%) | 16mo | $170,000 | $117 | 54 |
| 728 S Poydras St | 0.65mi | 3/1.0 | 1,338 (+3%) | 13mo | $165,000 | $123 | 50 |
| — | 0.65mi | 2/2.0 (-1) | 1,251 (-4%) | 11mo | $215,000 | $172 | 49 |
| 134 Saint Phillip St | 0.59mi | 2/2.5 (-1) | 1,200 (-8%) | 10mo | $124,900 | $104 | 44 |
| — | 0.65mi | 3/1.0 | 1,150 (-12%) | 12mo | $45,000 | $39 | 36 |
Match score weights: distance 35% · size 25% · config 20% · recency 20%. Top-matched comps best support the ARV.
Projected returns pro-forma
-3.0% appreciation · 3.0% rent growth · sell at horizon
- IRR
- -11.3%
- Equity multiple
- 0.59×
- Total profit
- $-20,679
- Equity at exit
- $26,839
- IRR
- -2.1%
- Equity multiple
- 0.86×
- Total profit
- $-7,137
- Equity at exit
- $15,563
Cash invested: $50,400 (down + closing). Projections, not guarantees.
Landlord ↔ Tenant lean methodology
- Overall (STATE)
- 90 Strongly Landlord-Friendly
- State Louisiana
- 90 Strongly Landlord-Friendly · R+12
- County
- — inherits STATE
- City
- — inherits STATE
ZIP-level market 70517
- Home prices YoY
- -33.7%
- Active inventory
- 276
- Price-to-rent
- 9.1×
Monthly cashflow live
- Estimated rent
- $1,647 medium interval (Pro) →
- Mortgage (P&I)
- −$944
- Tax from tax record
- −$124 /mo · $1,484/yr
- Insurance
- −$75
- HOA
- −$25
- Vacancy / Maint / Mgmt
- −$346
- Net cashflow
- $134
Break-even live
UW: 25.0% down · 7.5% · 30yr · 1.5% tax · 5.0% vac · 8.0% maint · 8.0% mgmt
Financing live
Cash to close
- Down payment
- $45,000
- Closing costs
- $5,400
- Reserves months
- —
- Total cash needed
- —
Loan-product check · same deal, 3 products live
Conventional
25% down · 7.5% · 30yr
- Down + closing
- —
- Monthly P&I
- —
- Monthly cashflow
- —
- DSCR
- —
- Eligible?
- —
Personal DTI + credit; lowest rate.
DSCR
20% down · 8.5% · 30yr
- Down + closing
- —
- Monthly P&I
- —
- Monthly cashflow
- —
- DSCR
- —
- Eligible?
- —
No personal income docs; deal must DSCR.
Hard money
10% down · 12.0% · 12mo
- Down + closing
- —
- Monthly P&I
- —
- Monthly cashflow
- —
- DSCR
- —
- Eligible?
- —
Short-term bridge; refi at stabilization.
Rent comps 3 comps
| Address | Beds | Baths | Sqft | Rent | $/sqft | DOM | Units | Dist |
|---|---|---|---|---|---|---|---|---|
| 740 S Belle Cir Breaux Bridge, LA | 3.0 | 2.0 | 1485 | $1,800 | $1.21 | 13d | 1 | 0.18mi |
| 117 S Poydras St Breaux Bridge, LA | 2.0 | 1.0 | 1200 | $1,500 | $1.25 | 43d | 1 | 0.31mi |
| 906 Cecile Blvd Breaux Bridge, LA | 3.0 | 1.5 | 1300 | $1,200 | $0.92 | 43d | 1 | 1.39mi |
HOA detail
- Monthly dues
- $25 · $300/yr
- Likely covers
- watersewer
Listing history 26 events
-
2026-06-18days on market $180,000 Active 37 DOM
-
2026-06-17days on market $180,000 Active 36 DOM
-
2026-06-16days on market $180,000 Active 35 DOM
-
2026-06-15days on market $180,000 Active 34 DOM
-
2026-06-14days on market $180,000 Active 32 DOM
-
2026-06-13days on market $180,000 Active 31 DOM
-
2026-06-10days on market $180,000 Active 29 DOM
-
2026-06-09days on market $180,000 Active 28 DOM
-
2026-06-08days on market $180,000 Active 27 DOM
-
2026-06-07days on market $180,000 Active 26 DOM
-
2026-06-05days on market $180,000 Active 23 DOM
-
2026-06-02days on market $180,000 Active 21 DOM
-
2026-06-01days on market $180,000 Active 20 DOM
-
2026-05-31days on market $180,000 Active 19 DOM
-
2026-05-30days on market $180,000 Active 18 DOM
-
2026-05-12$180,000 Active 347-char remark
-
2026-04-14historical $1,500
-
2026-01-22$1,500
-
2022-12-05$175,500 Active
-
2018-10-08$150,000
-
2017-07-28$145,000
-
2014-11-03$141,000
-
2014-05-02$142,500
-
2009-03-09$140,000
-
2008-09-30$140,000
-
2008-04-15$140,200
ⓘ Source: listings_history table (triggers on properties + properties_extension) + one-shot
backfill from property_details.listing_events for pre-trigger history.
Tax reassessment forecast LA · Resets to sale price
- Current annual tax
- $1,484 · $124/mo
- Projected year-2 tax
- $1,484 · $124/mo
- Expected delta
- $0/yr ($0/mo · 0.0%)
ⓘ Screening estimate from a state-policy table — verify with the county assessor before closing.
Climate risk First Street
- Flood 1/10 Low FEMA zone X · 0% chance over 30 yrs
- Wildfire 1/10 Low
- Heat 9/10 Extreme 7 d/yr ≥109°F today · 20 d/yr by 30 yrs out
- Wind 9/10 Extreme 99% chance of damaging wind over 30 yrs
- Air quality 2/10 Low 1 unhealthy d/yr today · 1 by 30 yrs out
Nearby sold comps map
Loading sold comps map…
Walkable amenities ~0.75 mi
Loading nearby amenities…
Taxation est. · year 1
- Rental income
- $19,766
- − Mortgage interest
- −$10,083
- − Property taxes
- −$1,484
- − Insurance
- −$900
- − Repairs & maintenance
- −$1,581
- − Management
- −$1,581
- − HOA
- −$300
- − Depreciation
- −$5,236
- Taxable loss
- −$1,400
- Est. tax savings @ 24.0%
- +$336
- After-tax cash flow
- $1,940/yr
For passive investors: Depreciation is non-cash, so a rental often shows a tax loss while cash-flowing — sheltering income. Rental losses are passive: they offset passive income freely, and up to $25,000/yr can offset ordinary (W-2) income if you actively participate and your MAGI is under $100k (phasing out to $0 by $150k); unused losses carry forward. On sale, claimed depreciation is recaptured at up to 25%, and gains may owe capital-gains tax (a 1031 exchange can defer both). Figures are a year-1 estimate at your 24.0% rate — not tax advice; consult a CPA.
Schools (NCES district)
- District
- St. Martin Parish
- NCES district ID
- 2201590
- Math proficiency
- 23% ▼ -44.00%
- Reading proficiency
- 32% ▼ -36.00%
- Median HH income
- $42,813
- Composite
- 23.41/100
- National rank
- #7897
- State rank
- #49 of 98 in LA
Livability — Breaux Bridge
- Score
- 62/100
- State rank
- #210
- US rank
- #16362
Category grades
Schools grade is shown separately in the Schools card above.
Census & demographics
- Census place
- Breaux Bridge, LA
- Population (ZIP)
- 26,570
Population outlook (St. Martin County) Hauer SSP2
- Today (2025)
- 57,446 people
- By 2030
- 58,857 · +2.5%
- By 2040
- 60,859 · +5.9%
- By 2050
- 61,419 · +6.9%
- By 2075
- 61,574 · +7.2%
- By 2100
- 57,253 · -0.3%
Race, ethnicity, and origin ACS 2023
- Neighborhood character
- Majority White (62%)
- Race & ethnicity
- White 62% Black 30% Two or more races 5% Hispanic / Latino 4% Asian 1%
- Common ancestry
- Lithuanian 18% Slovak 1% Romanian 1%
- Foreign-born
- 3% · Canada, Vietnam, China
- Languages at home
- 87% English-only · French/Haitian/Cajun 9% Spanish 3% Vietnamese 1%
Political lean MEDSL · St. Martin
- 2024 margin
- Solid R (+40.7) · D 29.1% · R 69.8% · Other 1.0%
- 2008→2024 swing
- -20.0pp toward R · 2008: -20.7pp · 2024: -40.7pp
- All cycles
- 2024: R+40.7 2020: R+36.1 2016: R+33.4 2012: R+24.5 2008: R+20.7
Not yet ingested
- Civics
- —
Market trends
- HPI YoY
- ▼ -73.00%
- Current HPI
- 143.4293
- Rent YoY
- —
- Metro
- —
- State GDP YoY
- ▲ 3.29%
- F500 in state
- 10
Industry mix (Fortune 500 HQ in LA)
| Industry | F500 HQs | Revenue |
|---|---|---|
| Telecommunications | 2 | $23B |
|
||
| Utilities | 1 | $12B |
|
||
| Wholesale / Distribution | 1 | $5B |
|
||
| Advertising | 1 | $2B |
|
||
Price history
-98.9% since first listed12 events — show timeline
- 2026-05-27 Listed for Rent $1,525 RAAMLS
- 2026-05-12 Listed $180,000 AcadianaMLS
- 2026-04-14 Rental Removed $1,500 RAAMLS
- 2026-01-22 Listed for Rent $1,500 RAAMLS
- 2022-12-05 Listed $175,500 AcadianaMLS
- 2018-10-08 Listed $150,000 AcadianaMLS
- 2017-07-28 Listed $145,000 AcadianaMLS
- 2014-11-03 Listed $141,000 AcadianaMLS
- 2014-05-02 Listed $142,500 AcadianaMLS
- 2009-03-09 Listed $140,000 AcadianaMLS
- 2008-09-30 Listed $140,000 AcadianaMLS
- 2008-04-15 Listed $140,200 AcadianaMLS
Property tax history
+0.7%/yrLatest (2025): $1,484 · -0.6% YoY. Source: county tax records.
Cash-flow waterfall
monthlySold comps — $/sqft
last 12 mo · ≤1 miLoading sold comps…