 🏷️ Likely Rental
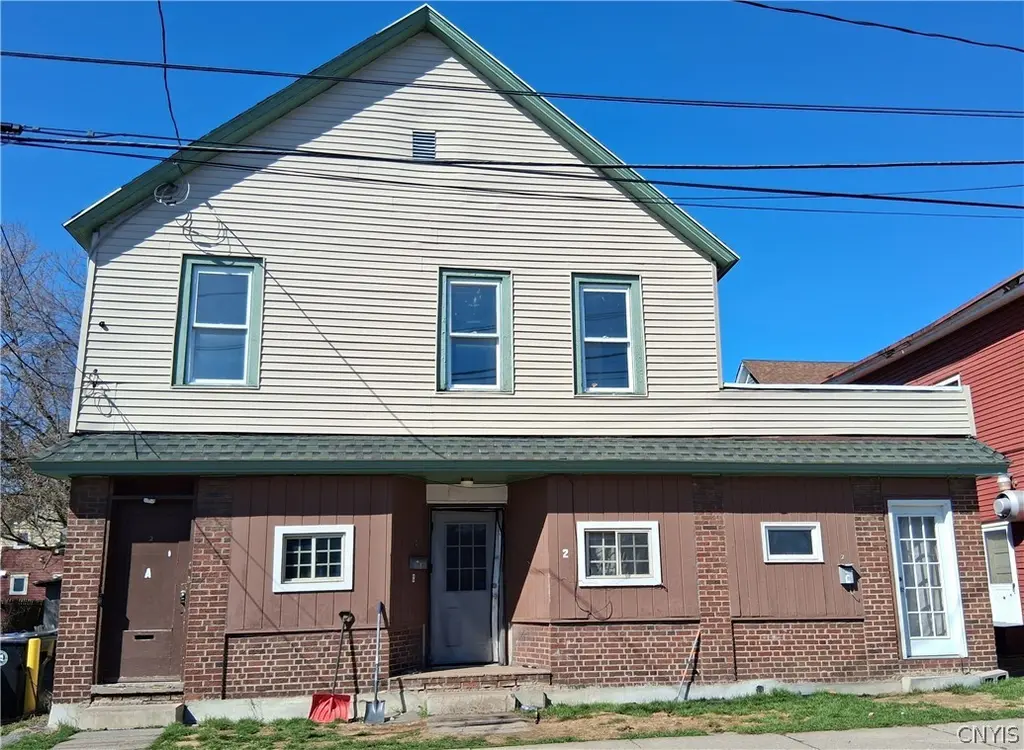
2 South Ave · Cortland, NY
Flood risk 8/10 · Major
- FEMA flood zone
- X (unshaded)
- Chance of flooding over 30 yrs
- 0.99%
- Est. flood insurance / yr
- $473 – $860
Fire risk 3/10 · Minor
- Est. fire insurance / yr
- $691 – $1,283
Heat risk 2/10 · Minimal
- Hot days now (above 92°F)
- 8 days/yr
- Hot days in 30 yrs
- 17 days/yr
Wind risk 2/10 · Minimal
- Chance of severe wind over 30 yrs
- 1.0%
Air-quality risk 2/10 · Minimal
- Unhealthy air days now
- 0 days/yr
- Unhealthy air days in 30 yrs
- 1 days/yr
Risk factors via First Street. Map © Google.
Why this score? — see what drove the B grade
The composite is a weighted blend of 9 inputs, each scored 0–100. Each bar is that input's sub-score; the figure is the points it added to the 100-point composite (weight × sub-score).
- Cash flow +26.5/30.0
- ARV discount +15.0/15.0
- DSCR +9.0/10.0
- 1% rule +7.1/10.0
- Rent growth +4.6/5.0
- Schools +4.3/10.0
- Livability +3.9/5.0
- Condition / age +2.5/5.0
- Appreciation +0.0/10.0
$185,000
🖨 Deal sheet 📄 Offer letter ✓ Due diligence
Listing remarks MLS
3-unit money maker in the city of Cortland. Front unit: 1 BR, bath, kitchen, LR for $800 per month plus utilities. Back unit: 1 BR, bath, kitchen, LR for $800 per month plus utilities. Upstairs: 4 BR, LR, kitchen, bath for $1400 per month plus utilities. Tenants pay separate utilities. LOT next door (37'x75') conveys with subject to additional parking, play and garden space. Newer electric and gas service. Don't miss making an offer on this money maker!
Key facts
- Separate utilities
- Additional parking
- 3 unit money maker
Tags
Neighborhood map
What this means for you Summary
Snapshot
- This is a 6-bed/3.0-bath other listed at $185k.
Deal economics
- At list price, monthly cash flow is $433 ($5k/yr) — positive.
- The deal already cash-flows at list — no discount required.
- Meets the 1% rule at list price ($2k rent vs $185k).
- Recommended offer: $168k (9.0% below list) — sets the bar for market timing.
- Cap rate 9.5% vs local median 6.2% in Cortland — top-decile yield for the area; either an underpriced asset or a hidden risk that comps aren't pricing in. Stress-test before assuming the spread holds.
Location & tenants
- Location reads 77/100 on livability (#201 in NY, #3,105 nationally) — a middle-class / working-renter tenant base. Strengths: cost of living A+, housing A+, health & safety A+; Watch: crime C-, schools D+, employment D.
- Cortland City School District (town): math 49% / reading 54% proficiency, ranked #368 of 590 in NY (top 62%) — acceptable for families but not a draw, mixed tenant base, ~2y average lease.
- Market conditions: Rents rising fast (+8.4%/yr); 141 active listings in the ZIP; 45 units permitted in Cortland County in 2024 (12 in 5+ unit buildings).
- This rent runs 38% of the median local income ($70k/yr) — at the standard rent-burdened threshold; future hikes will face affordability resistance.
Forward outlook
- Local home prices are declining (-3.0%/yr); year-one equity from $1k of loan paydown is wiped out by about $6k of value loss. Plan a longer hold.
- Cortland County population projected at -15% by 2050 — secular population decline; favor cash flow + early exit over multi-decade hold.
- At projected returns (-3.0% appreciation + 8.0% rent growth), your $52k cash investment doubles in ~8 years — after that, you're playing with house money.
Negotiation context
- It's been on market 109 days — a 9% lower offer ($168k) is reasonable based on typical stale-listing flexibility.
- 4 sale attempts since 8y ago with the ask held roughly flat each time — persistent listings suggest the price (not the market) is what's stuck; bring a comps-based counter.
Risks & watch-outs
- Watch-outs: flood insurance adds $56/mo.
- Climate carrying-cost: severe flood risk — expect insurance premiums to compound above CPI over the hold.
Questions for the listing agent
- It's been on market 109 days. Have you received any prior offers? Is the seller open to a 9% concession, seller financing, or rate buy-down credit?
- Built in 1964 — when were the roof, HVAC, electrical panel, plumbing, and water heater last replaced?
- What's the actual annual flood-insurance premium (NFIP or private), and is the property in a SFHA with mandatory coverage?
- Why hasn't it sold? Are there any deal-killer items the seller is aware of (foundation, flood, title, zoning, code violations)?
- Is there a deadline driving the sale (1031 exchange, divorce, estate, relocation)? That informs how much negotiation room exists.
- Schools are D-rated, which usually means shorter tenancies and higher turnover. Who's the typical renter profile here, and what's been the actual vacancy rate?
- What's the average days-on-market for RENTAL listings here right now (not sales)? A rising rental-DOM trend means longer vacancies and softer asking-rent achievability than the comps imply.
- What's the recent tenant-quality profile in this submarket — average credit score on applications, eviction rate, late-payment / NSF rate, and stable-employment percentage? A property-management company in the area should have these aggregated.
- How much new for-sale + rental construction is in the pipeline within 1–3 miles? Heavy new supply typically softens prices + rents 12–24 months out; constrained supply supports both.
Investment metrics
- 1% rule
- 1.21% ✓
- Cap rate
- 9.46%
- Cash-on-cash
- 11.31%
- DSCR
- 1.50
- GRM
- 6.9
CMA / ARV
- ARV (median comp)
- $293,549
- List price
- $185,000
- Delta
- -36.98%
- Verdict
- UNDERPRICED
- Comps
- 20 within 1.0 mi
Projected returns pro-forma
-3.0% appreciation · 8.0% rent growth · sell at horizon
- IRR
- 4.5%
- Equity multiple
- 1.18×
- Total profit
- $9,455
- Equity at exit
- $27,584
- IRR
- 18.3%
- Equity multiple
- 2.89×
- Total profit
- $97,766
- Equity at exit
- $15,995
Cash invested: $51,800 (down + closing). Projections, not guarantees.
Landlord ↔ Tenant lean methodology
- Overall (STATE)
- 15 Strongly Tenant-Friendly
- State New York
- 15 Strongly Tenant-Friendly · D+10
- County
- — inherits STATE
- City
- — inherits STATE
ZIP-level market 13045
- Home prices YoY
- -9.3%
- Rents YoY
- 8.4%
- Active inventory
- 141
- Price-to-rent
- 6.9×
Monthly cashflow live
- Estimated rent
- $2,236 medium interval (Pro) →
- Mortgage (P&I)
- −$970
- Tax est. 1.5%
- −$231 /mo · $2,775/yr
- Insurance
- −$77
- Flood insurance flood zone
- −$56 /mo · $666/yr
- HOA
- −$0
- Vacancy / Maint / Mgmt
- −$470
- Net cashflow
- $433
Break-even live
UW: 25.0% down · 7.5% · 30yr · 1.5% tax · 5.0% vac · 8.0% maint · 8.0% mgmt
Financing live
Cash to close
- Down payment
- $46,250
- Closing costs
- $5,550
- Reserves months
- —
- Total cash needed
- —
Loan-product check · same deal, 3 products live
Conventional
25% down · 7.5% · 30yr
- Down + closing
- —
- Monthly P&I
- —
- Monthly cashflow
- —
- DSCR
- —
- Eligible?
- —
Personal DTI + credit; lowest rate.
DSCR
20% down · 8.5% · 30yr
- Down + closing
- —
- Monthly P&I
- —
- Monthly cashflow
- —
- DSCR
- —
- Eligible?
- —
No personal income docs; deal must DSCR.
Hard money
10% down · 12.0% · 12mo
- Down + closing
- —
- Monthly P&I
- —
- Monthly cashflow
- —
- DSCR
- —
- Eligible?
- —
Short-term bridge; refi at stabilization.
Listing history 22 events
-
2026-06-19days on market $185,000 Active 109 DOM
-
2026-06-18days on market $185,000 Active 108 DOM
-
2026-06-17days on market $185,000 Active 107 DOM
-
2026-06-16days on market $185,000 Active 106 DOM
-
2026-06-15days on market $185,000 Active 105 DOM
-
2026-06-14days on market $185,000 Active 103 DOM
-
2026-06-12days on market $185,000 Active 102 DOM
-
2026-06-09days on market $185,000 Active 99 DOM
-
2026-06-08days on market $185,000 Active 98 DOM
-
2026-06-07days on market $185,000 Active 97 DOM
-
2026-06-05days on market $185,000 Active 94 DOM
-
2026-06-03days on market $185,000 Active 93 DOM
-
2026-06-02days on market $185,000 Active 92 DOM
-
2026-06-01days on market $185,000 Active 91 DOM
-
2026-05-31days on market $185,000 Active 90 DOM
-
2026-05-30days on market $185,000 Active 89 DOM
-
2026-03-01$185,000 Active 457-char remark
Show marketing remark (457 chars)
3-unit money maker in the city of Cortland. Front unit: 1 BR, bath, kitchen, LR for $800 per month plus utilities. Back unit: 1 BR, bath, kitchen, LR for $800 per month plus utilities. Upstairs: 4 BR, LR, kitchen, bath for $1400 per month plus utilities. Tenants pay separate utilities. LOT next door (37'x75') conveys with subject to additional parking, play and garden space. Newer electric and gas service. Don't miss making an offer on this money maker!
-
2019-05-05historical
-
2019-01-27historical
-
2019-01-27$166,900
-
2018-10-14$166,900
-
2018-10-14$166,900
ⓘ Source: listings_history table (triggers on properties + properties_extension) + one-shot
backfill from property_details.listing_events for pre-trigger history.
Climate risk First Street
- Flood 8/10 Severe FEMA zone X (unshaded) · 99% chance over 30 yrs
- Wildfire 3/10 Moderate
- Heat 2/10 Low 8 d/yr ≥92°F today · 17 d/yr by 30 yrs out
- Wind 2/10 Low 100% chance of damaging wind over 30 yrs
- Air quality 2/10 Low 0 unhealthy d/yr today · 1 by 30 yrs out
Nearby sold comps map
Loading sold comps map…
Walkable amenities ~0.75 mi
Loading nearby amenities…
Taxation est. · year 1
- Rental income
- $26,834
- − Mortgage interest
- −$10,363
- − Property taxes
- −$2,775
- − Insurance
- −$1,592
- − Repairs & maintenance
- −$2,147
- − Management
- −$2,147
- − Depreciation
- −$5,382
- Taxable income
- $2,429
- Est. tax owed @ 24.0%
- −$583
- After-tax cash flow
- $4,607/yr
For passive investors: Depreciation is non-cash, so a rental often shows a tax loss while cash-flowing — sheltering income. Rental losses are passive: they offset passive income freely, and up to $25,000/yr can offset ordinary (W-2) income if you actively participate and your MAGI is under $100k (phasing out to $0 by $150k); unused losses carry forward. On sale, claimed depreciation is recaptured at up to 25%, and gains may owe capital-gains tax (a 1031 exchange can defer both). Figures are a year-1 estimate at your 24.0% rate — not tax advice; consult a CPA.
Schools (NCES district)
- District
- Cortland City School District
- NCES district ID
- 3608460
- Math proficiency
- 49% ▲ 6.00%
- Reading proficiency
- 54% ▲ 17.00%
- Median HH income
- $42,413
- Composite
- 43.29/100
- National rank
- #3041
- State rank
- #368 of 590 in NY
Livability — Cortland
- Score
- 77/100
- State rank
- #201
- US rank
- #3105
Category grades
Schools grade is shown separately in the Schools card above.
Census & demographics
- Census place
- Cortland, NY
- County
- Cortland County · 28,361 people
- City population
- 28,361
- Metro
- Cortland, NY
- Population (ZIP)
- 28,361
- Household income
- $69,961
- Rent vs Own
- Severe rent burden
- 1488.0
Population outlook (Cortland County) Hauer SSP2
- Today (2025)
- 47,543 people
- By 2030
- 46,107 · -3.0%
- By 2040
- 43,122 · -9.3%
- By 2050
- 40,216 · -15.4%
- By 2075
- 34,717 · -27.0%
- By 2100
- 28,953 · -39.1%
Race, ethnicity, and origin ACS 2023
- Neighborhood character
- Predominantly White (87%)
- Race & ethnicity
- White 87% Two or more races 5% Hispanic / Latino 5% Black 3% Asian 2%
- Common ancestry
- Romanian 4% Lithuanian 2% Italian 2%
- Foreign-born
- 3% · Canada, China
- Languages at home
- 94% English-only · Spanish 2% Russian/Polish/Slavic 2% Other Indo-European 1%
Political lean MEDSL · Cortland
- 2024 margin
- Lean R (+6.4) · D 46.8% · R 53.2%
- 2008→2024 swing
- -16.4pp toward R · 2008: 10.0pp · 2024: -6.4pp
- All cycles
- 2024: R+6.4 2020: R+1.9 2016: R+6.7 2012: D+8.8 2008: D+10.0
Not yet ingested
- Civics
- —
Market trends
- HPI YoY
- ▼ -29.78%
- Current HPI
- 289.515
- Rent YoY
- ▲ 8.37%
- Metro
- Cortland, NY
- State GDP YoY
- ▲ 2.60%
- F500 in state
- 92
Industry mix (Fortune 500 HQ in NY)
| Industry | F500 HQs | Revenue |
|---|---|---|
| Financial Services | 10 | $950B |
|
||
| Consumer Goods | 9 | $162B |
|
||
| Insurance | 4 | $225B |
|
||
| Telecommunications | 2 | $144B |
|
||
| Pharmaceuticals | 2 | $112B |
|
||
| Media / Entertainment | 2 | $69B |
|
||
Price history
+10.8% since first listed6 events — show timeline
- 2026-03-01 Listed $185,000 CNYIS
- 2019-05-05 Listing Removed — CNYIS
- 2019-01-27 Listed $166,900 CNYIS
- 2019-01-27 Listing Removed — CNYIS
- 2018-10-14 Listed $166,900 IBRMLS
- 2018-10-14 Listed $166,900 CNYIS
Property tax history
-31.1%/yrLatest (2025): $67 · +0.4% YoY. Source: county tax records.
Cash-flow waterfall
monthlySold comps — $/sqft
last 12 mo · ≤1 miLoading sold comps…