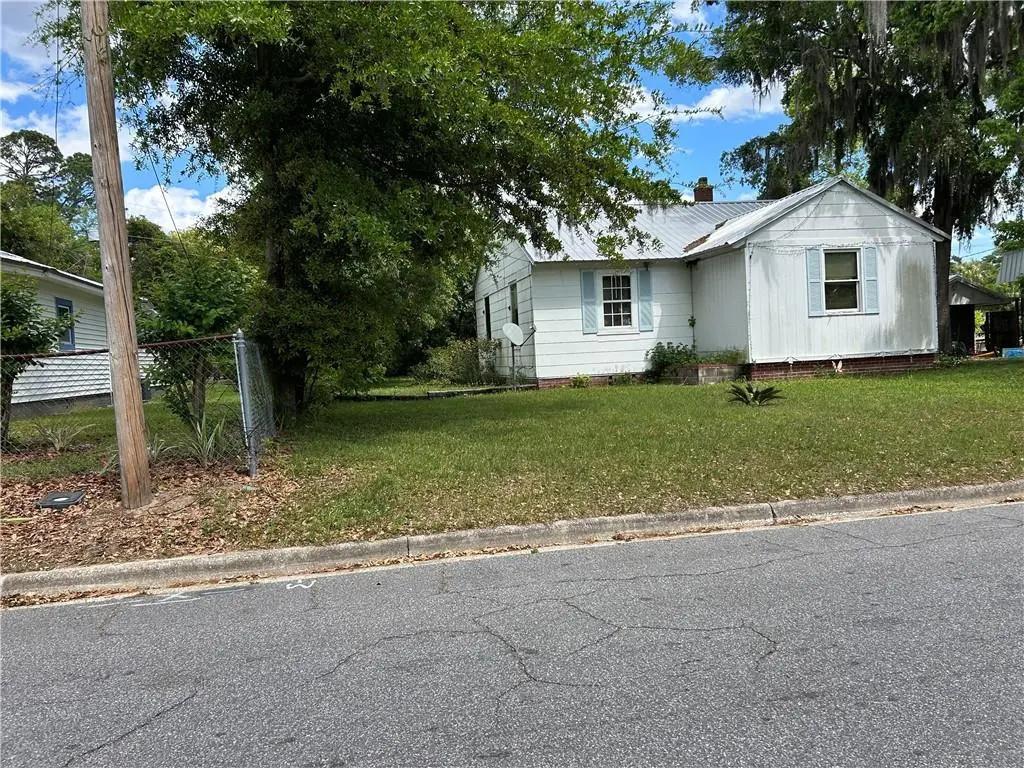
3108 Reynolds St · Brunswick, GA
Flood risk 6/10 · Moderate
- FEMA flood zone
- X (shaded)
- Chance of flooding over 30 yrs
- 0.74%
- Est. flood insurance / yr
- $507 – $1,088
Fire risk 5/10 · Moderate
- Est. fire insurance / yr
- $963 – $1,789
Heat risk 10/10 · Severe
- Hot days now (above 108°F)
- 7 days/yr
- Hot days in 30 yrs
- 20 days/yr
Wind risk 9/10 · Severe
- Chance of severe wind over 30 yrs
- 99.0%
Air-quality risk 4/10 · Minor
- Unhealthy air days now
- 5 days/yr
- Unhealthy air days in 30 yrs
- 5 days/yr
Risk factors via First Street. Map © Google.
Why this score? — see what drove the B+ grade
The composite is a weighted blend of 9 inputs, each scored 0–100. Each bar is that input's sub-score; the figure is the points it added to the 100-point composite (weight × sub-score).
- Cash flow +30.0/30.0
- ARV discount +15.0/15.0
- DSCR +10.0/10.0
- 1% rule +9.0/10.0
- Rent growth +3.8/5.0
- Schools +3.4/10.0
- Livability +3.0/5.0
- Condition / age +2.5/5.0
- Appreciation +0.0/10.0
$105,000
🖨 Deal sheet 📄 Offer letter ✓ Due diligence
Listing remarks MLS
2 bed 1 bath home with large storage shed in back yard. Additional room built on back of home. This property is eligible under the Fannie Mae First Look Initiative through 06/05/2012. This is a Fannie Mae HomePath property and can be purchased for as little as 3% down. Property is approved for HomePath Mortgage and Renovation Mortgage Financing. The seller has directed that all offers on this listing be made using the HomePath Online Offer system at the HomePath website at HomePath.com For help visit www. homepath.com/offerQuestion or 866-218-4446.
Key facts
- 9,147 sq ft lot
- Built 1942
- Listed 15 days
Property features AI
Exterior
- Utilities: Public water
- Home design: Single-story home; Residential zoning
- Construction: Masonite exterior
- Exterior features: Storage; Screened porch/patio
Interior
- Bedrooms: 2 main-level bedrooms
- Flooring: Wood
- Bathrooms: 1 full bathroom
- Heating & cooling: Electric heating; Electric cooling
- Interior features: Wood flooring; 5 total rooms
Neighborhood map
What this means for you Summary
Snapshot
- This is a 2-bed/1.0-bath single-family listed at $105k.
Deal economics
- At list price, monthly cash flow is $523 ($6k/yr) — positive.
- The deal already cash-flows at list — no discount required.
- Meets the 1% rule at list price ($1k rent vs $105k).
- Recommended offer: $103k (1.5% below list) — sets the bar for market timing.
- Cap rate 12.3% vs local median 4.1% in Brunswick — top-decile yield for the area; either an underpriced asset or a hidden risk that comps aren't pricing in. Stress-test before assuming the spread holds.
Location & tenants
- Location reads 59/100 on livability (#401 in GA) — a working-class tenant base; expect higher turnover. Strengths: cost of living A+, housing B+; Watch: crime D, schools D-, amenities F.
- Glynn County (other): math 37% / reading 42% proficiency, ranked #47 of 174 in GA (top 27%) — families likely to look elsewhere, expect single-tenant / working-renter base with shorter leases.
- Market conditions: Rents rising fast (+5.1%/yr); 183 active listings in the ZIP; 6 comparable units currently listed for rent nearby; rentals lingering (median 44d on market — plan ~5-8 weeks vacancy on turnover, expect pricing pressure); 100% of comp listings sitting > 30 days — soft ceiling on asking rent; lower-income renter base — watch delinquency; 734 units permitted in Glynn County in 2024 (136 in 5+ unit buildings).
- This rent runs 44% of the median local income ($40k/yr) — at the standard rent-burdened threshold; future hikes will face affordability resistance.
Forward outlook
- Local home prices are declining (-3.0%/yr); year-one equity from $726 of loan paydown is wiped out by about $3k of value loss. Plan a longer hold.
- Glynn County population projected at +13% by 2050 — modest demand growth; plan on rents tracking national, not racing it.
- At projected returns (-3.0% appreciation + 5.1% rent growth), your $29k cash investment doubles in ~6 years — after that, you're playing with house money.
Negotiation context
- It's been on market 16 days — a 2% lower offer ($103k) is reasonable based on typical stale-listing flexibility.
- 3 sale attempts since 14y ago with the ask held roughly flat each time — persistent listings suggest the price (not the market) is what's stuck; bring a comps-based counter.
- Current owner paid $8k; list at $105k implies a 1213% gain — meaningful room to come down on a strong offer.
Risks & watch-outs
- Watch-outs: built in 1942 — expect roof / HVAC / electrical / plumbing capex.
- Climate carrying-cost: major flood risk; severe wind risk, 99% chance of damaging wind over 30y; moderate wildfire risk; extreme-heat days projected 7→20/yr by 2055 (HVAC capex compounding) — expect insurance premiums to compound above CPI over the hold.
Questions for the listing agent
- Built in 1942 — when were the roof, HVAC, electrical panel, plumbing, and water heater last replaced?
- Is there a deadline driving the sale (1031 exchange, divorce, estate, relocation)? That informs how much negotiation room exists.
- Schools are D-rated, which usually means shorter tenancies and higher turnover. Who's the typical renter profile here, and what's been the actual vacancy rate?
- Crime grade is D in this area — have there been break-ins, vandalism, or insurance claims at this property in the last 3 years? What carrier currently insures it and at what premium?
- What's the average days-on-market for RENTAL listings here right now (not sales)? A rising rental-DOM trend means longer vacancies and softer asking-rent achievability than the comps imply.
- What's the recent tenant-quality profile in this submarket — average credit score on applications, eviction rate, late-payment / NSF rate, and stable-employment percentage? A property-management company in the area should have these aggregated.
- How much new for-sale + rental construction is in the pipeline within 1–3 miles? Heavy new supply typically softens prices + rents 12–24 months out; constrained supply supports both.
Investment metrics
- 1% rule
- 1.40% ✓
- Cap rate
- 12.27%
- Cash-on-cash
- 21.33%
- DSCR
- 1.95
- GRM
- 6.0
CMA / ARV
- ARV (on-the-fly)
- $134,075
- Comps found
- 2
Show comp detail 2 sales within ~0.75 mi
| Address | Dist | Beds/Ba | Sqft | Sold | Price | $/sf | Match |
|---|---|---|---|---|---|---|---|
| 3313 Treville Ave | 0.21mi | 2/1.0 | 775 (0%) | 8mo | $134,000 | $173 | 84 |
| 2817 Ellis St | 0.27mi | 2/1.0 | 891 (+15%) | 10mo | $60,000 | $67 | 54 |
Match score weights: distance 35% · size 25% · config 20% · recency 20%. Top-matched comps best support the ARV.
Projected returns pro-forma
-3.0% appreciation · 5.08% rent growth · sell at horizon
- IRR
- 16.0%
- Equity multiple
- 1.66×
- Total profit
- $19,379
- Equity at exit
- $15,656
- IRR
- 26.0%
- Equity multiple
- 3.48×
- Total profit
- $73,039
- Equity at exit
- $9,078
Cash invested: $29,400 (down + closing). Projections, not guarantees.
Landlord ↔ Tenant lean methodology
- Overall (STATE)
- 90 Strongly Landlord-Friendly
- State Georgia
- 90 Strongly Landlord-Friendly · R+3
- County
- — inherits STATE
- City
- — inherits STATE
ZIP-level market 31520
- Rents YoY
- 5.1%
- Active inventory
- 183
- Price-to-rent
- 6.0×
Monthly cashflow live
- Estimated rent
- $1,468 high interval (Pro) →
- Mortgage (P&I)
- −$551
- Tax from tax record
- −$43 /mo · $514/yr
- Insurance
- −$44
- HOA
- −$0
- Vacancy / Maint / Mgmt
- −$308
- Net cashflow
- $523
Break-even live
UW: 25.0% down · 7.5% · 30yr · 1.5% tax · 5.0% vac · 8.0% maint · 8.0% mgmt
Financing live
Cash to close
- Down payment
- $26,250
- Closing costs
- $3,150
- Reserves months
- —
- Total cash needed
- —
Loan-product check · same deal, 3 products live
Conventional
25% down · 7.5% · 30yr
- Down + closing
- —
- Monthly P&I
- —
- Monthly cashflow
- —
- DSCR
- —
- Eligible?
- —
Personal DTI + credit; lowest rate.
DSCR
20% down · 8.5% · 30yr
- Down + closing
- —
- Monthly P&I
- —
- Monthly cashflow
- —
- DSCR
- —
- Eligible?
- —
No personal income docs; deal must DSCR.
Hard money
10% down · 12.0% · 12mo
- Down + closing
- —
- Monthly P&I
- —
- Monthly cashflow
- —
- DSCR
- —
- Eligible?
- —
Short-term bridge; refi at stabilization.
Rent comps 6 comps
| Address | Beds | Baths | Sqft | Rent | $/sqft | DOM | Units | Dist |
|---|---|---|---|---|---|---|---|---|
| 3518 Hardee Ave Brunswick, GA | 3.0 | 1.0 | 948 | $1,550 | $1.64 | 44d | 1 | 0.44mi |
| 3602 Norwich St Brunswick, GA | 3.0 | 1.0 | 1012 | $1,550 | $1.53 | 44d | 1 | 0.50mi |
| 3742 Ogg Ave Brunswick, GA | 2.0 | 1.0 | 797 | $1,250 | $1.57 | 44d | 1 | 0.67mi |
| 2328 Union St Brunswick, GA | 1.0 | 1.0 | 600 | $1,125 | $1.88 | 44d | 1 | 0.71mi |
| 2408 Gordon St Brunswick, GA | 3.0 | 2.0 | 1100 | $1,550 | $1.41 | 44d | 1 | 0.88mi |
| 1501 G St Brunswick, GA | 3.0 | 2.0 | 1064 | $1,200 | $1.13 | 44d | 1 | 1.41mi |
Listing history 14 events
-
2026-06-19days on market $105,000 Active 16 DOM
-
2026-06-18days on market $105,000 Active 15 DOM
-
2026-06-17days on market $105,000 Active 14 DOM
-
2026-06-16days on market $105,000 Active 13 DOM
-
2026-06-15days on market $105,000 Active 12 DOM
-
2026-06-14days on market $105,000 Active 10 DOM
-
2026-06-13days on market $105,000 Active 9 DOM
-
2026-06-10days on market $105,000 Active 7 DOM
-
2026-06-09days on market $105,000 Active 6 DOM
-
2026-06-09remarks 141-char remark
-
2026-06-08days on market $105,000 Active 5 DOM
-
2026-06-07days on market $105,000 Active 4 DOM
-
2026-06-05remarks 105-char remark
-
2026-06-05$105,000 Active 1 DOM
ⓘ Source: listings_history table (triggers on properties + properties_extension) + one-shot
backfill from property_details.listing_events for pre-trigger history.
Tax reassessment forecast GA · Resets to sale price
- Current annual tax
- $514 · $43/mo
- Projected year-2 tax
- $966 · $80/mo
- Expected delta
- +$452/yr (+$38/mo · 88.0%)
ⓘ Screening estimate from a state-policy table — verify with the county assessor before closing.
Climate risk First Street
- Flood 6/10 Major FEMA zone X (shaded) · 74% chance over 30 yrs
- Wildfire 5/10 Major
- Heat 10/10 Extreme 7 d/yr ≥108°F today · 20 d/yr by 30 yrs out
- Wind 9/10 Extreme 99% chance of damaging wind over 30 yrs
- Air quality 4/10 Moderate 5 unhealthy d/yr today · 5 by 30 yrs out
Nearby sold comps map
Loading sold comps map…
Walkable amenities ~0.75 mi
Loading nearby amenities…
Taxation est. · year 1
- Rental income
- $17,619
- − Mortgage interest
- −$5,882
- − Property taxes
- −$514
- − Insurance
- −$525
- − Repairs & maintenance
- −$1,409
- − Management
- −$1,409
- − Depreciation
- −$3,055
- Taxable income
- $4,824
- Est. tax owed @ 24.0%
- −$1,158
- After-tax cash flow
- $5,114/yr
For passive investors: Depreciation is non-cash, so a rental often shows a tax loss while cash-flowing — sheltering income. Rental losses are passive: they offset passive income freely, and up to $25,000/yr can offset ordinary (W-2) income if you actively participate and your MAGI is under $100k (phasing out to $0 by $150k); unused losses carry forward. On sale, claimed depreciation is recaptured at up to 25%, and gains may owe capital-gains tax (a 1031 exchange can defer both). Figures are a year-1 estimate at your 24.0% rate — not tax advice; consult a CPA.
Schools (NCES district)
- District
- Glynn County
- NCES district ID
- 1302400
- Math proficiency
- 37% ▼ -9.00%
- Reading proficiency
- 42% ▼ -7.00%
- Median HH income
- $47,554
- Composite
- 33.83/100
- National rank
- #5359
- State rank
- #47 of 174 in GA
Livability — Brunswick
- Score
- 59/100
- State rank
- #401
- US rank
- #19832
Category grades
Schools grade is shown separately in the Schools card above.
Census & demographics
- Census place
- Brunswick, GA
- County
- Glynn County · 69,019 people
- City population
- 51,239
- Metro
- Brunswick, GA
- Population (ZIP)
- 22,313
- Household income
- $40,071
- Rent vs Own
- Severe rent burden
- 1406.0
Population outlook (Glynn County) Hauer SSP2
- Today (2025)
- 91,404 people
- By 2030
- 94,806 · +3.7%
- By 2040
- 100,060 · +9.5%
- By 2050
- 103,258 · +13.0%
- By 2075
- 107,970 · +18.1%
- By 2100
- 103,363 · +13.1%
Race, ethnicity, and origin ACS 2023
- Neighborhood character
- Diverse neighborhood (Simpson 0.63)
- Race & ethnicity
- Black 50% White 33% Hispanic / Latino 11% Two or more races 9% Asian 1%
- Hispanic origin (detail)
- Mexican 7%
- Common ancestry
- Italian 2% Slovak 1% Serbian 1%
- Foreign-born
- 8% · Canada, South Korea
- Languages at home
- 87% English-only · Spanish 10% French/Haitian/Cajun 1% Korean 1%
Political lean MEDSL · Glynn
- 2024 margin
- Strong R (+26.0) · D 36.8% · R 62.8%
- 2008→2024 swing
- -2.6pp toward R · 2008: -23.4pp · 2024: -26.0pp
- All cycles
- 2024: R+26.0 2020: R+23.2 2016: R+28.6 2012: R+27.0 2008: R+23.4
Not yet ingested
- Civics
- —
Market trends
- HPI YoY
- ▼ -274.83%
- Current HPI
- 180.4581
- Rent YoY
- ▲ 5.08%
- Metro
- Brunswick, GA
- State GDP YoY
- ▲ 2.66%
- F500 in state
- 28
Industry mix (Fortune 500 HQ in GA)
| Industry | F500 HQs | Revenue |
|---|---|---|
| Paper / Packaging | 2 | $29B |
|
||
| Retail | 1 | $160B |
|
||
| Transportation / Logistics | 1 | $91B |
|
||
| Airlines | 1 | $62B |
|
||
| Consumer Goods | 1 | $47B |
|
||
| Utilities | 1 | $25B |
|
||
Price history
+90.9% since first listed6 events — show timeline
- 2026-06-03 Listed $105,000 GIAR
- 2025-05-22 Listing Removed — GIAR
- 2025-04-11 Listed $120,000 GIAR
- 2012-09-26 Sold (MLS) $7,997 GIAR
- 2012-05-21 Listed $16,500 GIAR
- 2006-07-06 Sold (Public Records) $55,000 Public Records
Property tax history
-2.6%/yrLatest (2025): $514 · +28.8% YoY. Source: county tax records.
Cash-flow waterfall
monthlySold comps — $/sqft
last 12 mo · ≤1 miLoading sold comps…