201 S Lake Dallas Dr · Lake Dallas, TX
Flood risk 1/10 · Minimal
- FEMA flood zone
- X (unshaded)
- Chance of flooding over 30 yrs
- 0.0%
- Est. flood insurance / yr
- $507 – $1,088
Fire risk 3/10 · Minor
- Est. fire insurance / yr
- $1,222 – $2,270
Heat risk 7/10 · Major
- Hot days now (above 109°F)
- 7 days/yr
- Hot days in 30 yrs
- 23 days/yr
Wind risk 5/10 · Moderate
- Chance of severe wind over 30 yrs
- 26.0%
Air-quality risk 4/10 · Minor
- Unhealthy air days now
- 4 days/yr
- Unhealthy air days in 30 yrs
- 5 days/yr
Risk factors via First Street. Map © Google.
Why this score? — see what drove the D grade
The composite is a weighted blend of 9 inputs, each scored 0–100. Each bar is that input's sub-score; the figure is the points it added to the 100-point composite (weight × sub-score).
- Cash flow +12.5/30.0
- ARV discount +9.4/15.0
- DSCR +3.7/10.0
- Livability +3.6/5.0
- Schools +3.4/10.0
- 1% rule +3.1/10.0
- Rent growth +2.5/5.0
- Condition / age +2.5/5.0
- Appreciation +0.0/10.0
$260,000
🖨 Deal sheet 📄 Offer letter ✓ Due diligence
Listing remarks MLS
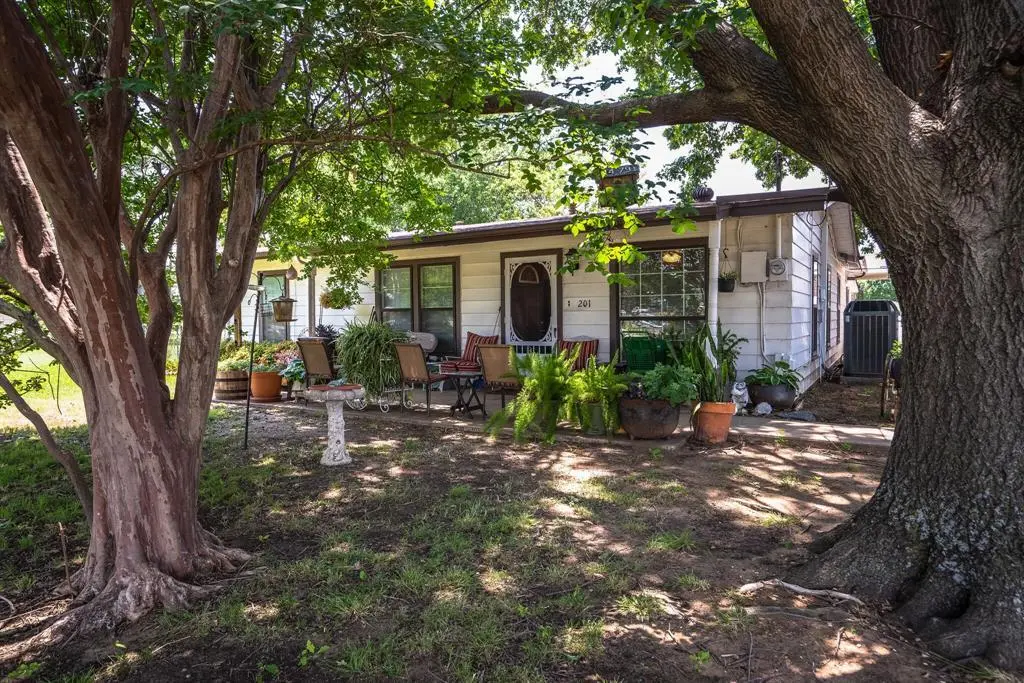
Charming Home with Commercial Zoning in Historic Downtown! 1 block from the ACE Hardware building currently under construction. Nestled on a generous .69-acre lot in the heart of historic downtown, this unique property offers incredible flexibility with commercial zoning—perfect for a live or work setup, office space, boutique business, or continued residential use. Surrounded by mature trees and lush greenery, it feels like a private retreat while still offering ample parking for clients, guests, or tenants. The oversized detached garage provides exceptional storage or workshop space, and the recently upgraded HVAC system ensures year-round comfort in the living areas. Whether you're looking to establish a business in a high-visibility location or simply enjoy the character of downtown living, this property blends charm, convenience, and opportunity. Don’t miss your chance to own a piece of history with endless potential! zoned c 3 with an I 35 overlay
Key facts
- Generous lot
- Upgraded hvac system
- Historic downtown
Tags
Neighborhood map
What this means for you Summary
Snapshot
- This is a 3-bed/2.0-bath single-family listed at $260k.
Deal economics
- At list price, monthly cash flow is $-36 ($-428/yr) — negative.
- To cash-flow at today's rent, offer at most $254k (2.4% below list).
- To meet the 1% rule (rent ≥ 1% of price), the offer needs to be $211k (18.8% below list).
- Recommended offer: $211k (18.8% below list) — sets the bar for 1% rule.
- Cap rate 6.1% vs local median 3.8% in Lake Dallas — top-decile yield for the area; either an underpriced asset or a hidden risk that comps aren't pricing in. Stress-test before assuming the spread holds.
Location & tenants
- Location reads 72/100 on livability (#264 in TX) — a middle-class / working-renter tenant base. Strengths: crime A+, cost of living A+, housing A+; Watch: amenities F, commute F, health & safety D-.
- Lake Dallas ISD (suburban): math 34% / reading 39% proficiency, ranked #413 of 826 in TX (top 50%) — families likely to look elsewhere, expect single-tenant / working-renter base with shorter leases.
- Market conditions: 130 active listings in the ZIP; 7 comparable units currently listed for rent nearby; rentals leasing fast (median 3d on market — plan ~1-2 weeks tenant-placement turnaround); 10,531 units permitted in Denton County in 2024 (2,713 in 5+ unit buildings).
Forward outlook
- Local home prices are declining (-3.0%/yr); year-one equity from $2k of loan paydown is wiped out by about $8k of value loss. Plan a longer hold.
- Denton County population projected at +66% by 2050 — long-run rental-demand tailwind backs the buy-and-hold thesis.
Negotiation context
- It's been on market 379 days — a 12% lower offer ($229k) is reasonable based on typical stale-listing flexibility.
- 3 sale attempts since 4y ago; this cycle's ask has dropped $165k (39%) from the opening price — seller is motivated, your offer sets the floor, not the list.
- Current owner paid $85k; list at $260k implies a 206% gain — meaningful room to come down on a strong offer.
Risks & watch-outs
- Watch-outs: built in 1959 — expect roof / HVAC / electrical / plumbing capex.
- Climate carrying-cost: moderate wind risk, 26% chance of damaging wind over 30y; extreme-heat days projected 7→23/yr by 2055 (HVAC capex compounding) — expect insurance premiums to compound above CPI over the hold.
Questions for the listing agent
- What do current leases actually rent for vs. the listed asking? Can we see a recent rent roll and the last 12 months of T-12 income?
- It's been on market 379 days. Have you received any prior offers? Is the seller open to a 19% concession, seller financing, or rate buy-down credit?
- Built in 1959 — when were the roof, HVAC, electrical panel, plumbing, and water heater last replaced?
- Why hasn't it sold? Are there any deal-killer items the seller is aware of (foundation, flood, title, zoning, code violations)?
- Is there a deadline driving the sale (1031 exchange, divorce, estate, relocation)? That informs how much negotiation room exists.
- The area grade is low — what's the realistic commute time and amenity access for the typical tenant pool here? Any planned neighborhood developments (good or bad) we should know about?
- What's the average days-on-market for RENTAL listings here right now (not sales)? A rising rental-DOM trend means longer vacancies and softer asking-rent achievability than the comps imply.
- What's the recent tenant-quality profile in this submarket — average credit score on applications, eviction rate, late-payment / NSF rate, and stable-employment percentage? A property-management company in the area should have these aggregated.
- How much new for-sale + rental construction is in the pipeline within 1–3 miles? Heavy new supply typically softens prices + rents 12–24 months out; constrained supply supports both.
Investment metrics
- 1% rule
- 0.81% ✗
- Cap rate
- 6.13%
- Cash-on-cash
- -0.59%
- DSCR
- 0.97
- GRM
- 10.3
CMA / ARV
- ARV (median comp)
- $271,341
- List price
- $260,000
- Delta
- -4.18%
- Verdict
- FAIR
- Comps
- 20 within 1.0 mi
Show comp detail 12 sales within ~0.75 mi
| Address | Dist | Beds/Ba | Sqft | Sold | Price | $/sf | Match |
|---|---|---|---|---|---|---|---|
| 401 Columbia Cir | 0.20mi | 3/2.0 | 1,164 (-4%) | 0mo | $267,300 | $230 | 84 |
| 299 Boliver Ave | 0.54mi | 3/2.0 | 1,262 (+4%) | 1mo | $275,000 | $218 | 67 |
| 5403 Countess Ct | 0.48mi | 3/2.0 | 1,218 (+0%) | 13mo | $232,000 | $190 | 66 |
| 5409 Kings Manor Dr | 0.54mi | 3/2.0 | 1,228 (+1%) | 10mo | $279,000 | $227 | 64 |
| 5513 Pawn Ct | 0.63mi | 3/2.0 | 1,186 (-2%) | 16mo | $249,900 | $211 | 53 |
| 315 Texas Dr | 0.54mi | 3/2.0 | 1,273 (+5%) | 17mo | $299,000 | $235 | 52 |
| 607 Cain St | 0.64mi | 3/1.0 | 1,256 (+4%) | 10mo | $315,000 | $251 | 52 |
| 402 Stockard St | 0.64mi | 3/2.0 | 1,320 (+9%) | 7mo | $269,900 | $204 | 50 |
| 5414 Prince Dr | 0.61mi | 3/1.5 | 1,180 (-3%) | 23mo | $289,900 | $246 | 46 |
| 612 Cain St | 0.68mi | 3/1.0 | 1,268 (+5%) | 14mo | $255,000 | $201 | 45 |
| 233 Adolphus Ave | 0.63mi | 3/2.0 | 1,370 (+13%) | 6mo | $318,000 | $232 | 44 |
| 304 Boliver Ave | 0.59mi | 3/2.0 | 1,374 (+13%) | 10mo | $299,999 | $218 | 42 |
Match score weights: distance 35% · size 25% · config 20% · recency 20%. Top-matched comps best support the ARV.
Projected returns pro-forma
-3.0% appreciation · 3.0% rent growth · sell at horizon
- IRR
- -17.3%
- Equity multiple
- 0.39×
- Total profit
- $-44,428
- Equity at exit
- $38,767
- IRR
- -9.3%
- Equity multiple
- 0.43×
- Total profit
- $-41,717
- Equity at exit
- $22,480
Cash invested: $72,800 (down + closing). Projections, not guarantees.
Landlord ↔ Tenant lean methodology
- Overall (STATE)
- 87 Strongly Landlord-Friendly
- State Texas
- 87 Strongly Landlord-Friendly · R+5
- County
- — inherits STATE
- City
- — inherits STATE
ZIP-level market 75065
- Home prices YoY
- -6.8%
- Active inventory
- 130
- Price-to-rent
- 10.3×
Monthly cashflow live
- Estimated rent
- $2,111 high interval (Pro) →
- Mortgage (P&I)
- −$1,363
- Tax from tax record
- −$231 /mo · $2,776/yr
- Insurance
- −$108
- HOA
- −$0
- Vacancy / Maint / Mgmt
- −$443
- Net cashflow
- $-36
Break-even live
UW: 25.0% down · 7.5% · 30yr · 1.5% tax · 5.0% vac · 8.0% maint · 8.0% mgmt
Financing live
Cash to close
- Down payment
- $65,000
- Closing costs
- $7,800
- Reserves months
- —
- Total cash needed
- —
Loan-product check · same deal, 3 products live
Conventional
25% down · 7.5% · 30yr
- Down + closing
- —
- Monthly P&I
- —
- Monthly cashflow
- —
- DSCR
- —
- Eligible?
- —
Personal DTI + credit; lowest rate.
DSCR
20% down · 8.5% · 30yr
- Down + closing
- —
- Monthly P&I
- —
- Monthly cashflow
- —
- DSCR
- —
- Eligible?
- —
No personal income docs; deal must DSCR.
Hard money
10% down · 12.0% · 12mo
- Down + closing
- —
- Monthly P&I
- —
- Monthly cashflow
- —
- DSCR
- —
- Eligible?
- —
Short-term bridge; refi at stabilization.
Rent comps 7 comps
| Address | Beds | Baths | Sqft | Rent | $/sqft | DOM | Units | Dist |
|---|---|---|---|---|---|---|---|---|
| 1021 Point Vista Rd Hickory Creek, TX | 2.0 | 2.0 | 1410 | $2,277 | $1.61 | 4d | 1 | 0.55mi |
| 5424 Prince Dr Lake Dallas, TX | 3.0 | 2.0 | 1254 | $1,800 | $1.44 | 43d | 1 | 0.62mi |
| 300 E Swisher Rd Lake Dallas, TX | 1.0–3.0 | 1.0–2.0 | 1037 | $2,085 | $2.01 | 2d | 8 | 0.65mi |
| 3300 S Garrison Rd Corinth, TX | 1.0–3.0 | 1.0–2.0 | 1006 | $2,265 | $2.25 | 2d | 34 | 1.11mi |
| 3150 Garrison Rd Corinth, TX | 1.0–3.0 | 1.0–2.0 | 1024 | $1,995 | $1.95 | 2d | 18 | 1.19mi |
| 3156 S Garrison Rd Unit 2016 Corinth, TX | 2.0 | 2.0 | 1390 | $1,515 | $1.09 | 24d | 1 | 1.35mi |
| 3500 FM 2181 Hickory Creek, TX | 1.0–3.0 | 1.0–2.0 | 1072 | $3,092 | $2.88 | 2d | 33 | 1.41mi |
Listing history 24 events
-
2026-06-18days on market $260,000 Active 379 DOM
-
2026-06-17pricedays on market $260,000 Active 378 DOM
-
2026-06-16days on market $250,000 Active 377 DOM
-
2026-06-15days on market $250,000 Active 376 DOM
-
2026-06-13statusdays on market $250,000 Active 374 DOM
-
2026-06-10status $250,000 Active Option Contract 370 DOM
-
2026-06-09days on market $250,000 Active 370 DOM
-
2026-06-08days on market $250,000 Active 369 DOM
-
2026-06-07days on market $250,000 Active 368 DOM
-
2026-06-04days on market $250,000 Active 365 DOM
-
2026-06-03days on market $250,000 Active 364 DOM
-
2026-06-02days on market $250,000 Active 363 DOM
-
2026-06-01days on market $250,000 Active 362 DOM
-
2026-05-31days on market $250,000 Active 361 DOM
-
2026-05-14price $400,000 997-char remark
Show marketing remark (997 chars)
Charming Home with Commercial Zoning in Historic Downtown! 1 block from the ACE Hardware building currently under construction. Nestled on a generous .69-acre lot in the heart of historic downtown, this unique property offers incredible flexibility with commercial zoning—perfect for a live or work setup, office space, boutique business, or continued residential use. Surrounded by mature trees and lush greenery, it feels like a private retreat while still offering ample parking for clients, guests, or tenants. The oversized detached garage provides exceptional storage or workshop space, and the recently upgraded HVAC system ensures year-round comfort in the living areas. Whether you're looking to establish a business in a high-visibility location or simply enjoy the character of downtown living, this property blends charm, convenience, and opportunity. Don’t miss your chance to own a piece of history with endless potential! zoned c 3 with an I 35 overlay
-
2025-06-04$425,000 Active 997-char remark
Show marketing remark (997 chars)
Charming Home with Commercial Zoning in Historic Downtown! 1 block from the ACE Hardware building currently under construction. Nestled on a generous .69-acre lot in the heart of historic downtown, this unique property offers incredible flexibility with commercial zoning—perfect for a live or work setup, office space, boutique business, or continued residential use. Surrounded by mature trees and lush greenery, it feels like a private retreat while still offering ample parking for clients, guests, or tenants. The oversized detached garage provides exceptional storage or workshop space, and the recently upgraded HVAC system ensures year-round comfort in the living areas. Whether you're looking to establish a business in a high-visibility location or simply enjoy the character of downtown living, this property blends charm, convenience, and opportunity. Don’t miss your chance to own a piece of history with endless potential! zoned c 3 with an I 35 overlay
-
2022-10-25historical
-
2022-09-06price $375,000
-
2022-08-03price $385,000
-
2022-07-05price $2,950
-
2022-07-05$425,000 Active
-
2022-05-29historical
-
2022-05-23$425,000 Active
-
2001-03-15soldstatus $85,000
ⓘ Source: listings_history table (triggers on properties + properties_extension) + one-shot
backfill from property_details.listing_events for pre-trigger history.
Tax reassessment forecast TX · Resets to sale price
- Current annual tax
- $2,776 · $231/mo
- Projected year-2 tax
- $4,758 · $396/mo
- Expected delta
- +$1,982/yr (+$165/mo · 71.4%)
ⓘ Screening estimate from a state-policy table — verify with the county assessor before closing.
Climate risk First Street
- Flood 1/10 Low FEMA zone X (unshaded) · 0% chance over 30 yrs
- Wildfire 3/10 Moderate
- Heat 7/10 Severe 7 d/yr ≥109°F today · 23 d/yr by 30 yrs out
- Wind 5/10 Major 26% chance of damaging wind over 30 yrs
- Air quality 4/10 Moderate 4 unhealthy d/yr today · 5 by 30 yrs out
Nearby sold comps map
Loading sold comps map…
Walkable amenities ~0.75 mi
Loading nearby amenities…
Taxation est. · year 1
- Rental income
- $25,329
- − Mortgage interest
- −$14,564
- − Property taxes
- −$2,776
- − Insurance
- −$1,300
- − Repairs & maintenance
- −$2,026
- − Management
- −$2,026
- − Depreciation
- −$7,564
- Taxable loss
- −$4,928
- Est. tax savings @ 24.0%
- +$1,183
- After-tax cash flow
- $755/yr
For passive investors: Depreciation is non-cash, so a rental often shows a tax loss while cash-flowing — sheltering income. Rental losses are passive: they offset passive income freely, and up to $25,000/yr can offset ordinary (W-2) income if you actively participate and your MAGI is under $100k (phasing out to $0 by $150k); unused losses carry forward. On sale, claimed depreciation is recaptured at up to 25%, and gains may owe capital-gains tax (a 1031 exchange can defer both). Figures are a year-1 estimate at your 24.0% rate — not tax advice; consult a CPA.
Schools (NCES district)
- District
- Lake Dallas ISD
- NCES district ID
- 4826430
- Math proficiency
- 34% ▼ -20.00%
- Reading proficiency
- 39% ▼ -10.00%
- Median HH income
- $76,645
- Composite
- 34.13/100
- National rank
- #5287
- State rank
- #413 of 826 in TX
Livability — Lake Dallas
- Score
- 72/100
- State rank
- #264
- US rank
- #6218
Category grades
Schools grade is shown separately in the Schools card above.
Census & demographics
- Census place
- Lake Dallas, TX
- Population (ZIP)
- 13,046
Population outlook (Denton County) Hauer SSP2
- Today (2025)
- 1,053,010 people
- By 2030
- 1,192,269 · +13.2%
- By 2040
- 1,472,920 · +39.9%
- By 2050
- 1,746,506 · +65.9%
- By 2075
- 2,358,497 · +124.0%
- By 2100
- 2,779,183 · +163.9%
Race, ethnicity, and origin ACS 2023
- Neighborhood character
- Majority White (62%)
- Race & ethnicity
- White 62% Hispanic / Latino 27% Two or more races 13% Black 6% Asian 3%
- Hispanic origin (detail)
- Mexican 23%
- Common ancestry
- Italian 9% Slovak 2% Serbian 1%
- Foreign-born
- 20% · Canada, South Korea, United Kingdom
- Languages at home
- 73% English-only · Spanish 21% Korean 2% Other Asian/Pacific 1%
Political lean MEDSL · Denton
- 2024 margin
- R (+13.2) · D 42.7% · R 55.8% · Other 1.5%
- 2008→2024 swing
- +11.0pp toward D · 2008: -24.2pp · 2024: -13.2pp
- All cycles
- 2024: R+13.2 2020: R+8.1 2016: R+20.2 2012: R+31.7 2008: R+24.2
Not yet ingested
- Civics
- —
Market trends
- HPI YoY
- ▼ -21.91%
- Current HPI
- 300.0981
- Rent YoY
- —
- Metro
- —
- State GDP YoY
- ▲ 3.95%
- F500 in state
- 110
Industry mix (Fortune 500 HQ in TX)
| Industry | F500 HQs | Revenue |
|---|---|---|
| Energy | 16 | $1,198B |
|
||
| Technology | 5 | $198B |
|
||
| Engineering / Construction | 4 | $72B |
|
||
| Energy Services | 3 | $60B |
|
||
| Utilities | 3 | $41B |
|
||
| Healthcare | 2 | $330B |
|
||
Price history
+370.6% since first listed10 events — show timeline
- 2026-05-14 Price Changed $400,000 NTREIS
- 2025-06-04 Listed $425,000 NTREIS
- 2022-10-25 Listing Removed — NTREIS
- 2022-09-06 Price Changed $375,000 NTREIS
- 2022-08-03 Price Changed $385,000 NTREIS
- 2022-07-05 Price Changed $2,950 RENT.
- 2022-07-05 Listed $425,000 NTREIS
- 2022-05-29 Listing Removed — NTREIS
- 2022-05-23 Listed $425,000 NTREIS
- 2001-03-15 Sold (Public Records) $85,000 Public Records
Property tax history
+0.8%/yrLatest (2025): $2,776 · +12.2% YoY. Source: county tax records.
Cash-flow waterfall
monthlySold comps — $/sqft
last 12 mo · ≤1 miLoading sold comps…