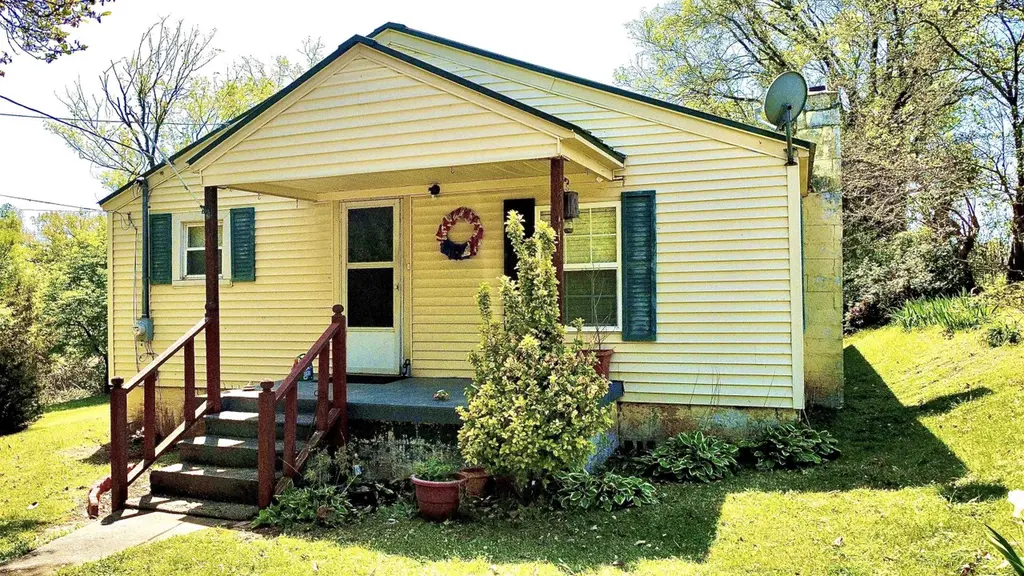
406 Patton St · Florence, AL
Flood risk 1/10 · Minimal
- FEMA flood zone
- X (unshaded)
- Chance of flooding over 30 yrs
- 0.0%
- Est. flood insurance / yr
- $507 – $1,088
Fire risk 2/10 · Minimal
- Est. fire insurance / yr
- $916 – $1,700
Heat risk 6/10 · Moderate
- Hot days now (above 107°F)
- 7 days/yr
- Hot days in 30 yrs
- 20 days/yr
Wind risk 4/10 · Minor
- Chance of severe wind over 30 yrs
- 22.0%
Air-quality risk 2/10 · Minimal
- Unhealthy air days now
- 0 days/yr
- Unhealthy air days in 30 yrs
- 2 days/yr
Risk factors via First Street. Map © Google.
Why this score? — see what drove the B grade
The composite is a weighted blend of 9 inputs, each scored 0–100. Each bar is that input's sub-score; the figure is the points it added to the 100-point composite (weight × sub-score).
- Cash flow +28.0/30.0
- ARV discount +11.0/15.0
- DSCR +9.9/10.0
- 1% rule +7.7/10.0
- Livability +4.1/5.0
- Rent growth +4.0/5.0
- Schools +3.0/10.0
- Condition / age +2.5/5.0
- Appreciation +0.0/10.0
$85,000
🖨 Deal sheet 📄 Offer letter ✓ Due diligence
Listing remarks MLS
Investor Opportunity Near North Alabama Medical Center! Located at 406 S Patton St in Florence, this property offers a great opportunity for investors, flippers, or those looking for their next project. Conveniently situated just minutes from North Alabama Medical Center, as well as shopping, dining, and everyday amenities, the location is a major advantage. This home features a bonus room, offering additional flexibility for a home office, extra bedroom, or expanded living space—adding even more potential for value. Ready for a full transformation, this property is ideal for those with vision and creativity. Whether you're looking to renovate and resell or add to your rental portfolio, this is a chance to maximize returns in a desirable area. Bring your ideas and make the most of this investment opportunity—properties with this kind of potential and location don’t come around often! Property is being sold as-is.
Key facts
- Bonus room
- 0.34 acre lot
- Built 1951
Tags
Neighborhood map
What this means for you Summary
Snapshot
- This is a 2-bed/1.0-bath single-family listed at $85k.
Deal economics
- At list price, monthly cash flow is $265 ($3k/yr) — positive.
- The deal already cash-flows at list — no discount required.
- Meets the 1% rule at list price ($1k rent vs $85k).
- Recommended offer: $80k (6.0% below list) — sets the bar for market timing.
- Cap rate 10.0% vs local median 3.6% in Florence — top-decile yield for the area; either an underpriced asset or a hidden risk that comps aren't pricing in. Stress-test before assuming the spread holds.
Location & tenants
- Location reads 82/100 on livability (#4 in AL, #1,140 nationally) — a professional / high-income tenant draw. Strengths: amenities A+, commute A+, cost of living A+; Watch: crime F, employment F.
- Florence City (urban): math 28% / reading 44% proficiency, ranked #44 of 129 in AL (top 34%) — families likely to look elsewhere, expect single-tenant / working-renter base with shorter leases.
- Market conditions: Rents rising fast (+6.2%/yr); 268 active listings in the ZIP; 6 comparable units currently listed for rent nearby; rentals lingering (median 44d on market — plan ~5-8 weeks vacancy on turnover, expect pricing pressure); 100% of comp listings sitting > 30 days — soft ceiling on asking rent; 164 units permitted in Lauderdale County in 2024 (72 in 5+ unit buildings).
Forward outlook
- Local home prices are declining (-3.0%/yr); year-one equity from $588 of loan paydown is wiped out by about $3k of value loss. Plan a longer hold.
- At projected returns (-3.0% appreciation + 6.2% rent growth), your $24k cash investment doubles in ~7 years — after that, you're playing with house money.
Negotiation context
- It's been on market 72 days — a 6% lower offer ($80k) is reasonable based on typical stale-listing flexibility.
Risks & watch-outs
- Watch-outs: built in 1951 — expect roof / HVAC / electrical / plumbing capex.
- Climate carrying-cost: extreme-heat days projected 7→20/yr by 2055 (HVAC capex compounding) — expect insurance premiums to compound above CPI over the hold.
Questions for the listing agent
- It's been on market 72 days. Have you received any prior offers? Is the seller open to a 6% concession, seller financing, or rate buy-down credit?
- Built in 1951 — when were the roof, HVAC, electrical panel, plumbing, and water heater last replaced?
- Why hasn't it sold? Are there any deal-killer items the seller is aware of (foundation, flood, title, zoning, code violations)?
- Is there a deadline driving the sale (1031 exchange, divorce, estate, relocation)? That informs how much negotiation room exists.
- Crime grade is F in this area — have there been break-ins, vandalism, or insurance claims at this property in the last 3 years? What carrier currently insures it and at what premium?
- What's the average days-on-market for RENTAL listings here right now (not sales)? A rising rental-DOM trend means longer vacancies and softer asking-rent achievability than the comps imply.
- What's the recent tenant-quality profile in this submarket — average credit score on applications, eviction rate, late-payment / NSF rate, and stable-employment percentage? A property-management company in the area should have these aggregated.
- How much new for-sale + rental construction is in the pipeline within 1–3 miles? Heavy new supply typically softens prices + rents 12–24 months out; constrained supply supports both.
Investment metrics
- 1% rule
- 1.27% ✓
- Cap rate
- 10.03%
- Cash-on-cash
- 13.36%
- DSCR
- 1.59
- GRM
- 6.6
CMA / ARV
- ARV (median comp)
- $92,153
- List price
- $85,000
- Delta
- -7.76%
- Verdict
- FAIR
- Comps
- 20 within 1.0 mi
Show comp detail 12 sales within ~0.75 mi
| Address | Dist | Beds/Ba | Sqft | Sold | Price | $/sf | Match |
|---|---|---|---|---|---|---|---|
| 302 S Patton St | 0.12mi | 2/1.0 | 972 (+2%) | 9mo | $160,000 | $165 | 84 |
| 525 S Richards St | 0.16mi | 2/1.0 | 981 (+2%) | 13mo | $89,000 | $91 | 77 |
| 2924 Woodard Ave | 0.41mi | 2/1.0 | 961 (+0%) | 6mo | $47,500 | $49 | 75 |
| 333 S Richards St | 0.12mi | 1/1.0 (-1) | 836 (-13%) | 1mo | $47,500 | $57 | 68 |
| 309 S Patton St | 0.11mi | 2/2.0 | 1,068 (+12%) | 12mo | $157,000 | $147 | 61 |
| 301 N Kirkman St | 0.50mi | 2/1.0 | 950 (-1%) | 18mo | $85,000 | $89 | 60 |
| 202 Minniehaha | 0.62mi | 2/1.0 | 975 (+2%) | 10mo | $99,500 | $102 | 60 |
| 2314 Cole Ave | 0.09mi | 3/1.0 (+1) | 1,100 (+15%) | 12mo | $129,000 | $117 | 56 |
| 305 Minniehaha | 0.63mi | 2/2.0 | 980 (+2%) | 11mo | $130,000 | $133 | 53 |
| 12 S Franklin St | 0.69mi | 3/2.0 (+1) | 1,012 (+6%) | 8mo | $89,500 | $88 | 43 |
| 327 S Main St | 0.47mi | 3/2.0 (+1) | 1,068 (+12%) | 12mo | $125,000 | $117 | 40 |
| 506 Sweetwater Ave | 0.66mi | 2/2.0 | 1,100 (+15%) | 15mo | $130,700 | $119 | 28 |
Match score weights: distance 35% · size 25% · config 20% · recency 20%. Top-matched comps best support the ARV.
Projected returns pro-forma
-3.0% appreciation · 6.18% rent growth · sell at horizon
- IRR
- 6.9%
- Equity multiple
- 1.28×
- Total profit
- $6,677
- Equity at exit
- $12,674
- IRR
- 18.9%
- Equity multiple
- 2.82×
- Total profit
- $43,209
- Equity at exit
- $7,349
Cash invested: $23,800 (down + closing). Projections, not guarantees.
Landlord ↔ Tenant lean methodology
- Overall (STATE)
- 90 Strongly Landlord-Friendly
- State Alabama
- 90 Strongly Landlord-Friendly · R+15
- County
- — inherits STATE
- City
- — inherits STATE
ZIP-level market 35630
- Home prices YoY
- -33.7%
- Rents YoY
- 6.2%
- Active inventory
- 268
- Price-to-rent
- 6.6×
Monthly cashflow live
- Estimated rent
- $1,079 high interval (Pro) →
- Mortgage (P&I)
- −$446
- Tax est. 1.5%
- −$106 /mo · $1,275/yr
- Insurance
- −$35
- HOA
- −$0
- Vacancy / Maint / Mgmt
- −$227
- Net cashflow
- $265
Break-even live
UW: 25.0% down · 7.5% · 30yr · 1.5% tax · 5.0% vac · 8.0% maint · 8.0% mgmt
Financing live
Cash to close
- Down payment
- $21,250
- Closing costs
- $2,550
- Reserves months
- —
- Total cash needed
- —
Loan-product check · same deal, 3 products live
Conventional
25% down · 7.5% · 30yr
- Down + closing
- —
- Monthly P&I
- —
- Monthly cashflow
- —
- DSCR
- —
- Eligible?
- —
Personal DTI + credit; lowest rate.
DSCR
20% down · 8.5% · 30yr
- Down + closing
- —
- Monthly P&I
- —
- Monthly cashflow
- —
- DSCR
- —
- Eligible?
- —
No personal income docs; deal must DSCR.
Hard money
10% down · 12.0% · 12mo
- Down + closing
- —
- Monthly P&I
- —
- Monthly cashflow
- —
- DSCR
- —
- Eligible?
- —
Short-term bridge; refi at stabilization.
Rent comps 6 comps
| Address | Beds | Baths | Sqft | Rent | $/sqft | DOM | Units | Dist |
|---|---|---|---|---|---|---|---|---|
| 211 N Patton St Unit 1510 Florence, AL | 2.0 | 1.0 | 850 | $825 | $0.97 | 44d | 1 | 0.41mi |
| 3504 Cole Ave Unit B Florence, AL | 2.0 | 1.0 | 900 | $750 | $0.83 | 44d | 1 | 0.70mi |
| 416 N Broadway St Florence, AL | 3.0 | 2.0 | 1125 | $1,450 | $1.29 | 44d | 1 | 0.97mi |
| 1110 E Limestone St Unit 1 Florence, AL | 2.0 | 1.0 | 840 | $1,600 | $1.90 | 44d | 1 | 1.09mi |
| 1825 Darby Dr Apt G6 Florence, AL | 1.0 | 1.0 | 895 | $675 | $0.75 | 44d | 1 | 1.37mi |
| 801 E Mobile St Unit 2 Florence, AL | 1.0 | 1.0 | 550 | $775 | $1.41 | 44d | 1 | 1.41mi |
Listing history 16 events
-
2026-06-19days on market $85,000 Active 72 DOM
-
2026-06-18days on market $85,000 Active 71 DOM
-
2026-06-17days on market $85,000 Active 70 DOM
-
2026-06-16days on market $85,000 Active 69 DOM
-
2026-06-15days on market $85,000 Active 68 DOM
-
2026-06-14days on market $85,000 Active 66 DOM
-
2026-06-13days on market $85,000 Active 65 DOM
-
2026-06-10days on market $85,000 Active 63 DOM
-
2026-06-09days on market $85,000 Active 62 DOM
-
2026-06-08days on market $85,000 Active 61 DOM
-
2026-06-05pricedays on market $85,000 Active 57 DOM
-
2026-06-02days on market $120,000 Active 55 DOM
-
2026-06-01days on market $120,000 Active 54 DOM
-
2026-05-31days on market $120,000 Active 53 DOM
-
2026-05-30days on market $120,000 Active 52 DOM
-
2026-04-08$120,000 Active 944-char remark
Show marketing remark (944 chars)
Investor Opportunity Near North Alabama Medical Center! Located at 406 S Patton St in Florence, this property offers a great opportunity for investors, flippers, or those looking for their next project. Conveniently situated just minutes from North Alabama Medical Center, as well as shopping, dining, and everyday amenities, the location is a major advantage. This home features a bonus room, offering additional flexibility for a home office, extra bedroom, or expanded living space—adding even more potential for value. Ready for a full transformation, this property is ideal for those with vision and creativity. Whether you're looking to renovate and resell or add to your rental portfolio, this is a chance to maximize returns in a desirable area. Bring your ideas and make the most of this investment opportunity—properties with this kind of potential and location don’t come around often! Property is being sold as-is.
ⓘ Source: listings_history table (triggers on properties + properties_extension) + one-shot
backfill from property_details.listing_events for pre-trigger history.
Climate risk First Street
- Flood 1/10 Low FEMA zone X (unshaded) · 0% chance over 30 yrs
- Wildfire 2/10 Low
- Heat 6/10 Major 7 d/yr ≥107°F today · 20 d/yr by 30 yrs out
- Wind 4/10 Moderate 22% chance of damaging wind over 30 yrs
- Air quality 2/10 Low 0 unhealthy d/yr today · 2 by 30 yrs out
Nearby sold comps map
Loading sold comps map…
Walkable amenities ~0.75 mi
Loading nearby amenities…
Taxation est. · year 1
- Rental income
- $12,947
- − Mortgage interest
- −$4,761
- − Property taxes
- −$1,275
- − Insurance
- −$425
- − Repairs & maintenance
- −$1,036
- − Management
- −$1,036
- − Depreciation
- −$2,473
- Taxable income
- $1,941
- Est. tax owed @ 24.0%
- −$466
- After-tax cash flow
- $2,713/yr
For passive investors: Depreciation is non-cash, so a rental often shows a tax loss while cash-flowing — sheltering income. Rental losses are passive: they offset passive income freely, and up to $25,000/yr can offset ordinary (W-2) income if you actively participate and your MAGI is under $100k (phasing out to $0 by $150k); unused losses carry forward. On sale, claimed depreciation is recaptured at up to 25%, and gains may owe capital-gains tax (a 1031 exchange can defer both). Figures are a year-1 estimate at your 24.0% rate — not tax advice; consult a CPA.
Schools (NCES district)
- District
- Florence City
- NCES district ID
- 0101530
- Math proficiency
- 28% ▼ -28.00%
- Reading proficiency
- 44% ▼ -4.00%
- Median HH income
- $34,997
- Composite
- 29.69/100
- National rank
- #6456
- State rank
- #44 of 129 in AL
Livability — Florence
- Score
- 82/100
- State rank
- #4
- US rank
- #1140
Category grades
Schools grade is shown separately in the Schools card above.
Census & demographics
- Census place
- Florence, AL
- County
- Lauderdale County · 47,988 people
- City population
- 34,028
- Metro
- Florence-Muscle Shoals, AL
- Population (ZIP)
- 34,028
- Household income
- $46,304
- Rent vs Own
- Severe rent burden
- 1516.0
Population outlook (Lauderdale County) Hauer SSP2
- Today (2025)
- 93,386 people
- By 2030
- 93,634 · +0.3%
- By 2040
- 93,114 · -0.3%
- By 2050
- 91,586 · -1.9%
- By 2075
- 88,667 · -5.1%
- By 2100
- 81,098 · -13.2%
Race, ethnicity, and origin ACS 2023
- Neighborhood character
- Predominantly White (70%)
- Race & ethnicity
- White 70% Black 18% Two or more races 6% Hispanic / Latino 6%
- Hispanic origin (detail)
- Mexican 5%
- Common ancestry
- Slovak 3% Serbian 2% Romanian 1%
- Foreign-born
- 4% · Canada, Vietnam, Guatemala
- Languages at home
- 92% English-only · Spanish 6% Vietnamese 1%
Political lean MEDSL · Lauderdale
- 2024 margin
- Solid R (+51.5) · D 23.8% · R 75.3%
- 2008→2024 swing
- -23.3pp toward R · 2008: -28.2pp · 2024: -51.5pp
- All cycles
- 2024: R+51.5 2020: R+44.7 2016: R+46.0 2012: R+30.9 2008: R+28.2
Not yet ingested
- Civics
- —
Market trends
- HPI YoY
- ▼ -104.78%
- Current HPI
- 206.1364
- Rent YoY
- ▲ 6.18%
- Metro
- Florence-Muscle Shoals, AL
- State GDP YoY
- ▲ 2.94%
- F500 in state
- 4
Industry mix (Fortune 500 HQ in AL)
| Industry | F500 HQs | Revenue |
|---|---|---|
| Financial Services | 1 | $8B |
|
||
| Healthcare | 1 | $5B |
|
||
Price history
1 event — show timeline
- 2026-04-08 Listed $120,000 SAARMLS
Cash-flow waterfall
monthlySold comps — $/sqft
last 12 mo · ≤1 miLoading sold comps…