117 SE 298th St · Cross City, FL
Flood risk 6/10 · Moderate
- FEMA flood zone
- X (unshaded)
- Chance of flooding over 30 yrs
- 0.75%
- Est. flood insurance / yr
- $507 – $1,088
Fire risk 6/10 · Moderate
- Est. fire insurance / yr
- $947 – $1,759
Heat risk 8/10 · Major
- Hot days now (above 105°F)
- 7 days/yr
- Hot days in 30 yrs
- 22 days/yr
Wind risk 9/10 · Severe
- Chance of severe wind over 30 yrs
- 99.0%
Air-quality risk 2/10 · Minimal
- Unhealthy air days now
- 1 days/yr
- Unhealthy air days in 30 yrs
- 2 days/yr
Risk factors via First Street. Map © Google.
Why this score? — see what drove the C- grade
The composite is a weighted blend of 9 inputs, each scored 0–100. Each bar is that input's sub-score; the figure is the points it added to the 100-point composite (weight × sub-score).
- Cash flow +16.7/30.0
- ARV discount +8.8/15.0
- Appreciation +7.1/10.0
- DSCR +5.2/10.0
- Schools +4.2/10.0
- 1% rule +3.5/10.0
- Livability +3.5/5.0
- Rent growth +2.5/5.0
- Condition / age +2.5/5.0
$114,900
🖨 Deal sheet 📄 Offer letter ✓ Due diligence
Listing remarks
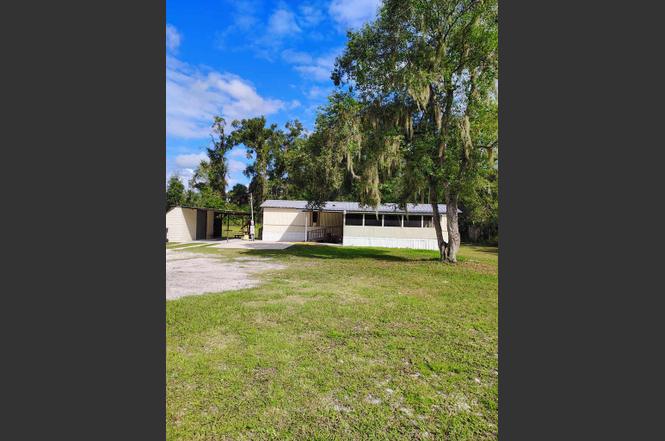
This property features a single-wide mobile home with two bedrooms and two bathrooms, along with an addition that can serve as an office space or a third bedroom. The open floor plan enhances the living area, making it a great place for friends and family to gather. The exterior includes a carport with a concrete slab and a utility shed for storing tools and equipment. Additionally, there is a spacious screened-in front porch and a covered back porch, perfect for enjoying the outdoors. The residence is located on a 0.46-acre lot in Cross City, Florida, which is situated in Dixie County. Dixie County is in northern Florida, bordered by the Gulf of Mexico, and is known for its beautiful lands
Key facts
- Office space
- Open floor plan
- Utility shed
Tags
Property features AI
Exterior
- Parking: Concrete parking surface
- Home design: Mobile home; Residential property; Located in Gauldens 2nd Addition
- Construction: Aluminum siding; Metal roof
- Exterior features: Wooded lot
Interior
- Kitchen: Refrigerator
- Bedrooms: 2 total rooms
- Flooring: Carpet; Vinyl
- Bathrooms: 2 full bathrooms
- Interior features: Crawl space foundation
Neighborhood map
What this means for you Summary
Snapshot
- This is a 2-bed/2.0-bath manufactured listed at $115k.
Deal economics
- At list price, monthly cash flow is $72 ($862/yr) — positive.
- The deal already cash-flows at list — no discount required.
- To meet the 1% rule (rent ≥ 1% of price), the offer needs to be $97k (15.3% below list).
- Recommended offer: $97k (15.3% below list) — sets the bar for 1% rule.
- Cap rate 7.0% vs local median 4.0% in Cross City — top-decile yield for the area; either an underpriced asset or a hidden risk that comps aren't pricing in. Stress-test before assuming the spread holds.
Location & tenants
- Location reads 70/100 on livability (#412 in FL) — a middle-class / working-renter tenant base. Strengths: cost of living A+, housing A+, health & safety A+; Watch: amenities F, commute F, employment F.
- Dixie (rural): math 52% / reading 50% proficiency, ranked #36 of 73 in FL (top 49%) — acceptable for families but not a draw, mixed tenant base, ~2y average lease; 85% free/reduced lunch — lower-income household profile, screen leases tightly.
- Market conditions: 47 active listings in the ZIP; 49 units permitted in Dixie County in 2024 (0 in 5+ unit buildings).
Forward outlook
- In year one you build about $6k of equity ($794 loan paydown + $5k appreciation (4.2% local appreciation)).
- Dixie County population projected at -16% by 2050 — secular population decline; favor cash flow + early exit over multi-decade hold.
- At projected returns (4.2% appreciation + 3.0% rent growth), your $32k cash investment doubles in ~5 years — after that, you're playing with house money.
- By year 7, paydown + projected appreciation supports a ~$36k cash-out refi (75% LTV) — recoverable capital for the next deal without selling this one.
Negotiation context
- It's been on market 167 days — a 12% lower offer ($101k) is reasonable based on typical stale-listing flexibility.
- 2 sale attempts with the ask held roughly flat each time — persistent listings suggest the price (not the market) is what's stuck; bring a comps-based counter.
- Current owner paid $29k; list at $115k implies a 296% gain — meaningful room to come down on a strong offer.
Risks & watch-outs
- Climate carrying-cost: major flood risk; severe wind risk, 99% chance of damaging wind over 30y; major wildfire risk; extreme-heat days projected 7→22/yr by 2055 (HVAC capex compounding) — expect insurance premiums to compound above CPI over the hold.
Questions for the listing agent
- It's been on market 167 days. Have you received any prior offers? Is the seller open to a 15% concession, seller financing, or rate buy-down credit?
- Why hasn't it sold? Are there any deal-killer items the seller is aware of (foundation, flood, title, zoning, code violations)?
- Is there a deadline driving the sale (1031 exchange, divorce, estate, relocation)? That informs how much negotiation room exists.
- What's the average days-on-market for RENTAL listings here right now (not sales)? A rising rental-DOM trend means longer vacancies and softer asking-rent achievability than the comps imply.
- What's the recent tenant-quality profile in this submarket — average credit score on applications, eviction rate, late-payment / NSF rate, and stable-employment percentage? A property-management company in the area should have these aggregated.
- How much new for-sale + rental construction is in the pipeline within 1–3 miles? Heavy new supply typically softens prices + rents 12–24 months out; constrained supply supports both.
Investment metrics
- 1% rule
- 0.85% ✗
- Cap rate
- 7.04%
- Cash-on-cash
- 2.68%
- DSCR
- 1.12
- GRM
- 9.8
CMA / ARV
- ARV (on-the-fly)
- $118,384
- Comps found
- 2
Show comp detail 2 sales within ~0.75 mi
| Address | Dist | Beds/Ba | Sqft | Sold | Price | $/sf | Match |
|---|---|---|---|---|---|---|---|
| 140 SE 32nd Ave | 0.12mi | 2/2.0 | 840 (+7%) | 6mo | $127,000 | $151 | 77 |
| 138 SE 278th St | 0.36mi | 2/2.0 | 864 (+10%) | 3mo | $95,000 | $110 | 64 |
Match score weights: distance 35% · size 25% · config 20% · recency 20%. Top-matched comps best support the ARV.
Projected returns pro-forma
4.18% appreciation · 3.0% rent growth · sell at horizon
- IRR
- 13.1%
- Equity multiple
- 1.80×
- Total profit
- $25,710
- Equity at exit
- $59,473
- IRR
- 14.3%
- Equity multiple
- 3.38×
- Total profit
- $76,458
- Equity at exit
- $98,256
Cash invested: $32,172 (down + closing). Projections, not guarantees.
Landlord ↔ Tenant lean methodology
- Overall (STATE)
- 87 Strongly Landlord-Friendly
- State Florida
- 87 Strongly Landlord-Friendly · R+3
- County
- — inherits STATE
- City
- — inherits STATE
ZIP-level market 32628
- Home prices YoY
- 1.1%
- Active inventory
- 47
- Price-to-rent
- 9.8×
Monthly cashflow live
- Estimated rent
- $973 medium interval (Pro) →
- Mortgage (P&I)
- −$603
- Tax from tax record
- −$46 /mo · $554/yr
- Insurance
- −$48
- HOA
- −$0
- Vacancy / Maint / Mgmt
- −$204
- Net cashflow
- $72
Break-even live
UW: 25.0% down · 7.5% · 30yr · 1.5% tax · 5.0% vac · 8.0% maint · 8.0% mgmt
Financing live
Cash to close
- Down payment
- $28,725
- Closing costs
- $3,447
- Reserves months
- —
- Total cash needed
- —
Loan-product check · same deal, 3 products live
Conventional
25% down · 7.5% · 30yr
- Down + closing
- —
- Monthly P&I
- —
- Monthly cashflow
- —
- DSCR
- —
- Eligible?
- —
Personal DTI + credit; lowest rate.
DSCR
20% down · 8.5% · 30yr
- Down + closing
- —
- Monthly P&I
- —
- Monthly cashflow
- —
- DSCR
- —
- Eligible?
- —
No personal income docs; deal must DSCR.
Hard money
10% down · 12.0% · 12mo
- Down + closing
- —
- Monthly P&I
- —
- Monthly cashflow
- —
- DSCR
- —
- Eligible?
- —
Short-term bridge; refi at stabilization.
Listing history 19 events
-
2026-06-18days on market $114,900 Active 167 DOM
-
2026-06-17days on market $114,900 Active 166 DOM
-
2026-06-16days on market $114,900 Active 165 DOM
-
2026-06-15days on market $114,900 Active 164 DOM
-
2026-06-13days on market $114,900 Active 162 DOM
-
2026-06-12days on market $114,900 Active 161 DOM
-
2026-06-09days on market $114,900 Active 158 DOM
-
2026-06-08days on market $114,900 Active 157 DOM
-
2026-06-07days on market $114,900 Active 156 DOM
-
2026-06-07days on market $114,900 Active 155 DOM
-
2026-06-04days on market $114,900 Active 152 DOM
-
2026-06-02days on market $114,900 Active 151 DOM
-
2026-06-01days on market $114,900 Active 150 DOM
-
2026-05-31days on market $114,900 Active 149 DOM
-
2026-05-31days on market $114,900 Active 148 DOM
-
2026-01-02$114,900 Active
-
2025-10-02$117,900 Active
-
2005-01-31soldstatus $29,000
-
2001-10-09soldstatus $27,000
ⓘ Source: listings_history table (triggers on properties + properties_extension) + one-shot
backfill from property_details.listing_events for pre-trigger history.
Tax reassessment forecast FL · Resets to sale price
- Current annual tax
- $554 · $46/mo
- Projected year-2 tax
- $954 · $79/mo
- Expected delta
- +$400/yr (+$33/mo · 72.1%)
ⓘ Screening estimate from a state-policy table — verify with the county assessor before closing.
Climate risk First Street
- Flood 6/10 Major FEMA zone X (unshaded) · 75% chance over 30 yrs
- Wildfire 6/10 Major
- Heat 8/10 Severe 7 d/yr ≥105°F today · 22 d/yr by 30 yrs out
- Wind 9/10 Extreme 99% chance of damaging wind over 30 yrs
- Air quality 2/10 Low 1 unhealthy d/yr today · 2 by 30 yrs out
Nearby sold comps map
Loading sold comps map…
Walkable amenities ~0.75 mi
Loading nearby amenities…
Taxation est. · year 1
- Rental income
- $11,672
- − Mortgage interest
- −$6,436
- − Property taxes
- −$554
- − Insurance
- −$574
- − Repairs & maintenance
- −$934
- − Management
- −$934
- − Depreciation
- −$3,343
- Taxable loss
- −$1,103
- Est. tax savings @ 24.0%
- +$265
- After-tax cash flow
- $1,126/yr
For passive investors: Depreciation is non-cash, so a rental often shows a tax loss while cash-flowing — sheltering income. Rental losses are passive: they offset passive income freely, and up to $25,000/yr can offset ordinary (W-2) income if you actively participate and your MAGI is under $100k (phasing out to $0 by $150k); unused losses carry forward. On sale, claimed depreciation is recaptured at up to 25%, and gains may owe capital-gains tax (a 1031 exchange can defer both). Figures are a year-1 estimate at your 24.0% rate — not tax advice; consult a CPA.
Schools (NCES district)
- District
- Dixie
- NCES district ID
- 1200450
- Math proficiency
- 52% ▼ -3.00%
- Reading proficiency
- 50% ▼ -4.00%
- Median HH income
- $34,799
- Composite
- 42.18/100
- National rank
- #3290
- State rank
- #36 of 73 in FL
Livability — Cross City
- Score
- 70/100
- State rank
- #412
- US rank
- #7340
Category grades
Schools grade is shown separately in the Schools card above.
Census & demographics
- Census place
- Cross City, FL
- Population (ZIP)
- 5,423
Population outlook (Dixie County) Hauer SSP2
- Today (2025)
- 15,122 people
- By 2030
- 14,521 · -4.0%
- By 2040
- 13,503 · -10.7%
- By 2050
- 12,671 · -16.2%
- By 2075
- 10,857 · -28.2%
- By 2100
- 8,344 · -44.8%
Race, ethnicity, and origin ACS 2023
- Neighborhood character
- Diverse neighborhood (Simpson 0.59)
- Race & ethnicity
- White 61% Black 18% Two or more races 15% Hispanic / Latino 7% Asian 1%
- Hispanic origin (detail)
- Cuban 2%
- Common ancestry
- Italian 1% Hispanic 1% Romanian 1%
- Foreign-born
- 3% · Canada
- Languages at home
- 93% English-only · Spanish 5% Arabic 1% Other Asian/Pacific 1%
Political lean MEDSL · Dixie
- 2024 margin
- Solid R (+70.4) · D 14.5% · R 84.9%
- 2008→2024 swing
- -25.4pp toward R · 2008: -45.0pp · 2024: -70.4pp
- All cycles
- 2024: R+70.4 2020: R+66.0 2016: R+63.2 2012: R+46.9 2008: R+45.0
Not yet ingested
- Civics
- —
Market trends
- HPI YoY
- ▲ 4.18%
- Current HPI
- 398.3675
- Rent YoY
- —
- Metro
- —
- State GDP YoY
- ▲ 3.28%
- F500 in state
- 36
Industry mix (Fortune 500 HQ in FL)
| Industry | F500 HQs | Revenue |
|---|---|---|
| Industrial Technology | 2 | $29B |
|
||
| Insurance | 2 | $17B |
|
||
| Retail | 1 | $60B |
|
||
| Technology Distribution | 1 | $58B |
|
||
| Homebuilding | 1 | $35B |
|
||
| Technology Manufacturing | 1 | $35B |
|
||
Price history
+325.6% since first listed4 events — show timeline
- 2026-01-02 Listed $114,900 DGLMLS
- 2025-10-02 Listed $117,900 DGLMLS
- 2005-01-31 Sold (Public Records) $29,000 Public Records
- 2001-10-09 Sold (Public Records) $27,000 Public Records
Property tax history
+13.3%/yrLatest (2025): $554 · +5.2% YoY. Source: county tax records.
Cash-flow waterfall
monthlySold comps — $/sqft
last 12 mo · ≤1 miLoading sold comps…