 🏗️ New Construction
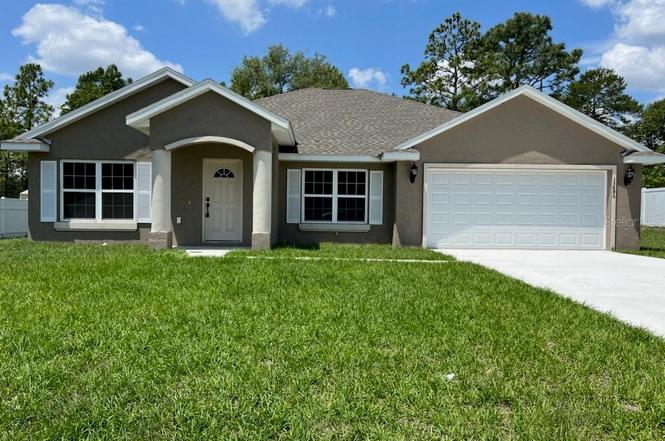
5833 NW 61st Ct · Ocala, FL
Flood risk 1/10 · Minimal
- FEMA flood zone
- X (unshaded)
- Chance of flooding over 30 yrs
- 0.0%
- Est. flood insurance / yr
- $507 – $1,088
Fire risk 5/10 · Moderate
- Est. fire insurance / yr
- $947 – $1,759
Heat risk 8/10 · Major
- Hot days now (above 107°F)
- 7 days/yr
- Hot days in 30 yrs
- 21 days/yr
Wind risk 9/10 · Severe
- Chance of severe wind over 30 yrs
- 99.0%
Air-quality risk 3/10 · Minor
- Unhealthy air days now
- 3 days/yr
- Unhealthy air days in 30 yrs
- 3 days/yr
Risk factors via First Street. Map © Google.
Why this score? — see what drove the D+ grade
The composite is a weighted blend of 9 inputs, each scored 0–100. Each bar is that input's sub-score; the figure is the points it added to the 100-point composite (weight × sub-score).
- Cash flow +14.3/30.0
- ARV discount +7.5/15.0
- Rent growth +5.0/5.0
- Condition / age +5.0/5.0
- DSCR +4.4/10.0
- 1% rule +4.0/10.0
- Schools +3.6/10.0
- Livability +3.5/5.0
- Appreciation +0.0/10.0
$299,900
🖨 Deal sheet (PDF) 📄 Offer letter ✓ Due diligence
Listing remarks
Under Construction. BEAUTIFUL BRAND-NEW Custom home. Pictures are of a Model Home and not the actual home. Block with stucco 3 bedroom, 2 bath with attached 2 car garage. Beautiful cabinets and granite countertops accent the gorgeous kitchen. Appliances (Refrigerator, Range with hood , Microwave and Dishwasher). Walk-in closet in Master. Beautiful Lanai. High Efficiency windows. Gorgeous 14x22 back Lanai
Key facts
- Stucco
- Walk-in closet
- Gorgeous kitchen
Tags
Neighborhood map
What this means for you Summary
Snapshot
- This is a 3-bed/2.0-bath single-family listed at $300k. Condition is rated excellent.
Deal economics
- At list price, monthly cash flow is $52 ($628/yr) — positive.
- To cash-flow at today's rent, offer at most $285k (5.0% below list).
- To meet the 1% rule (rent ≥ 1% of price), the offer needs to be $249k (16.9% below list).
- Recommended offer: $249k (16.9% below list) — sets the bar for 1% rule.
- Cap rate 6.5% vs local median 4.1% in Ocala — top-decile yield for the area; either an underpriced asset or a hidden risk that comps aren't pricing in. Stress-test before assuming the spread holds.
Location & tenants
- Location reads 69/100 on livability (#476 in FL) — a middle-class / working-renter tenant base. Strengths: cost of living A+, housing A+, health & safety A+; Watch: crime F, amenities F, commute F.
- Marion (rural): math 42% / reading 43% proficiency, ranked #61 of 73 in FL (top 84%) — families likely to look elsewhere, expect single-tenant / working-renter base with shorter leases; 61% free/reduced lunch — lower-income household profile, screen leases tightly.
- Zoned schools: Fessenden Elementary School (math 37% / reading 37%, grade F, #1,609 of 2,144 statewide, top 77%, 417 students, 79% FRL); North Marion Middle School (math 35% / reading 34%, grade F, #421 of 571 statewide, top 74%, 803 students, 72% FRL); North Marion High School (math 20% / reading 32%, grade F, #494 of 667 statewide, top 75%, 1,303 students, 66% FRL).
- Market conditions: Rents rising fast (+11.1%/yr); 670 active listings in the ZIP; 20 comparable units currently listed for rent nearby; rentals at typical pace (median 23d on market — plan ~3-4 weeks tenant-placement turnaround); 7,071 units permitted in Marion County in 2024 (534 in 5+ unit buildings).
- At $2,492/mo this rent would consume 45% of the median local household income ($66k/yr) (locally 282% of renters already pay >50% of income on rent) — very limited rent-growth headroom before tenants either downsize or default.
Forward outlook
- Local home prices are declining (-3.0%/yr); year-one equity from $2k of loan paydown is wiped out by about $8k of value loss. Plan a longer hold.
- Marion County population projected at +13% by 2050 — modest demand growth; plan on rents tracking national, not racing it.
Negotiation context
- It's been on market 28 days — a 2% lower offer ($295k) is reasonable based on typical stale-listing flexibility.
Risks & watch-outs
- Climate carrying-cost: severe wind risk, 99% chance of damaging wind over 30y; moderate wildfire risk; extreme-heat days projected 7→21/yr by 2055 (HVAC capex compounding) — expect insurance premiums to compound above CPI over the hold.
Questions for the listing agent
- Is there a deadline driving the sale (1031 exchange, divorce, estate, relocation)? That informs how much negotiation room exists.
- Crime grade is F in this area — have there been break-ins, vandalism, or insurance claims at this property in the last 3 years? What carrier currently insures it and at what premium?
- The area grade is low — what's the realistic commute time and amenity access for the typical tenant pool here? Any planned neighborhood developments (good or bad) we should know about?
- What's the average days-on-market for RENTAL listings here right now (not sales)? A rising rental-DOM trend means longer vacancies and softer asking-rent achievability than the comps imply.
- What's the recent tenant-quality profile in this submarket — average credit score on applications, eviction rate, late-payment / NSF rate, and stable-employment percentage? A property-management company in the area should have these aggregated.
- How much new for-sale + rental construction is in the pipeline within 1–3 miles? Heavy new supply typically softens prices + rents 12–24 months out; constrained supply supports both.
Investment metrics
- 1% rule
- 0.90% ✗
- Cap rate
- 6.52%
- Cash-on-cash
- 0.81%
- DSCR
- 1.04
- GRM
- 9.3
CMA / ARV
- ARV (on-the-fly)
- $277,277
- Comps found
- 5
Show comp detail 5 sales within ~0.75 mi
| Address | Dist | Beds/Ba | Sqft | Sold | Price | $/sf | Match |
|---|---|---|---|---|---|---|---|
| 5851 NW 62nd Ave | 0.06mi | 3/2.0 | 1,719 (-11%) | 3mo | $245,000 | $143 | 76 |
| 5426 NW 56th Ter | 0.55mi | 3/2.0 | 1,936 (-0%) | 15mo | $299,900 | $155 | 62 |
| 5400 NW 62nd Pl | 0.73mi | 3/2.0 | 1,840 (-5%) | 1mo | $245,000 | $133 | 57 |
| 5410 NW 62nd Ave | 0.33mi | 3/2.0 | 1,706 (-12%) | 12mo | $295,000 | $173 | 55 |
| 6663 NW 60th St | 0.55mi | 4/2.0 (+1) | 1,845 (-5%) | 11mo | $223,000 | $121 | 52 |
Match score weights: distance 35% · size 25% · config 20% · recency 20%. Top-matched comps best support the ARV.
Projected returns pro-forma
-3.0% appreciation · 8.0% rent growth · sell at horizon
- IRR
- -9.5%
- Equity multiple
- 0.63×
- Total profit
- $-28,394
- Equity at exit
- $41,343
- IRR
- 5.6%
- Equity multiple
- 1.51×
- Total profit
- $39,652
- Equity at exit
- $23,974
Cash invested: $77,638 (down + closing). Projections, not guarantees.
Landlord ↔ Tenant lean methodology
- Overall (STATE)
- 87 Strongly Landlord-Friendly
- State Florida
- 87 Strongly Landlord-Friendly · R+3
- County
- — inherits STATE
- City
- — inherits STATE
ZIP-level market 34482
- Rents YoY
- 11.1%
- Active inventory
- 670
- Price-to-rent
- 10.0×
Monthly cashflow live
- Estimated rent
- $2,492 high interval (Pro) →
- Mortgage (P&I)
- −$1,454
- Tax est. 1.5%
- −$347 /mo · $4,159/yr
- Insurance
- −$116
- HOA
- −$0
- Vacancy / Maint / Mgmt
- −$523
- Net cashflow
- $52
Break-even live
Sensitivity live
| Price | -10% $244 | -5% $148 | +0% $52 | +5% $-44 | +10% $-139 |
|---|---|---|---|---|---|
| Rent | -10% $-145 | -5% $-46 | +0% $52 | +5% $151 | +10% $249 |
| Rate | -1.0pp $192 | -0.5pp $123 | base $52 | +0.5pp $-20 | +1.0pp $-93 |
UW: 25.0% down · 7.5% · 30yr · 1.5% tax · 5.0% vac · 8.0% maint · 8.0% mgmt
Financing live
Cash to close
- Down payment
- $69,319
- Closing costs
- $8,318
- Reserves months
- —
- Total cash needed
- —
Loan-product check · same deal, 3 products live
Conventional
25% down · 7.5% · 30yr
- Down + closing
- —
- Monthly P&I
- —
- Monthly cashflow
- —
- DSCR
- —
- Eligible?
- —
Personal DTI + credit; lowest rate.
DSCR
20% down · 8.5% · 30yr
- Down + closing
- —
- Monthly P&I
- —
- Monthly cashflow
- —
- DSCR
- —
- Eligible?
- —
No personal income docs; deal must DSCR.
Hard money
10% down · 12.0% · 12mo
- Down + closing
- —
- Monthly P&I
- —
- Monthly cashflow
- —
- DSCR
- —
- Eligible?
- —
Short-term bridge; refi at stabilization.
Rent comps 20 comps
| Address | Beds | Baths | Sqft | Rent | $/sqft | DOM | Units | Dist |
|---|---|---|---|---|---|---|---|---|
| 6175 NW 59th Ave Ocala, FL | 3.0 | 2.0 | 1384 | $1,745 | $1.26 | 23d | 1 | 0.34mi |
| 6425 NW 62nd Ter Ocala, FL | 3.0 | 2.0 | 1349 | $3,000 | $2.22 | 23d | 1 | 0.43mi |
| 5907 NW 64th St Ocala, FL | 4.0 | 2.0 | 1313 | $1,699 | $1.29 | 23d | 1 | 0.49mi |
| 5391 NW 55th Ct Ocala, FL | 3.0 | 2.0 | 1332 | $1,650 | $1.24 | 23d | 1 | 0.66mi |
| 5401 NW 63rd Pl Ocala, FL | 3.0 | 2.0 | 1894 | $1,695 | $0.89 | 15d | 1 | 0.78mi |
| 5389 NW 48th Pl Ocala, FL | 2.0 | 2.0 | 1552 | $2,300 | $1.48 | 23d | 1 | 1.00mi |
| 5375 NW 48th Pl Ocala, FL | 2.0 | 2.0 | 1565 | $2,350 | $1.50 | 23d | 1 | 1.01mi |
| 5416 NW 46th Lane Rd Ocala, FL | 3.0 | 2.0 | 1590 | $2,300 | $1.45 | 15d | 1 | 1.04mi |
| 5358 NW 48th Pl Ocala, FL | 3.0 | 2.0 | 1565 | $2,500 | $1.60 | 23d | 1 | 1.04mi |
| 5521 NW 45th Ln Ocala, FL | 3.0 | 2.0 | 1862 | $2,600 | $1.40 | 15d | 1 | 1.05mi |
| 5293 NW 48th Pl Ocala, FL | 2.0 | 2.0 | 1552 | $2,450 | $1.58 | 23d | 1 | 1.06mi |
| 5237 NW 48th Pl Ocala, FL | 3.0 | 2.0 | 1552 | $4,500 | $2.90 | 23d | 1 | 1.10mi |
| 5347 NW 46th Lane Rd Ocala, FL | 3.0 | 2.0 | 1552 | $2,550 | $1.64 | 23d | 1 | 1.11mi |
| 5254 NW 43rd Lane Rd Ocala, FL | 3.0 | 2.0 | 1728 | $3,500 | $2.03 | 23d | 1 | 1.15mi |
| 4395 NW 55th Ter Ocala, FL | 3.0 | 2.0 | 1853 | $2,700 | $1.46 | 23d | 1 | 1.18mi |
| 5252 NW 46th Lane Rd Ocala, FL | 4.0 | 2.0 | 2034 | $2,800 | $1.38 | 23d | 1 | 1.23mi |
| 4342 NW 55th Ct Ocala, FL | 3.0 | 2.5 | 2172 | $2,600 | $1.20 | 15d | 1 | 1.23mi |
| 5227 NW 46th Lane Rd Ocala, FL | 4.0 | 2.0 | 2034 | $3,000 | $1.47 | 23d | 1 | 1.23mi |
| 4452 NW 53rd Ct Ocala, FL | 3.0 | 3.0 | 2362 | $2,800 | $1.19 | 23d | 1 | 1.24mi |
| 5530 NW 40th Loop Ocala, FL | 3.0 | 2.0 | 1622 | $2,000 | $1.23 | 23d | 1 | 1.35mi |
Listing history 2 events
-
2026-04-08status Pending
-
2026-03-11$299,900 Active
ⓘ Source: listings_history table (triggers on properties + properties_extension) + one-shot
backfill from property_details.listing_events for pre-trigger history.
Climate risk First Street
- Flood 1/10 Low FEMA zone X (unshaded) · 0% chance over 30 yrs
- Wildfire 5/10 Major
- Heat 8/10 Severe 7 d/yr ≥107°F today · 21 d/yr by 30 yrs out
- Wind 9/10 Extreme 99% chance of damaging wind over 30 yrs
- Air quality 3/10 Moderate 3 unhealthy d/yr today · 3 by 30 yrs out
Nearby sold comps map
Loading sold comps map…
Walkable amenities ~0.75 mi
Loading nearby amenities…
Taxation est. · year 1
- Rental income
- $29,901
- − Mortgage interest
- −$15,532
- − Property taxes
- −$4,159
- − Insurance
- −$1,386
- − Repairs & maintenance
- −$2,392
- − Management
- −$2,392
- − Depreciation
- −$8,066
- Taxable loss
- −$4,027
- Est. tax savings @ 24.0%
- +$966
- After-tax cash flow
- $1,594/yr
For passive investors: Depreciation is non-cash, so a rental often shows a tax loss while cash-flowing — sheltering income. Rental losses are passive: they offset passive income freely, and up to $25,000/yr can offset ordinary (W-2) income if you actively participate and your MAGI is under $100k (phasing out to $0 by $150k); unused losses carry forward. On sale, claimed depreciation is recaptured at up to 25%, and gains may owe capital-gains tax (a 1031 exchange can defer both). Figures are a year-1 estimate at your 24.0% rate — not tax advice; consult a CPA.
Condition & rehab AI · 2 photos
This newly constructed home is in excellent condition with no visible repairs or maintenance needed. It offers a beautiful and well-maintained exterior, making it an attractive option for both resale and rental.
Value-add opportunities
- Both Landscaping improvements — Enhanced landscaping can improve curb appeal and attract more potential buyers or renters.
- Both Interior updates — Updating interior features such as flooring, paint, and fixtures can increase the home's value and appeal to a broader market.
Renovation cost estimate screening
Value-add ROI direction
- Both Landscaping improvements — Enhanced landscaping can improve curb appeal and attract more potential buyers or renters. ↑
- Both Interior updates — Updating interior features such as flooring, paint, and fixtures can increase the home's value and appeal to a broader market. ↑
ⓘ Cost ranges are severity-bucket heuristics (US national rule-of-thumb). Get contractor quotes + a written scope before underwriting a rehab budget.
Schools (NCES district)
- District
- Marion
- NCES district ID
- 1201260
- Math proficiency
- 42% ▼ -7.00%
- Reading proficiency
- 43% ▼ -4.00%
- Median HH income
- $40,015
- Composite
- 35.61/100
- National rank
- #4890
- State rank
- #61 of 73 in FL
Livability — Ocala
- Score
- 69/100
- State rank
- #476
- US rank
- #8461
Category grades
Schools grade is shown separately in the Schools card above.
Census & demographics
- County
- Marion County · 315,796 people
- City population
- 263,375
- Metro
- Ocala, FL
- Population (ZIP)
- 22,807
- Household income
- $65,901
- Rent vs Own
- Severe rent burden
- 282.0
Population outlook (Marion County) Hauer SSP2
- Today (2025)
- 365,905 people
- By 2030
- 376,768 · +3.0%
- By 2040
- 396,555 · +8.4%
- By 2050
- 412,723 · +12.8%
- By 2075
- 446,090 · +21.9%
- By 2100
- 436,193 · +19.2%
Race, ethnicity, and origin ACS 2023
- Neighborhood character
- Majority White (63%)
- Race & ethnicity
- White 63% Hispanic / Latino 19% Black 14% Two or more races 12%
- Hispanic origin (detail)
- Mexican 6% Puerto Rican 9% Cuban 2%
- Common ancestry
- Lithuanian 2% Romanian 2% Slovak 2%
- Foreign-born
- 10% · Canada
- Languages at home
- 81% English-only · Spanish 16% Other Indo-European 1%
Political lean MEDSL · Marion
- 2024 margin
- Solid R (+31.6) · D 33.8% · R 65.5%
- 2008→2024 swing
- -20.0pp toward R · 2008: -11.6pp · 2024: -31.6pp
- All cycles
- 2024: R+31.6 2020: R+25.9 2016: R+26.2 2012: R+16.2 2008: R+11.6
Not yet ingested
- Civics
- —
Market trends
- HPI YoY
- ▼ -133.62%
- Current HPI
- 194.3857
- Rent YoY
- ▲ 11.12%
- Metro
- Ocala, FL
- State GDP YoY
- ▲ 3.28%
- F500 in state
- 36
Industry mix (Fortune 500 HQ in FL)
| Industry | F500 HQs | Revenue |
|---|---|---|
| Industrial Technology | 2 | $29B |
|
||
| Insurance | 2 | $17B |
|
||
| Retail | 1 | $60B |
|
||
| Technology Distribution | 1 | $58B |
|
||
| Homebuilding | 1 | $35B |
|
||
| Technology Manufacturing | 1 | $35B |
|
||
Price history
2 events — show timeline
- 2026-04-08 Pending — Stellar MLS as Distributed by MLS Grid
- 2026-03-11 Listed $299,900 Stellar MLS as Distributed by MLS Grid
Cash-flow waterfall
monthlySold comps — $/sqft
last 12 mo · ≤1 miLoading sold comps…